Financial Performance Analysis of Cargills PLC and Investment Advice
VerifiedAdded on 2022/12/26
|17
|3402
|69
Report
AI Summary
This report conducts a financial analysis of Cargills PLC to provide an investment recommendation. It begins with a company description, highlighting Cargills' market position and business segments, followed by a comparison with its competitor, Keells Foods. The analysis employs trend analysis of financial statement items and ratio analysis, including profitability, liquidity, gearing, and asset utilization ratios, using data from the past five years. The report compares the financial performance of Cargills and Keells, culminating in an investment recommendation. It also addresses the assumptions and limitations of the analysis. The findings reveal Cargills' growth in revenue, profits, and assets, though its liquidity and financial leverage require attention. Key ratios such as gross margin, operating profit margin, ROE, and ROCE are compared, revealing insights into each company's financial health and performance. The report concludes with an investment recommendation based on the financial analysis.
Running Head: Financial Analysis of Cargills
Financial Analysis
Cargills
Student Name
Financial Analysis
Cargills
Student Name
Paraphrase This Document
Need a fresh take? Get an instant paraphrase of this document with our AI Paraphraser
Financial Analysis of Cargills
Contents
1) Introduction...................................................................................................................................2
2) Company Description: Cargills......................................................................................................3
3) Comparison and Analysis of Financial Performance of Cargills and Keells..................................5
Trend Analysis:.................................................................................................................................5
Ratio Analysis:..................................................................................................................................6
4) Investment Recommendation.......................................................................................................12
5) Assumptions and limitations........................................................................................................13
6) Conclusion...................................................................................................................................14
7) References...................................................................................................................................15
1
Financial Analysis of Cargills
1) Introduction
This report performs the financial analysis of Cargills PLC to make an investment
recommendation regarding its equity investment. The report describes the business operations
of Cargills and compares its market position with its competitor Keells Foods. Trend analysis
of the income statement and balance sheet items and ratio analysis is used to perform this
financial analysis. The data used for this analysis is taken from the last five years annual
reports of both the companies. The various ratios used are profitability ratios, liquidity ratios,
gearing ratios and asset utilisation ratios. The report analyses and compares the financial
performance of Cargills with Keels. It then makes investment recommendation out of these
two companies. The report also lists the assumptions and limitations used in this analysis and
recommendation process.
2
⊘ This is a preview!⊘
Do you want full access?
Subscribe today to unlock all pages.
Trusted by 1+ million students worldwide
Financial Analysis of Cargills
2) Company Description: Cargills
Cargills (Ceylon) PLC is the largest food retailer in Sri Lanka. The company was established
in 1844. Its retail arm operates under the name of Cargills Food City and its manufacturing
brands operate under the name of: Goldi, Finest, Supremo and Sams (processed meats);
Magic, Kotmale and Heavenly (ice cream and dairy products); Kist (processed fruits and
vegetables); Knuckles (bottled water) (Cargills, n.d.).
The three segments in which Cargills deal are retail, fast moving consumer goods and
restaurant. The various products manufactured or processed by the company are meats, dairy,
ice cream, cheese, jams, nectars and fruit juices. Cargills operate more than 350 retail stores
and approximately 31 KFC and TGIF franchise restaurants in Sri Lanka (Bloomberg, n.d.).
The Sri Lankan brick and mortar food retail business has a lot of growth potential due to the
rapid urbanisation and increasing disposable incomes. It is expected that this market will
grow in the mid-teens over the mid-term. There is high competition as everyone wants to
grab maximum possible share of this growing industry. Cargills which operates more than
350 stores faces major competition from Keels which operates close to 100 stores and offers
similar product portfolio (Daily FT, 2018).
Cargills holds competitive advantage over its competitors because of its huge market share
that allows it to be a low cost producer. The company provides value proposition to its
customers in terms of price as its vast network of farmers and stores provides supply chain
efficiencies. Cargills has more of a sub-urban orientation but its competitor, Keells caters to
affluent urban regions with its lavish parking facilities and comparatively premium product
range (Jayasundera, 2018).
But the overall potential of the food retail industry is enormous so there is no issue of any one
company’s growth coming at the cost of others. It is perfect strategy to have unique business
models to strengthen the company’s position in the market and have sustainable growth.
What matters most is the rapid expansion by the existing players and the way in which they
present themselves (Daily FT, 2018). Cargills has been making continuous investments to
3
Paraphrase This Document
Need a fresh take? Get an instant paraphrase of this document with our AI Paraphraser
Financial Analysis of Cargills
increase its market share and to upgrade its manufactured capital. To achieve its goals
Cargills has been focusing towards improving its asset utilisation, increasing its capacity
utilisation, improving its pricing strategies with farmers/suppliers, improving its distribution
and warehousing operations, retaining its existing customers and identifying the untapped
markets (Cargills Annual Report, 2018).
4
Financial Analysis of Cargills
3) Comparison and Analysis of Financial Performance of Cargills and
Keells
Trend Analysis:
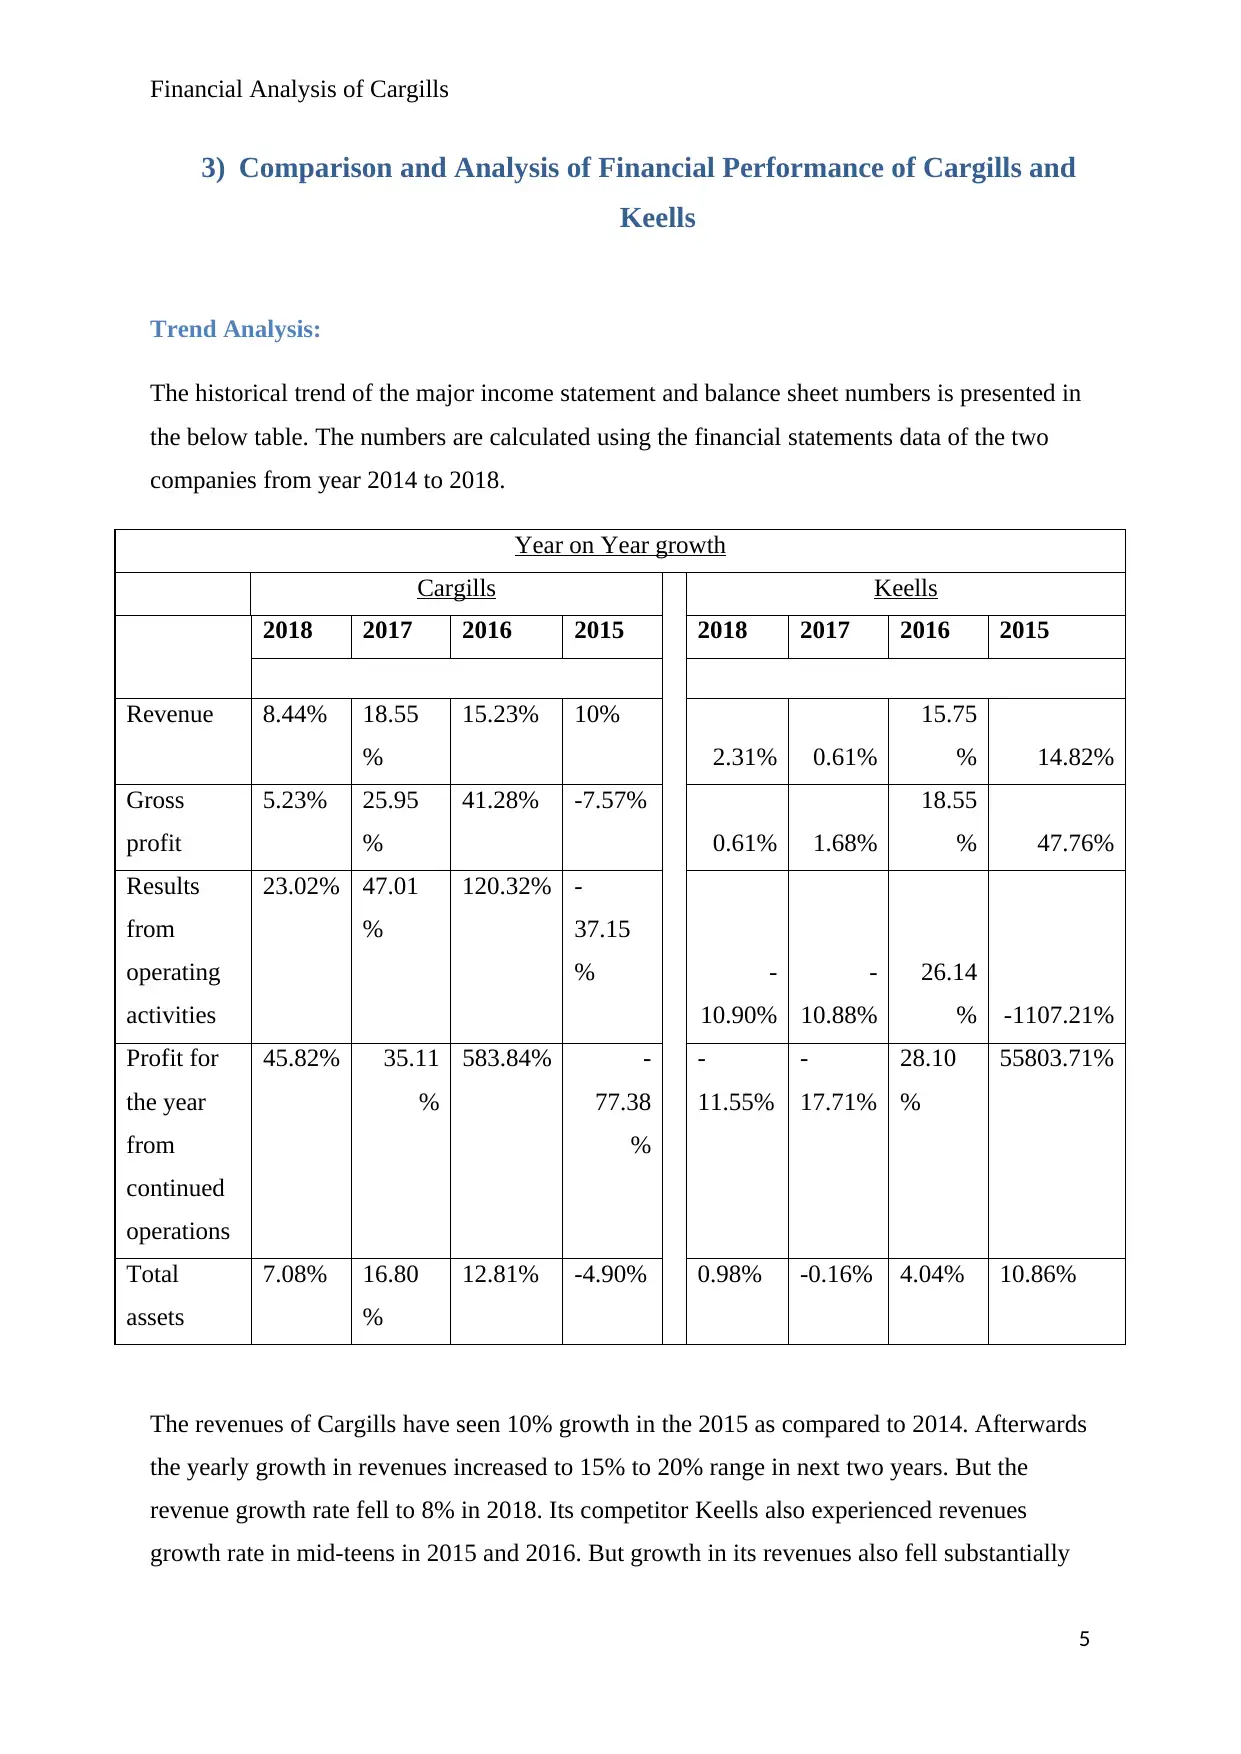
The historical trend of the major income statement and balance sheet numbers is presented in
the below table. The numbers are calculated using the financial statements data of the two
companies from year 2014 to 2018.
Year on Year growth
Cargills Keells
2018 2017 2016 2015 2018 2017 2016 2015
Revenue 8.44% 18.55
%
15.23% 10%
2.31% 0.61%
15.75
% 14.82%
Gross
profit
5.23% 25.95
%
41.28% -7.57%
0.61% 1.68%
18.55
% 47.76%
Results
from
operating
activities
23.02% 47.01
%
120.32% -
37.15
% -
10.90%
-
10.88%
26.14
% -1107.21%
Profit for
the year
from
continued
operations
45.82% 35.11
%
583.84% -
77.38
%
-
11.55%
-
17.71%
28.10
%
55803.71%
Total
assets
7.08% 16.80
%
12.81% -4.90% 0.98% -0.16% 4.04% 10.86%
The revenues of Cargills have seen 10% growth in the 2015 as compared to 2014. Afterwards
the yearly growth in revenues increased to 15% to 20% range in next two years. But the
revenue growth rate fell to 8% in 2018. Its competitor Keells also experienced revenues
growth rate in mid-teens in 2015 and 2016. But growth in its revenues also fell substantially
5
3) Comparison and Analysis of Financial Performance of Cargills and
Keells
Trend Analysis:
The historical trend of the major income statement and balance sheet numbers is presented in
the below table. The numbers are calculated using the financial statements data of the two
companies from year 2014 to 2018.
Year on Year growth
Cargills Keells
2018 2017 2016 2015 2018 2017 2016 2015
Revenue 8.44% 18.55
%
15.23% 10%
2.31% 0.61%
15.75
% 14.82%
Gross
profit
5.23% 25.95
%
41.28% -7.57%
0.61% 1.68%
18.55
% 47.76%
Results
from
operating
activities
23.02% 47.01
%
120.32% -
37.15
% -
10.90%
-
10.88%
26.14
% -1107.21%
Profit for
the year
from
continued
operations
45.82% 35.11
%
583.84% -
77.38
%
-
11.55%
-
17.71%
28.10
%
55803.71%
Total
assets
7.08% 16.80
%
12.81% -4.90% 0.98% -0.16% 4.04% 10.86%
The revenues of Cargills have seen 10% growth in the 2015 as compared to 2014. Afterwards
the yearly growth in revenues increased to 15% to 20% range in next two years. But the
revenue growth rate fell to 8% in 2018. Its competitor Keells also experienced revenues
growth rate in mid-teens in 2015 and 2016. But growth in its revenues also fell substantially
5
⊘ This is a preview!⊘
Do you want full access?
Subscribe today to unlock all pages.
Trusted by 1+ million students worldwide
Financial Analysis of Cargills
in next two years. This can be due to the subdued consumer demand for FMCG and related
products due to overall economic slowdown (Daily FT, 2018). The gross, operating and net
profits of Cargills noticed high annual growth in 2016 but they have grown at decreasing rate
in 2017 and 2018. Similar trend was also seen in growth rates of various profits of Keells.
The growth rate in most of the income statement numbers was higher in this period for
Cargills as compared to Keels. This shows that Cargills business has been growing at higher
rate.
The annual growth in the total assets of the Cargills was higher than Keells in this period,
which shows that Cargills has been making a lot of capital investments for its business
expansion.
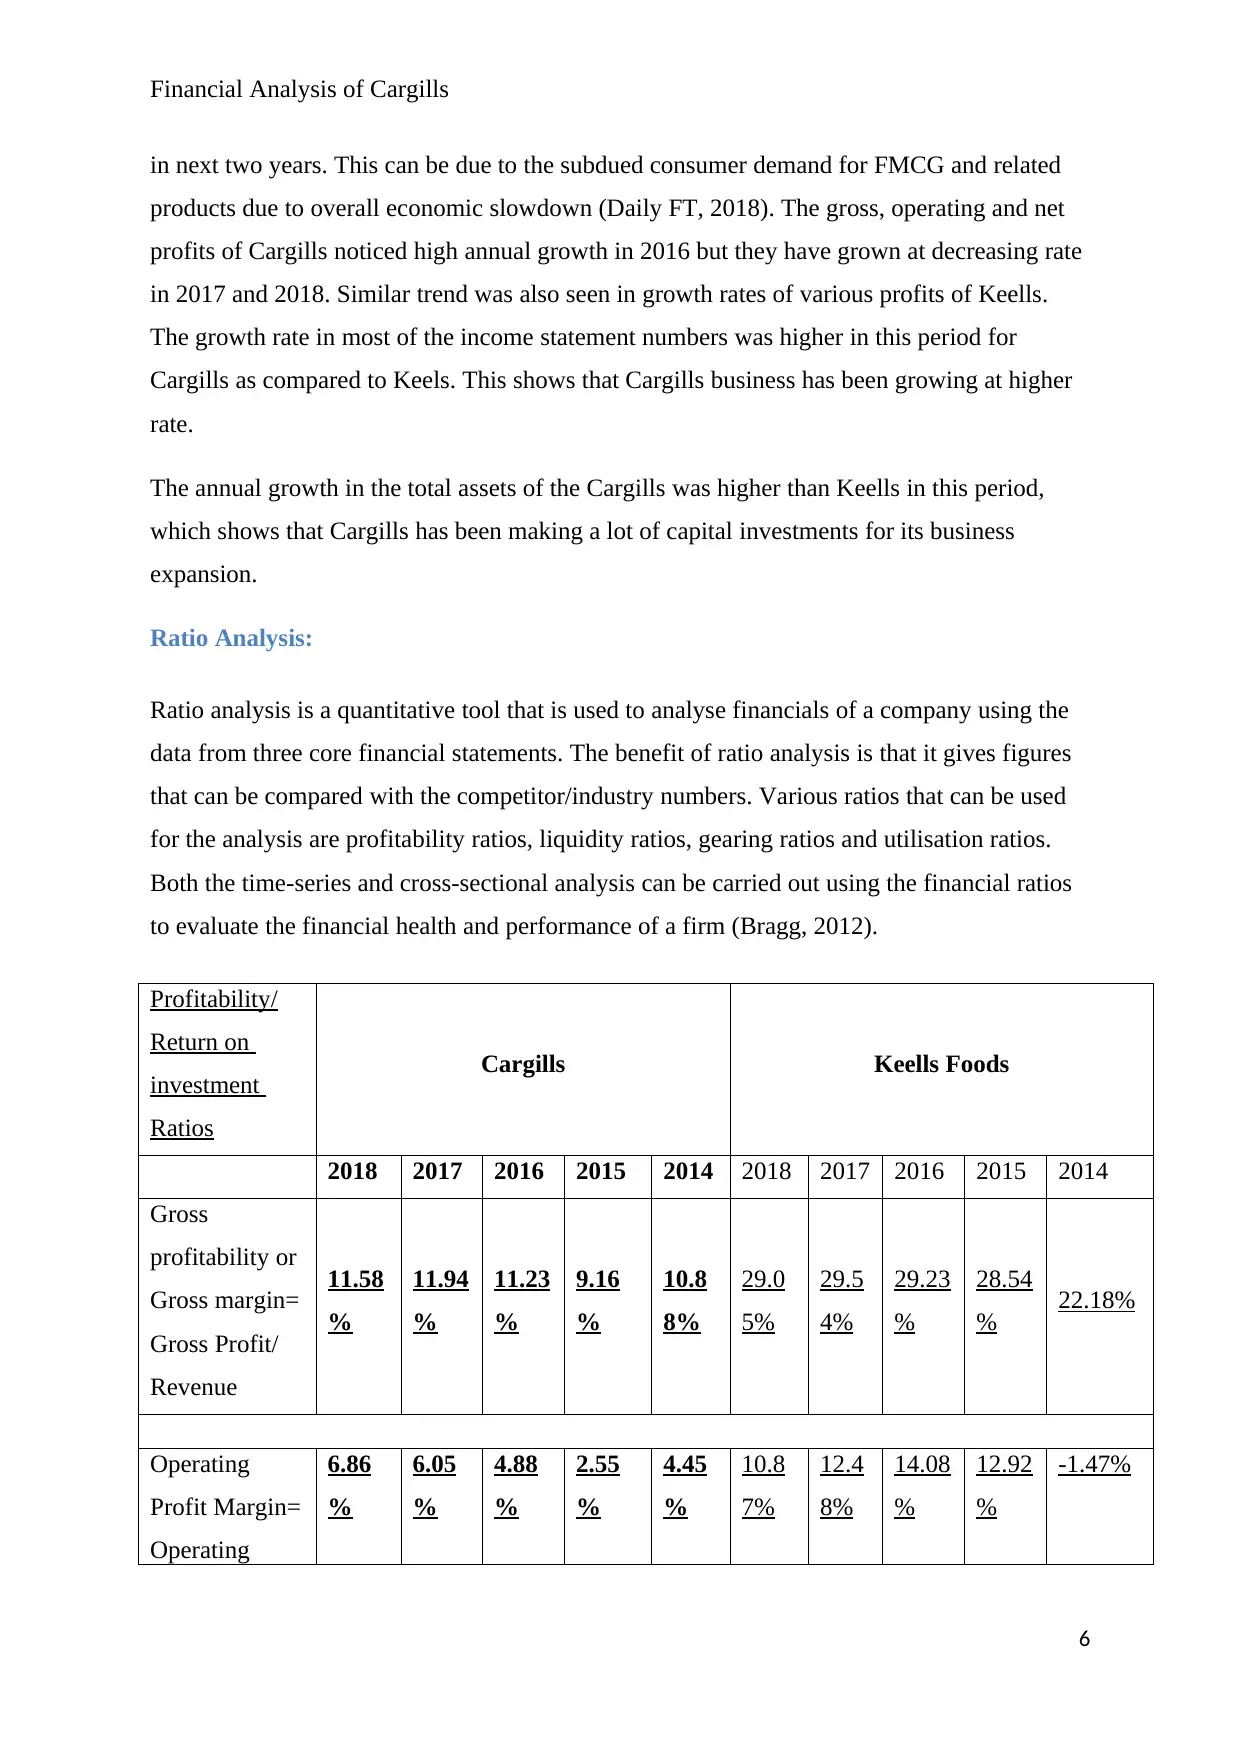
Ratio Analysis:
Ratio analysis is a quantitative tool that is used to analyse financials of a company using the
data from three core financial statements. The benefit of ratio analysis is that it gives figures
that can be compared with the competitor/industry numbers. Various ratios that can be used
for the analysis are profitability ratios, liquidity ratios, gearing ratios and utilisation ratios.
Both the time-series and cross-sectional analysis can be carried out using the financial ratios
to evaluate the financial health and performance of a firm (Bragg, 2012).
Profitability/
Return on
investment
Ratios
Cargills Keells Foods
2018 2017 2016 2015 2014 2018 2017 2016 2015 2014
Gross
profitability or
Gross margin=
Gross Profit/
Revenue
11.58
%
11.94
%
11.23
%
9.16
%
10.8
8%
29.0
5%
29.5
4%
29.23
%
28.54
% 22.18%
Operating
Profit Margin=
Operating
6.86
%
6.05
%
4.88
%
2.55
%
4.45
%
10.8
7%
12.4
8%
14.08
%
12.92
%
-1.47%
6
in next two years. This can be due to the subdued consumer demand for FMCG and related
products due to overall economic slowdown (Daily FT, 2018). The gross, operating and net
profits of Cargills noticed high annual growth in 2016 but they have grown at decreasing rate
in 2017 and 2018. Similar trend was also seen in growth rates of various profits of Keells.
The growth rate in most of the income statement numbers was higher in this period for
Cargills as compared to Keels. This shows that Cargills business has been growing at higher
rate.
The annual growth in the total assets of the Cargills was higher than Keells in this period,
which shows that Cargills has been making a lot of capital investments for its business
expansion.
Ratio Analysis:
Ratio analysis is a quantitative tool that is used to analyse financials of a company using the
data from three core financial statements. The benefit of ratio analysis is that it gives figures
that can be compared with the competitor/industry numbers. Various ratios that can be used
for the analysis are profitability ratios, liquidity ratios, gearing ratios and utilisation ratios.
Both the time-series and cross-sectional analysis can be carried out using the financial ratios
to evaluate the financial health and performance of a firm (Bragg, 2012).
Profitability/
Return on
investment
Ratios
Cargills Keells Foods
2018 2017 2016 2015 2014 2018 2017 2016 2015 2014
Gross
profitability or
Gross margin=
Gross Profit/
Revenue
11.58
%
11.94
%
11.23
%
9.16
%
10.8
8%
29.0
5%
29.5
4%
29.23
%
28.54
% 22.18%
Operating
Profit Margin=
Operating
6.86
%
6.05
%
4.88
%
2.55
%
4.45
%
10.8
7%
12.4
8%
14.08
%
12.92
%
-1.47%
6
Paraphrase This Document
Need a fresh take? Get an instant paraphrase of this document with our AI Paraphraser
Financial Analysis of Cargills
Profit /
Revenue
Net
profitability or
Net margin=
Net Profit /
Revenue
3.65
%
2.71
%
2.38
%
0.40
%
1.95
%
7.81
%
9.03
%
11.05
%
9.98
% 0.02%
Return on
assets= Net
Profit /
Average Total
Assets
6.53
%
4.99
%
4.25
%
0.64
%
2.92
%
10.0
7%
11.4
3%
14.15
%
11.85
% 0.02%
Cash return on
sales= Net
cash flow from
operating
activity / Sales
or Revenue
4.05
%
4.46
%
7.51
%
0.82
%
1.76
%
0.12
%
0.12
%
0.18
%
0.02
% 0.04%
Return on
equity (ROE)
= Net Profit /
Average
Stockholder
equity
21.36
%
15.82
%
12.35
%
1.96
%
8.98
%
14.2
6%
16.0
1%
19.29
%
16.09
%
0.03%
Return on
Capital
Employed
(ROCE) =
Operating
Profit/Total
28.12
%
26.75
%
18.76
%
9.37
%
16.4
0%
16.3
5%
19.2
4%
20.43
%
17.05
%
-1.86%
7
Profit /
Revenue
Net
profitability or
Net margin=
Net Profit /
Revenue
3.65
%
2.71
%
2.38
%
0.40
%
1.95
%
7.81
%
9.03
%
11.05
%
9.98
% 0.02%
Return on
assets= Net
Profit /
Average Total
Assets
6.53
%
4.99
%
4.25
%
0.64
%
2.92
%
10.0
7%
11.4
3%
14.15
%
11.85
% 0.02%
Cash return on
sales= Net
cash flow from
operating
activity / Sales
or Revenue
4.05
%
4.46
%
7.51
%
0.82
%
1.76
%
0.12
%
0.12
%
0.18
%
0.02
% 0.04%
Return on
equity (ROE)
= Net Profit /
Average
Stockholder
equity
21.36
%
15.82
%
12.35
%
1.96
%
8.98
%
14.2
6%
16.0
1%
19.29
%
16.09
%
0.03%
Return on
Capital
Employed
(ROCE) =
Operating
Profit/Total
28.12
%
26.75
%
18.76
%
9.37
%
16.4
0%
16.3
5%
19.2
4%
20.43
%
17.05
%
-1.86%
7
Financial Analysis of Cargills
Capital
Employed
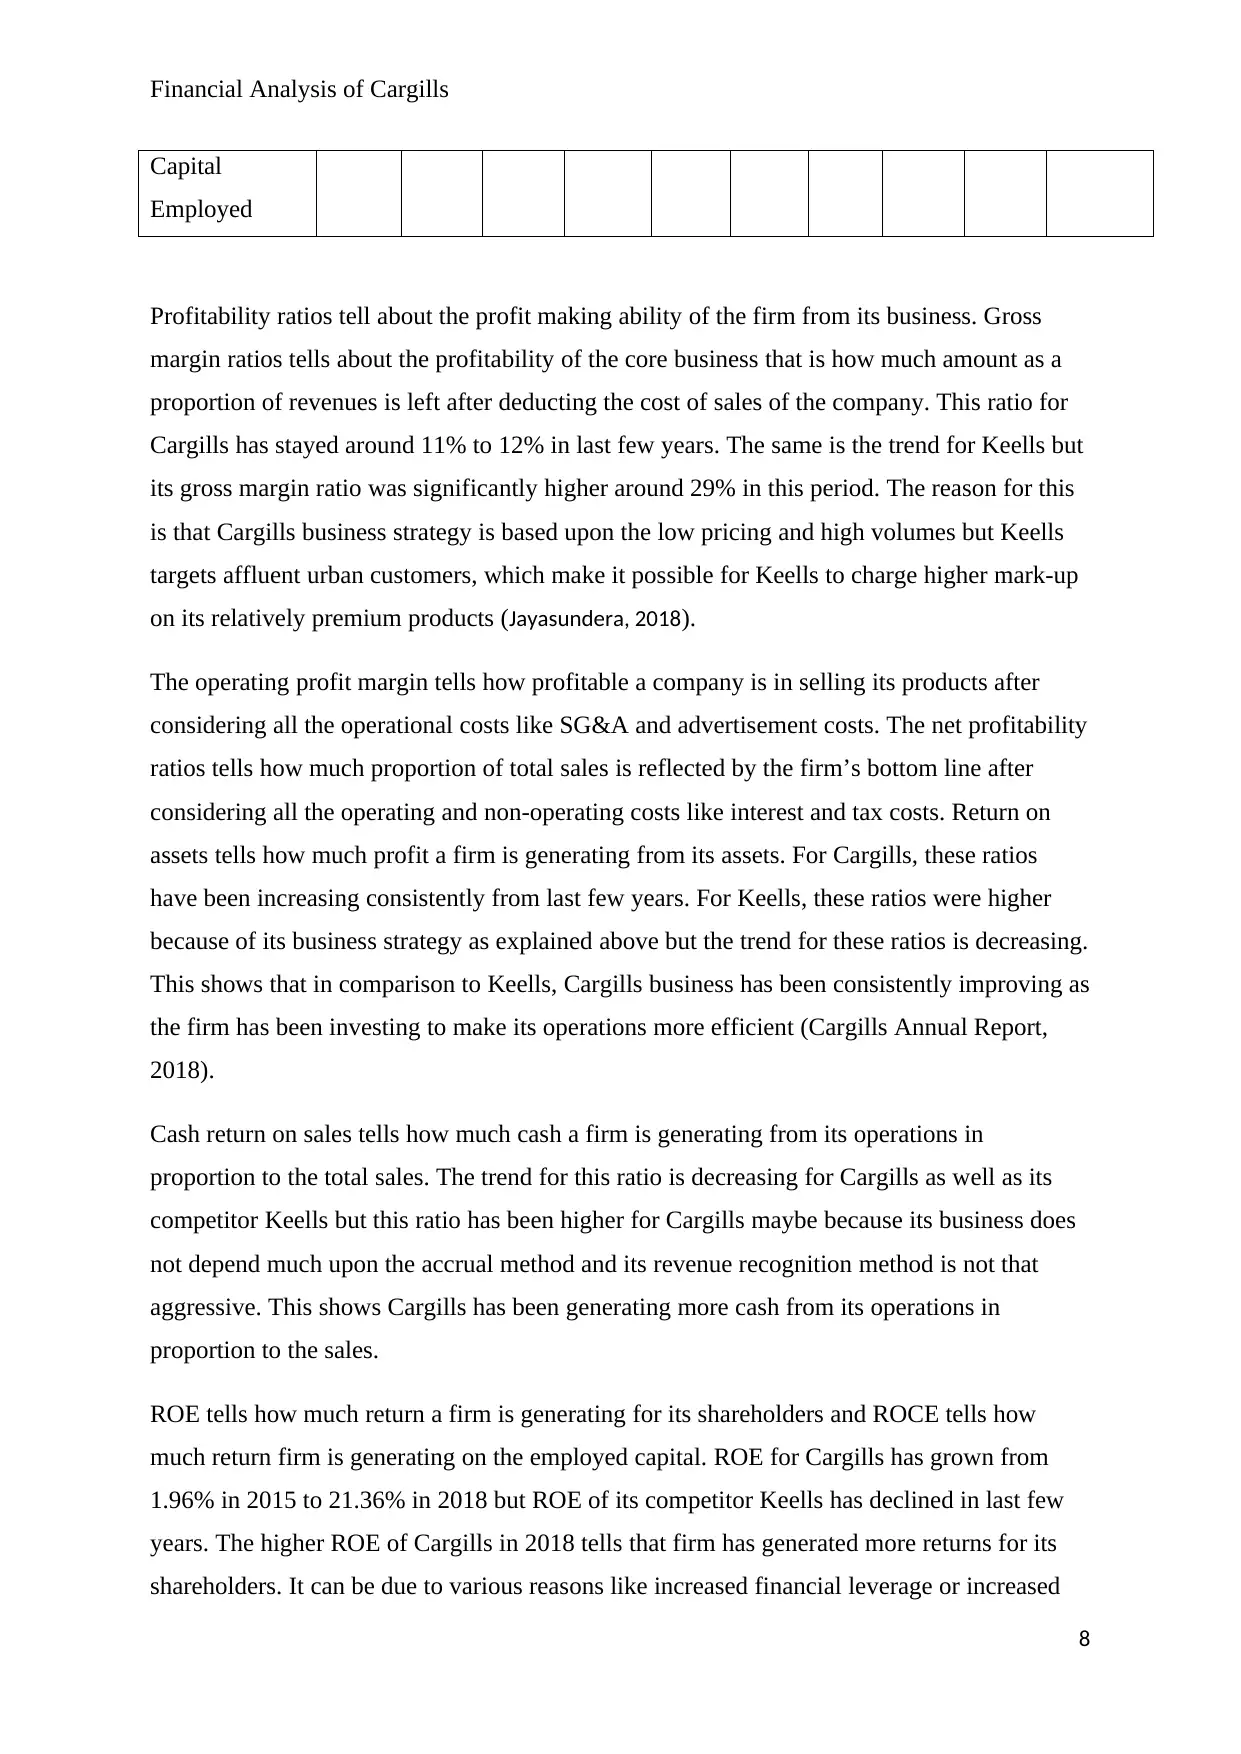
Profitability ratios tell about the profit making ability of the firm from its business. Gross
margin ratios tells about the profitability of the core business that is how much amount as a
proportion of revenues is left after deducting the cost of sales of the company. This ratio for
Cargills has stayed around 11% to 12% in last few years. The same is the trend for Keells but
its gross margin ratio was significantly higher around 29% in this period. The reason for this
is that Cargills business strategy is based upon the low pricing and high volumes but Keells
targets affluent urban customers, which make it possible for Keells to charge higher mark-up
on its relatively premium products (Jayasundera, 2018).
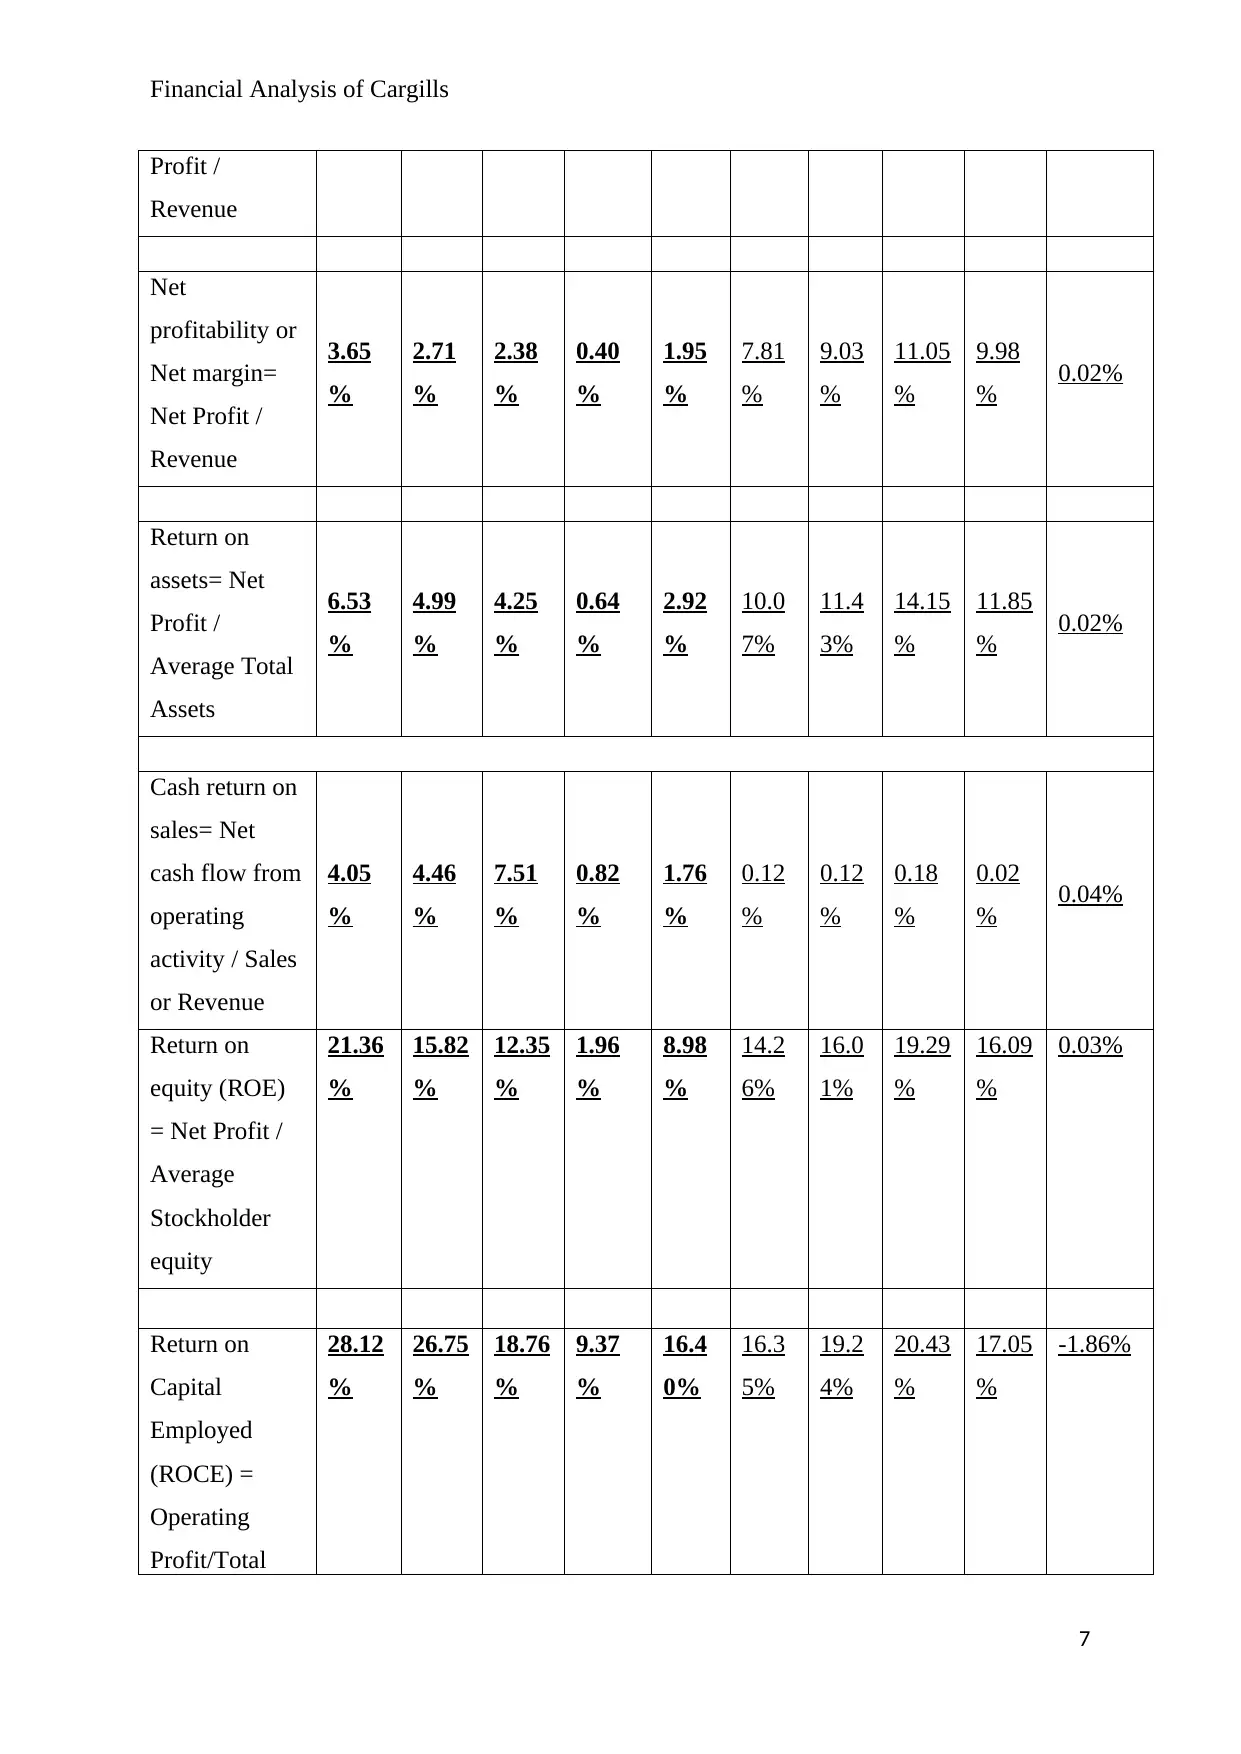
The operating profit margin tells how profitable a company is in selling its products after
considering all the operational costs like SG&A and advertisement costs. The net profitability
ratios tells how much proportion of total sales is reflected by the firm’s bottom line after
considering all the operating and non-operating costs like interest and tax costs. Return on
assets tells how much profit a firm is generating from its assets. For Cargills, these ratios
have been increasing consistently from last few years. For Keells, these ratios were higher
because of its business strategy as explained above but the trend for these ratios is decreasing.
This shows that in comparison to Keells, Cargills business has been consistently improving as
the firm has been investing to make its operations more efficient (Cargills Annual Report,
2018).
Cash return on sales tells how much cash a firm is generating from its operations in
proportion to the total sales. The trend for this ratio is decreasing for Cargills as well as its
competitor Keells but this ratio has been higher for Cargills maybe because its business does
not depend much upon the accrual method and its revenue recognition method is not that
aggressive. This shows Cargills has been generating more cash from its operations in
proportion to the sales.
ROE tells how much return a firm is generating for its shareholders and ROCE tells how
much return firm is generating on the employed capital. ROE for Cargills has grown from
1.96% in 2015 to 21.36% in 2018 but ROE of its competitor Keells has declined in last few
years. The higher ROE of Cargills in 2018 tells that firm has generated more returns for its
shareholders. It can be due to various reasons like increased financial leverage or increased
8
Capital
Employed
Profitability ratios tell about the profit making ability of the firm from its business. Gross
margin ratios tells about the profitability of the core business that is how much amount as a
proportion of revenues is left after deducting the cost of sales of the company. This ratio for
Cargills has stayed around 11% to 12% in last few years. The same is the trend for Keells but
its gross margin ratio was significantly higher around 29% in this period. The reason for this
is that Cargills business strategy is based upon the low pricing and high volumes but Keells
targets affluent urban customers, which make it possible for Keells to charge higher mark-up
on its relatively premium products (Jayasundera, 2018).
The operating profit margin tells how profitable a company is in selling its products after
considering all the operational costs like SG&A and advertisement costs. The net profitability
ratios tells how much proportion of total sales is reflected by the firm’s bottom line after
considering all the operating and non-operating costs like interest and tax costs. Return on
assets tells how much profit a firm is generating from its assets. For Cargills, these ratios
have been increasing consistently from last few years. For Keells, these ratios were higher
because of its business strategy as explained above but the trend for these ratios is decreasing.
This shows that in comparison to Keells, Cargills business has been consistently improving as
the firm has been investing to make its operations more efficient (Cargills Annual Report,
2018).
Cash return on sales tells how much cash a firm is generating from its operations in
proportion to the total sales. The trend for this ratio is decreasing for Cargills as well as its
competitor Keells but this ratio has been higher for Cargills maybe because its business does
not depend much upon the accrual method and its revenue recognition method is not that
aggressive. This shows Cargills has been generating more cash from its operations in
proportion to the sales.
ROE tells how much return a firm is generating for its shareholders and ROCE tells how
much return firm is generating on the employed capital. ROE for Cargills has grown from
1.96% in 2015 to 21.36% in 2018 but ROE of its competitor Keells has declined in last few
years. The higher ROE of Cargills in 2018 tells that firm has generated more returns for its
shareholders. It can be due to various reasons like increased financial leverage or increased
8
⊘ This is a preview!⊘
Do you want full access?
Subscribe today to unlock all pages.
Trusted by 1+ million students worldwide
Financial Analysis of Cargills
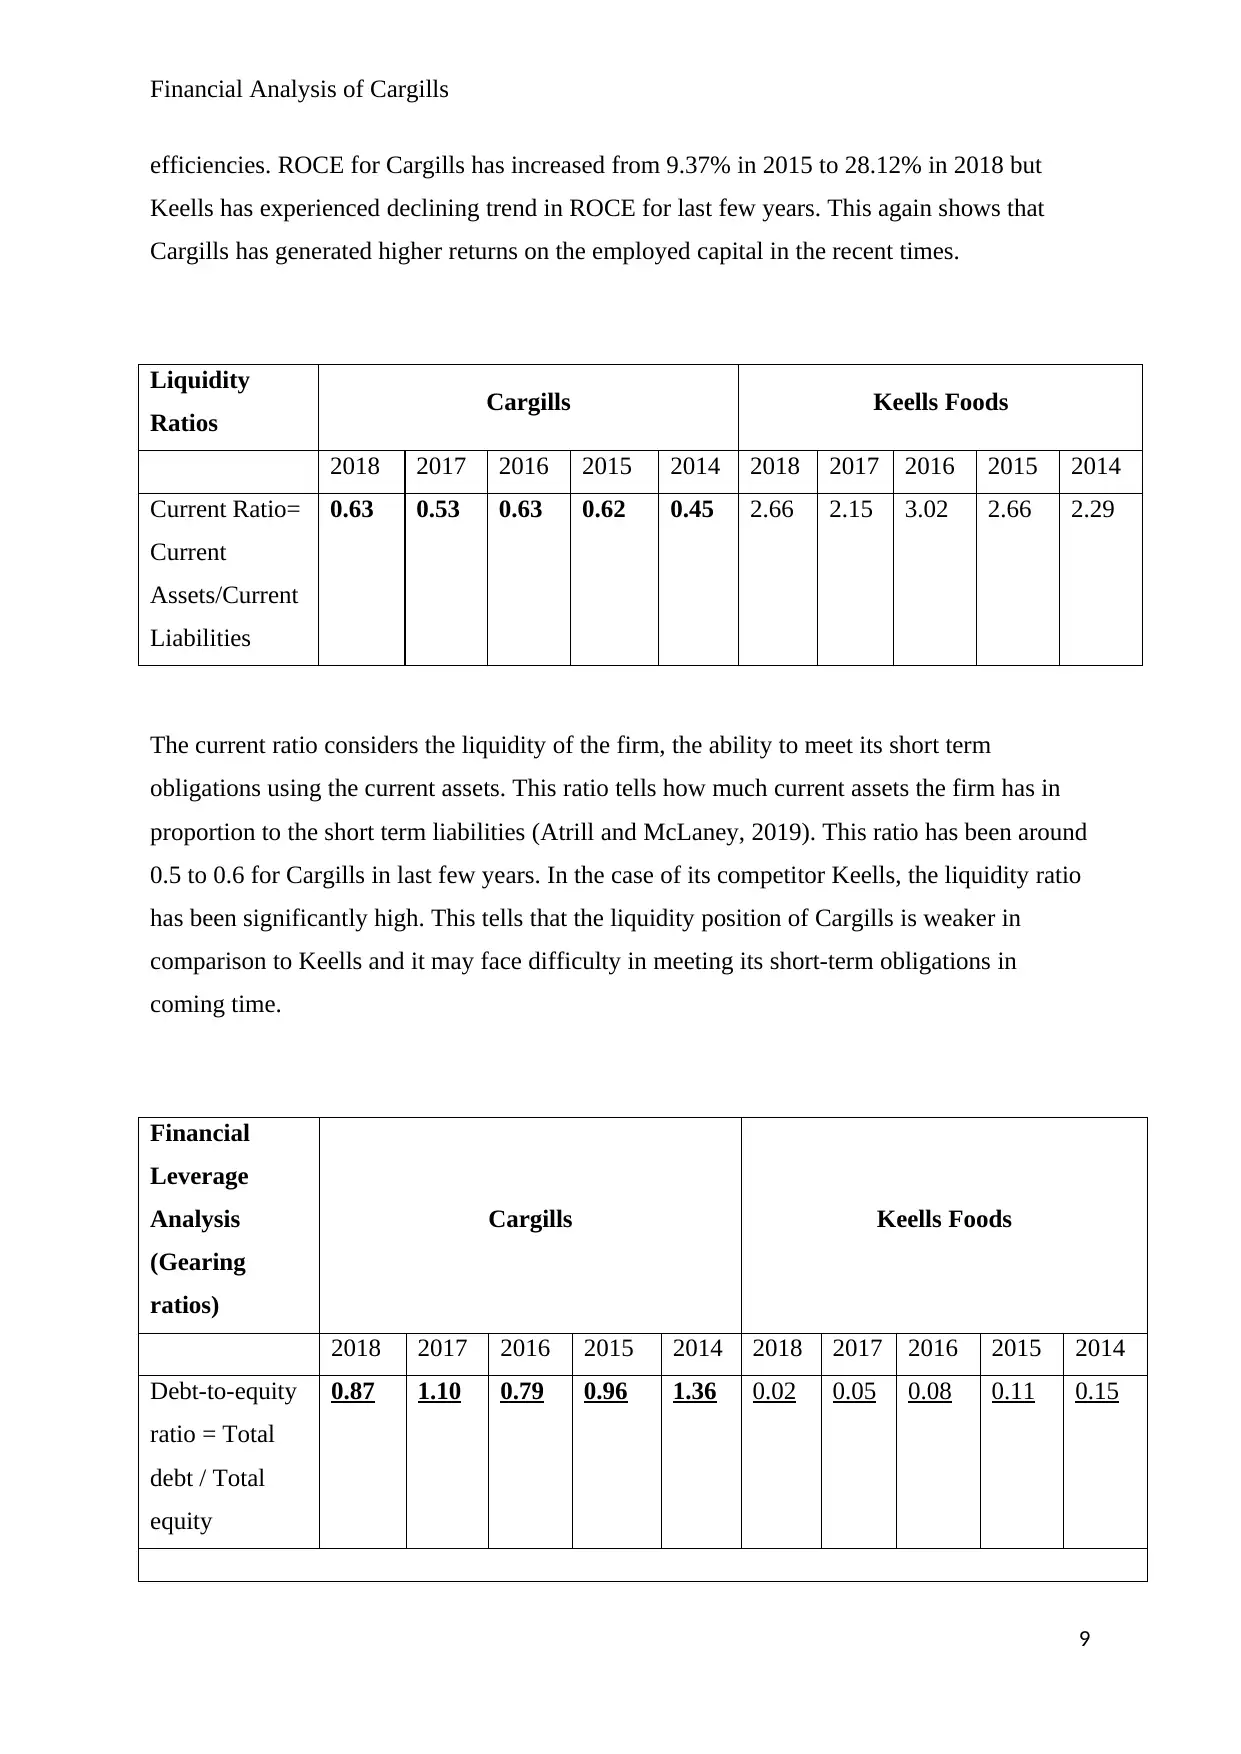
efficiencies. ROCE for Cargills has increased from 9.37% in 2015 to 28.12% in 2018 but
Keells has experienced declining trend in ROCE for last few years. This again shows that
Cargills has generated higher returns on the employed capital in the recent times.
Liquidity
Ratios Cargills Keells Foods
2018 2017 2016 2015 2014 2018 2017 2016 2015 2014
Current Ratio=
Current
Assets/Current
Liabilities
0.63 0.53 0.63 0.62 0.45 2.66 2.15 3.02 2.66 2.29
The current ratio considers the liquidity of the firm, the ability to meet its short term
obligations using the current assets. This ratio tells how much current assets the firm has in
proportion to the short term liabilities (Atrill and McLaney, 2019). This ratio has been around
0.5 to 0.6 for Cargills in last few years. In the case of its competitor Keells, the liquidity ratio
has been significantly high. This tells that the liquidity position of Cargills is weaker in
comparison to Keells and it may face difficulty in meeting its short-term obligations in
coming time.
Financial
Leverage
Analysis
(Gearing
ratios)
Cargills Keells Foods
2018 2017 2016 2015 2014 2018 2017 2016 2015 2014
Debt-to-equity
ratio = Total
debt / Total
equity
0.87 1.10 0.79 0.96 1.36 0.02 0.05 0.08 0.11 0.15
9
Paraphrase This Document
Need a fresh take? Get an instant paraphrase of this document with our AI Paraphraser
Financial Analysis of Cargills
Interest
coverage or
times interest
earned =
Earnings
before interest
and taxes
(EBIT) / Total
interest
4.79 4.53 5.73 1.89 2.09 42.47 30.3
8
31.70 17.25 -0.94
Debt ratio =
Total debt /
Total assets
27.73
%
32.07
%
27.26
%
33.00
%
42.62
%
1.38
%
3.48
%
5.55
%
7.93
%
11.21
%
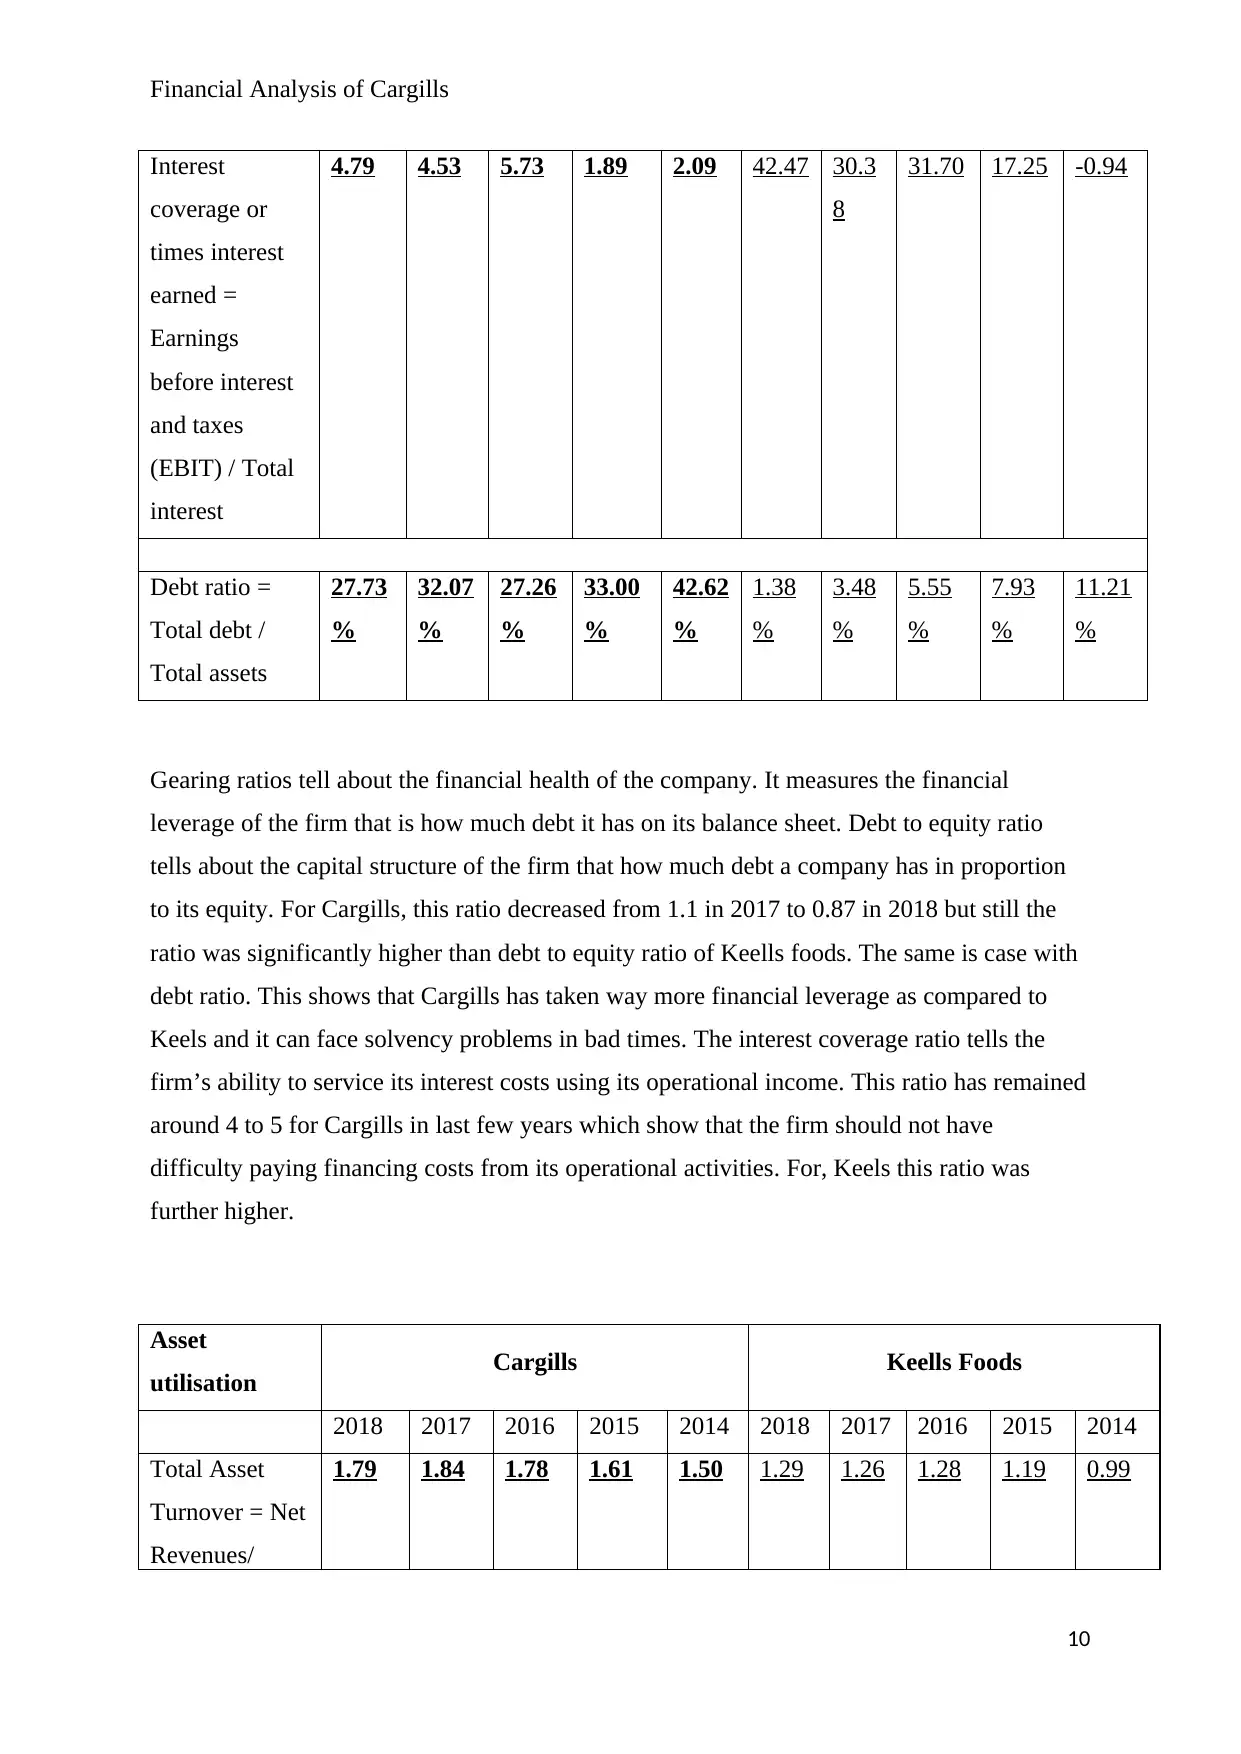
Gearing ratios tell about the financial health of the company. It measures the financial
leverage of the firm that is how much debt it has on its balance sheet. Debt to equity ratio
tells about the capital structure of the firm that how much debt a company has in proportion
to its equity. For Cargills, this ratio decreased from 1.1 in 2017 to 0.87 in 2018 but still the
ratio was significantly higher than debt to equity ratio of Keells foods. The same is case with
debt ratio. This shows that Cargills has taken way more financial leverage as compared to
Keels and it can face solvency problems in bad times. The interest coverage ratio tells the
firm’s ability to service its interest costs using its operational income. This ratio has remained
around 4 to 5 for Cargills in last few years which show that the firm should not have
difficulty paying financing costs from its operational activities. For, Keels this ratio was
further higher.
Asset
utilisation Cargills Keells Foods
2018 2017 2016 2015 2014 2018 2017 2016 2015 2014
Total Asset
Turnover = Net
Revenues/
1.79 1.84 1.78 1.61 1.50 1.29 1.26 1.28 1.19 0.99
10
Interest
coverage or
times interest
earned =
Earnings
before interest
and taxes
(EBIT) / Total
interest
4.79 4.53 5.73 1.89 2.09 42.47 30.3
8
31.70 17.25 -0.94
Debt ratio =
Total debt /
Total assets
27.73
%
32.07
%
27.26
%
33.00
%
42.62
%
1.38
%
3.48
%
5.55
%
7.93
%
11.21
%
Gearing ratios tell about the financial health of the company. It measures the financial
leverage of the firm that is how much debt it has on its balance sheet. Debt to equity ratio
tells about the capital structure of the firm that how much debt a company has in proportion
to its equity. For Cargills, this ratio decreased from 1.1 in 2017 to 0.87 in 2018 but still the
ratio was significantly higher than debt to equity ratio of Keells foods. The same is case with
debt ratio. This shows that Cargills has taken way more financial leverage as compared to
Keels and it can face solvency problems in bad times. The interest coverage ratio tells the
firm’s ability to service its interest costs using its operational income. This ratio has remained
around 4 to 5 for Cargills in last few years which show that the firm should not have
difficulty paying financing costs from its operational activities. For, Keels this ratio was
further higher.
Asset
utilisation Cargills Keells Foods
2018 2017 2016 2015 2014 2018 2017 2016 2015 2014
Total Asset
Turnover = Net
Revenues/
1.79 1.84 1.78 1.61 1.50 1.29 1.26 1.28 1.19 0.99
10
Financial Analysis of Cargills
Average Total
assets
Asset utilisation ratio like total asset turnover tells how efficiently a firm is using its assets to
generate overall sales. This ratio for Cargills has remained close to 1.8 and for Keells it has
remained close to 1.25. This shows that both the companies have been using its assets in a
good manner to produce high revenues but the continuous investment in operation by Cargills
has made its business more efficient.
11
⊘ This is a preview!⊘
Do you want full access?
Subscribe today to unlock all pages.
Trusted by 1+ million students worldwide
1 out of 17
Related Documents


Your All-in-One AI-Powered Toolkit for Academic Success.
+13062052269
info@desklib.com
Available 24*7 on WhatsApp / Email
![[object Object]](/_next/static/media/star-bottom.7253800d.svg)
Unlock your academic potential
Copyright © 2020–2026 A2Z Services. All Rights Reserved. Developed and managed by ZUCOL.