Financial Analysis of Domino's and RFG: Dollars and Sense Case Study 1
VerifiedAdded on 2022/11/14
|9
|1111
|321
Case Study
AI Summary
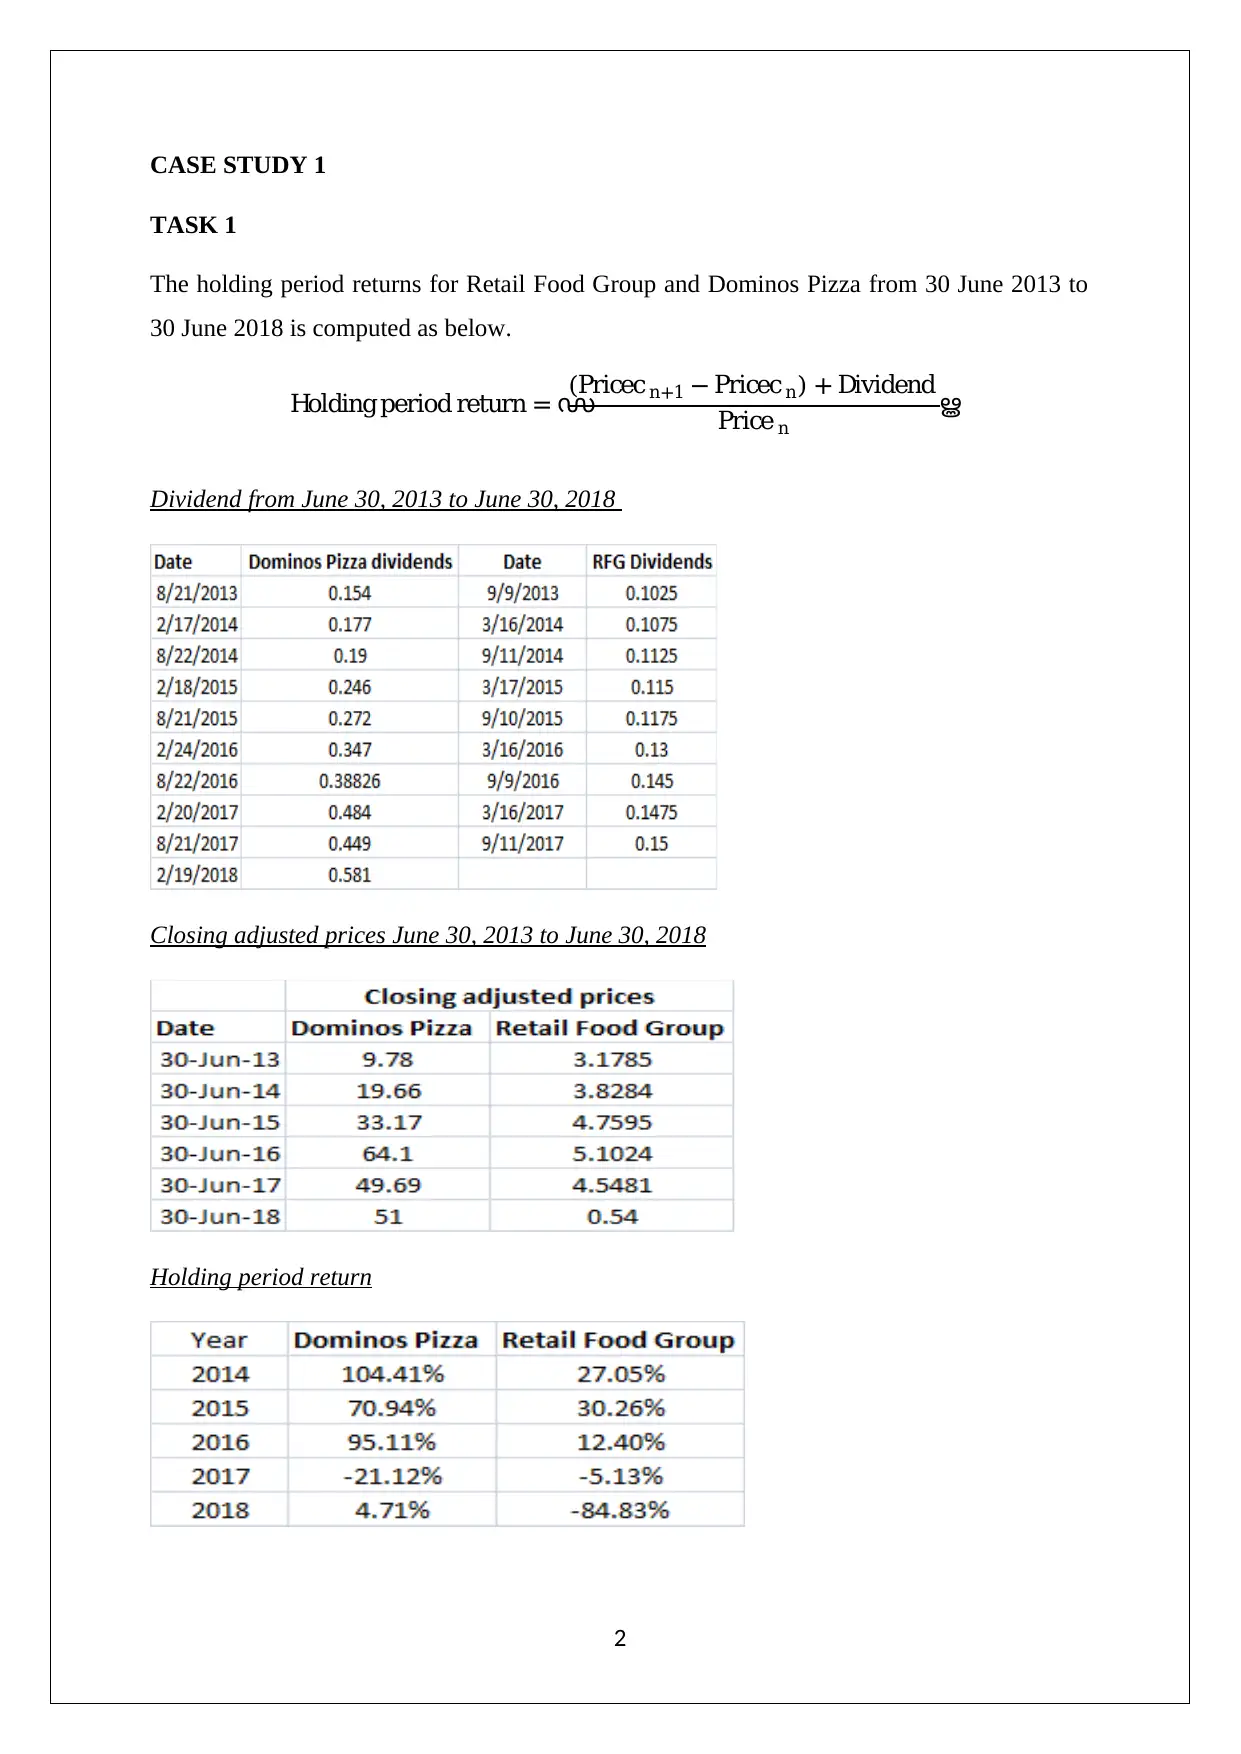
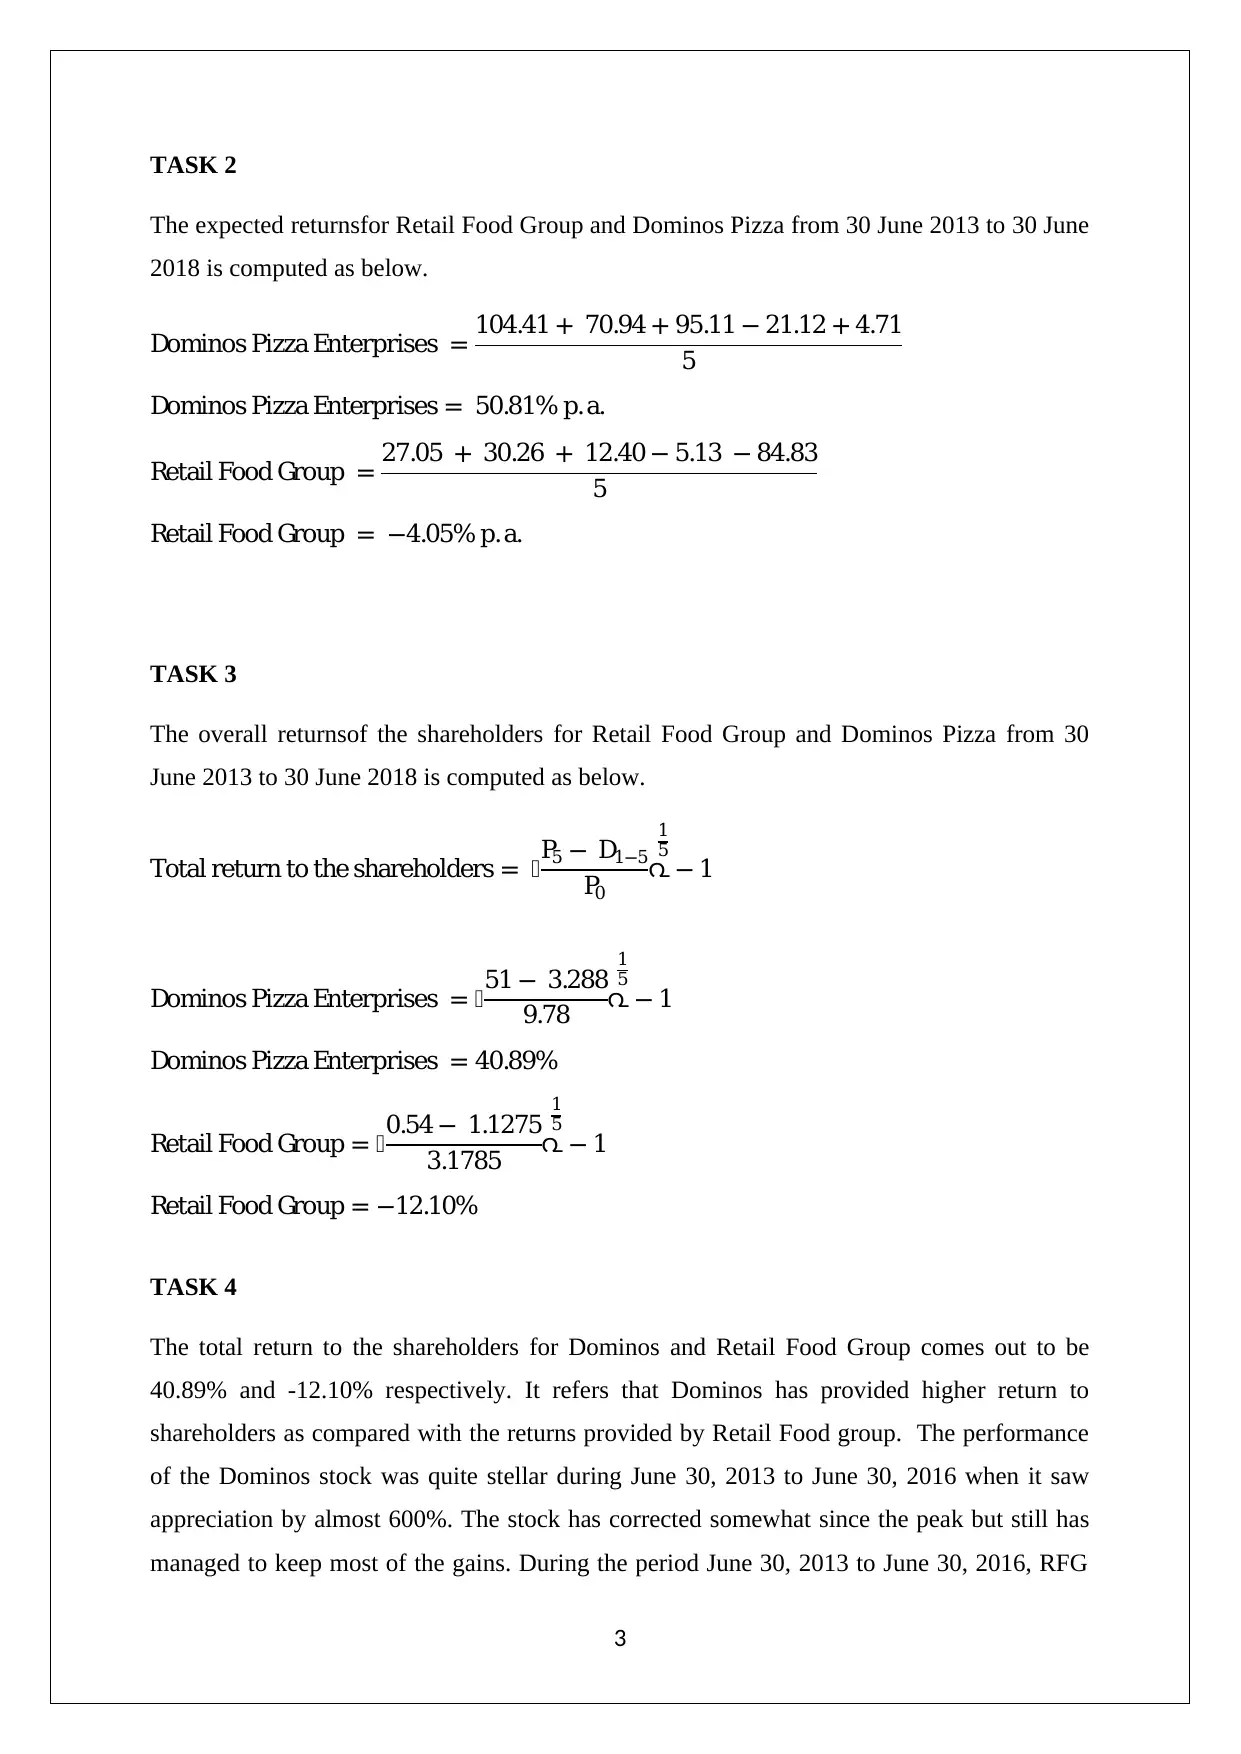
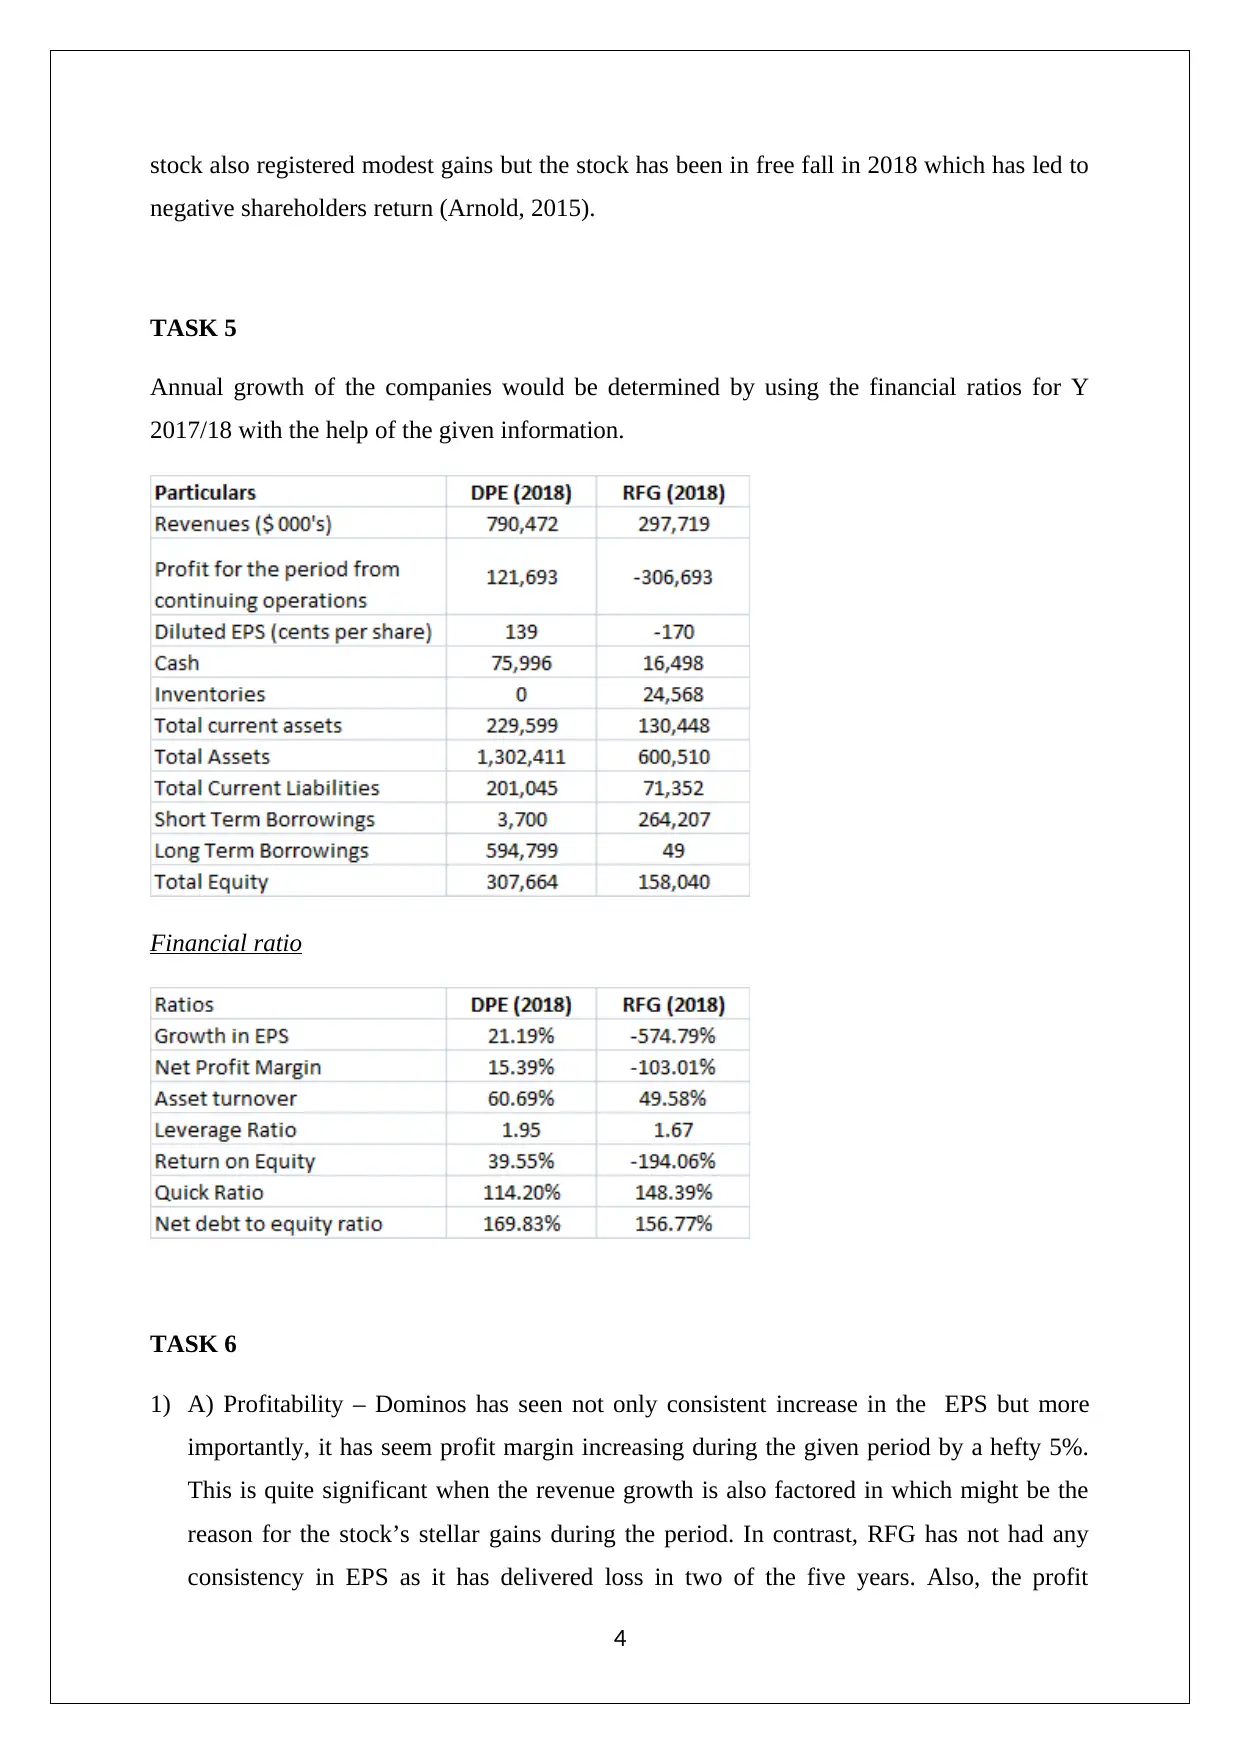
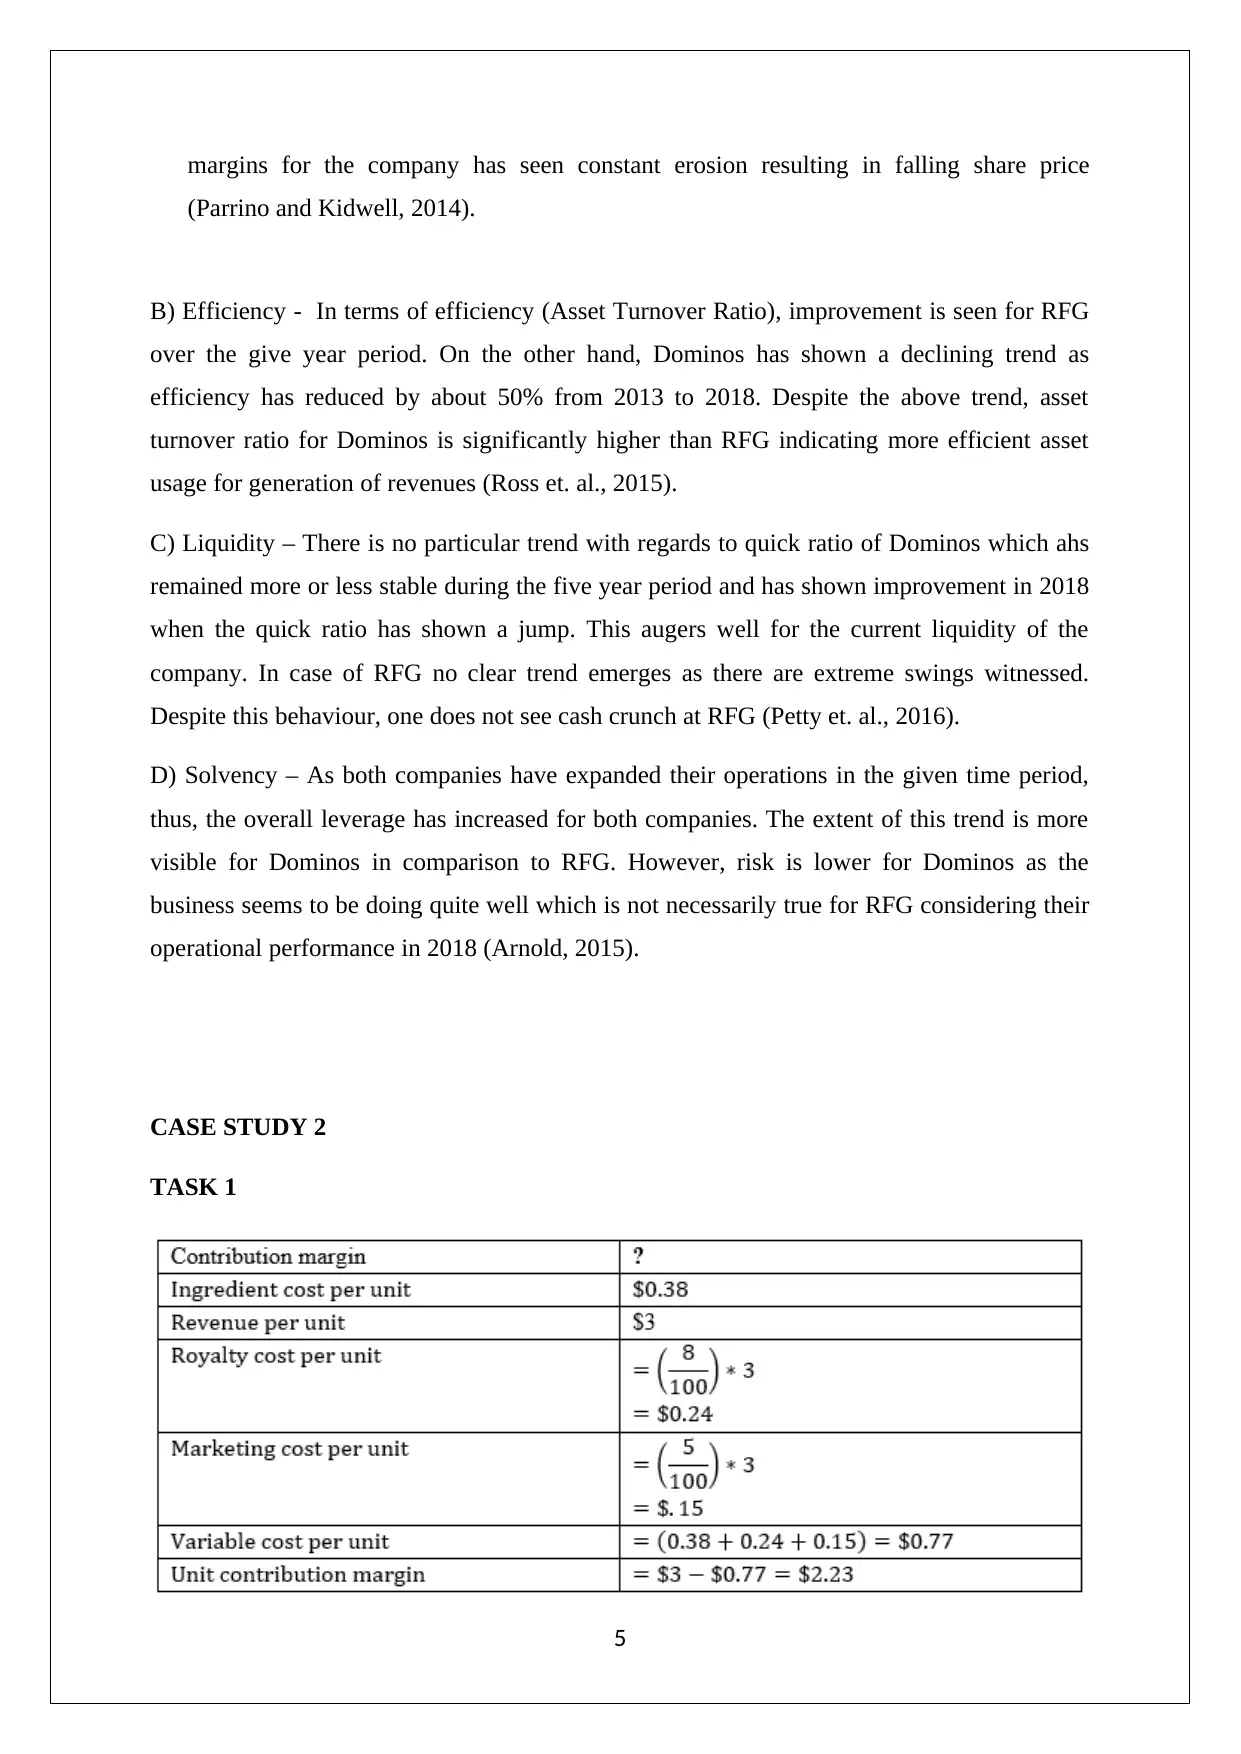
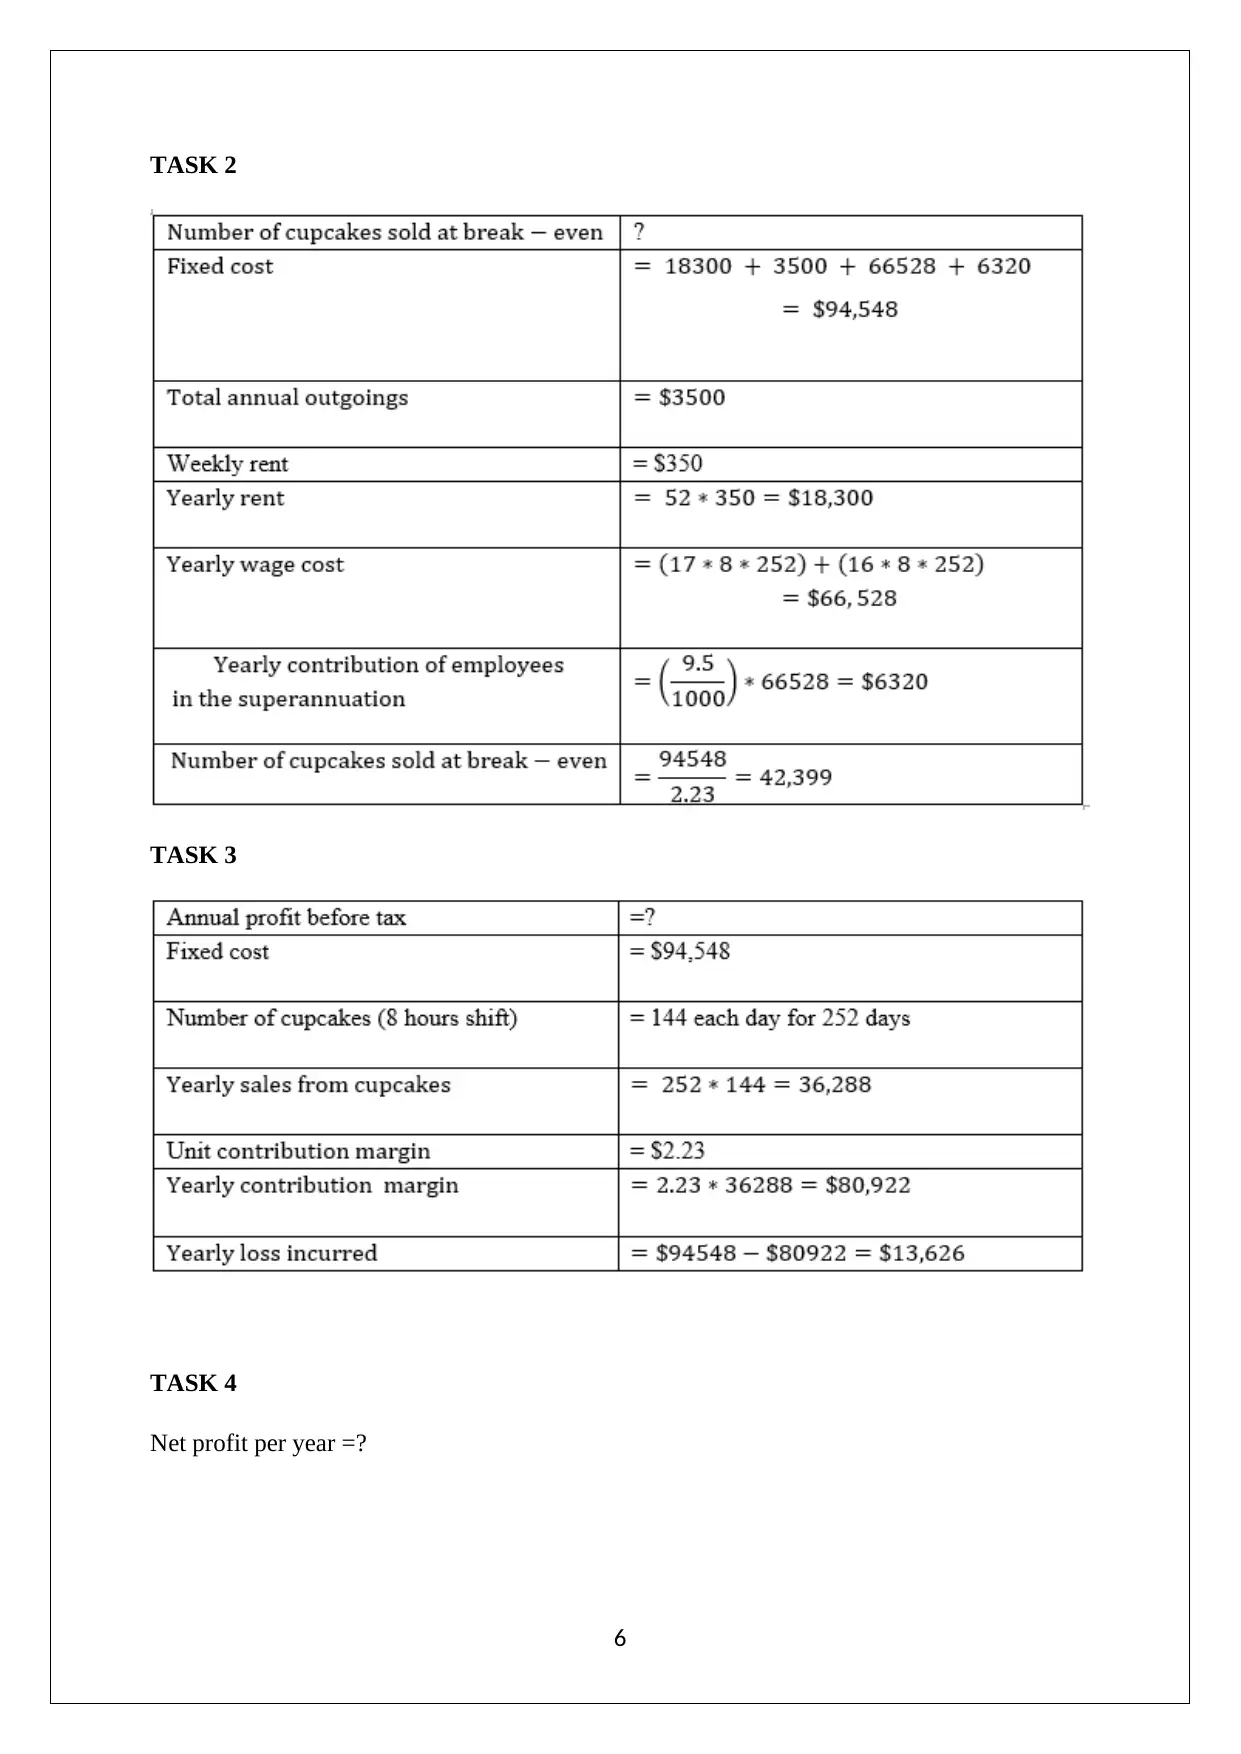
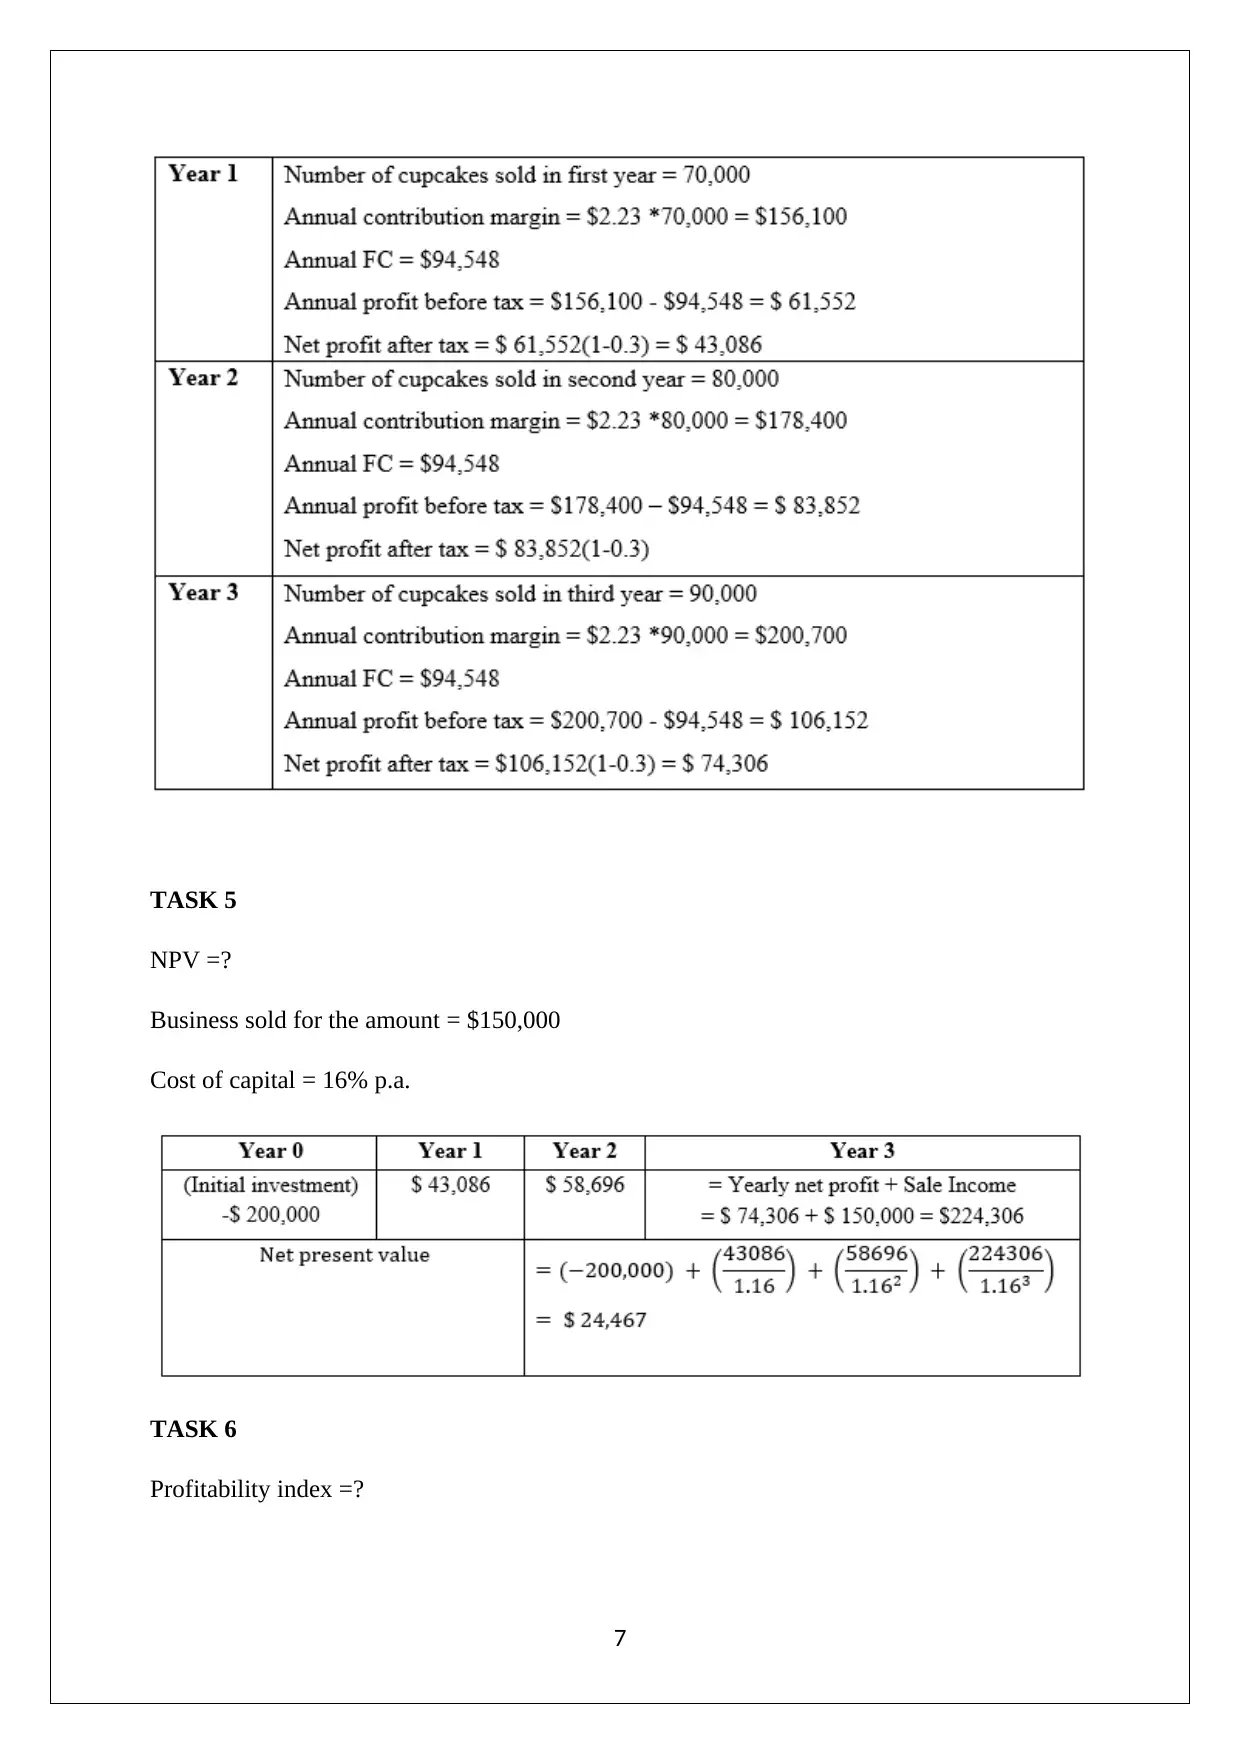
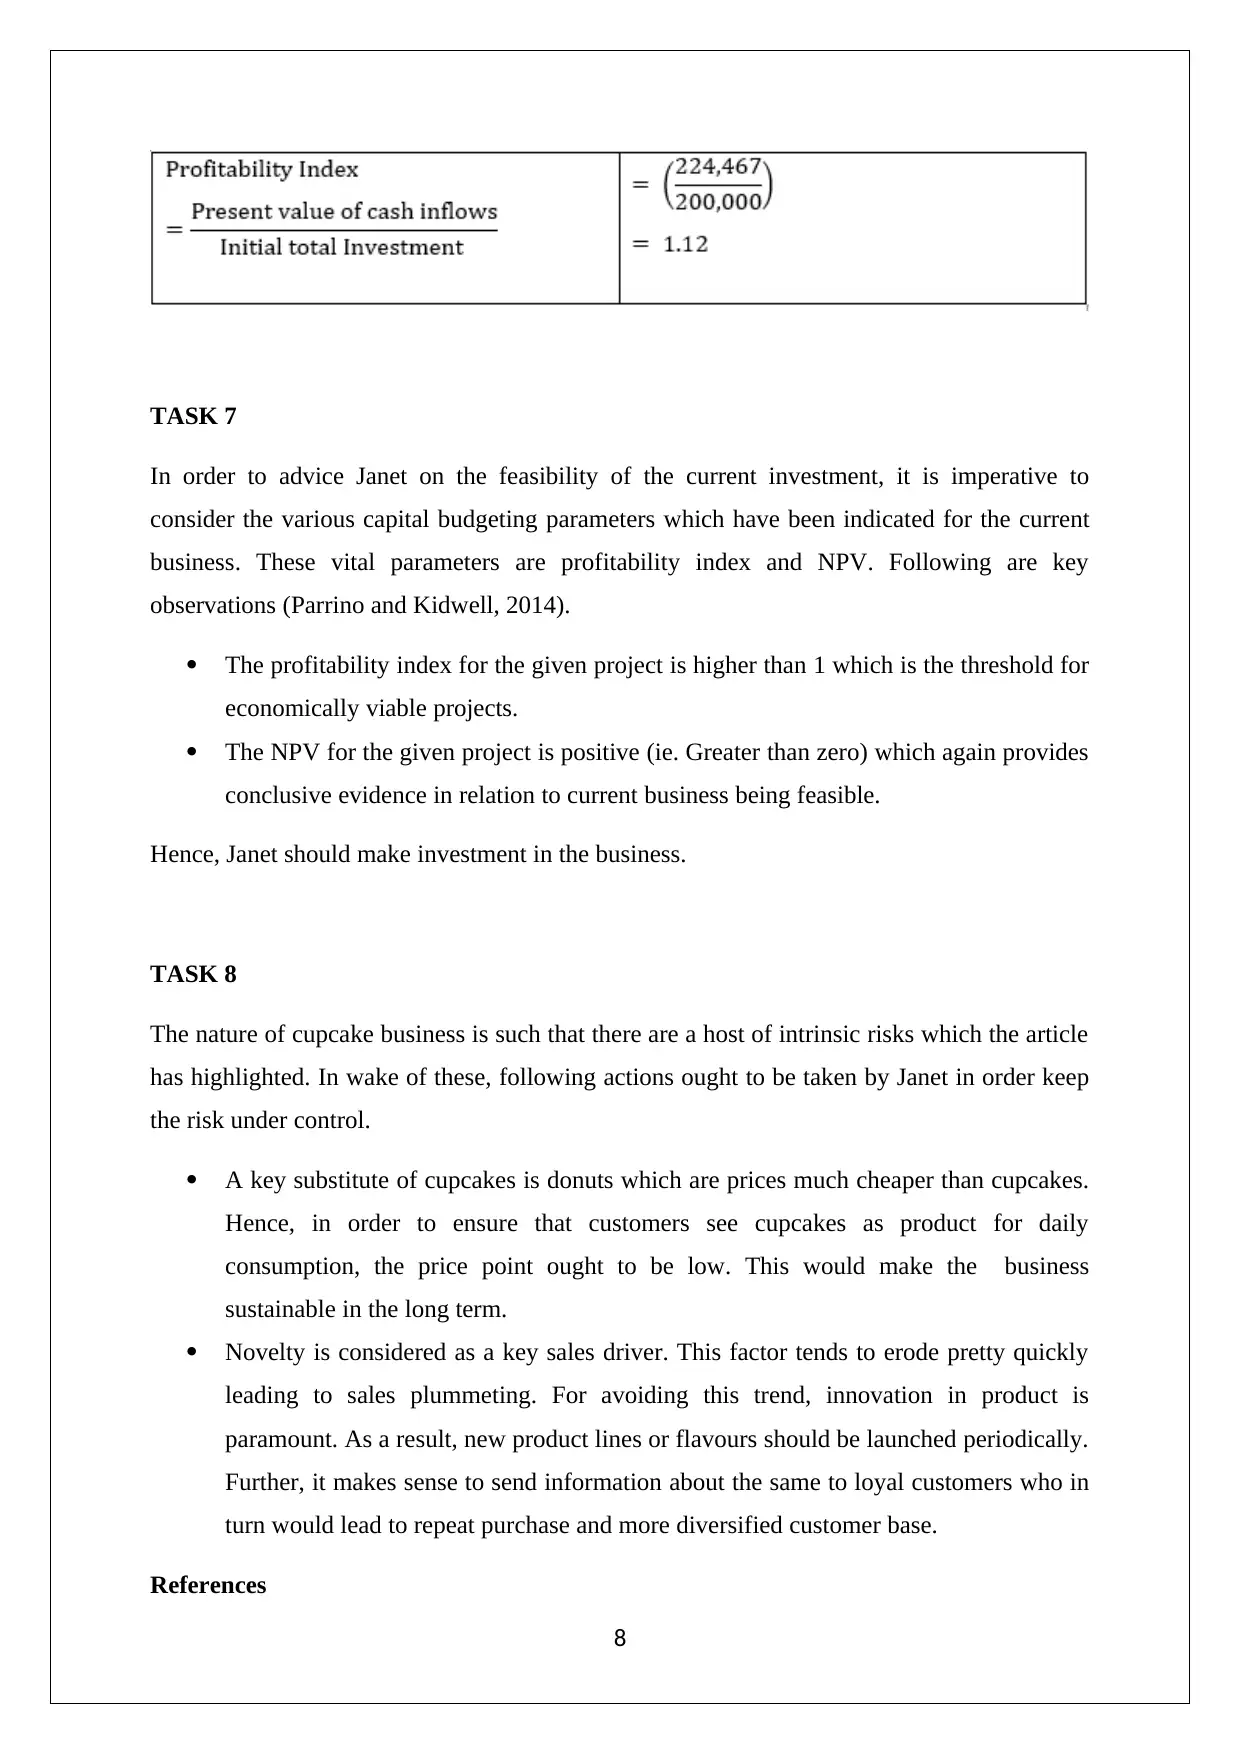
This case study analyzes the financial performance of Retail Food Group (RFG) and Domino's Pizza from June 30, 2013, to June 30, 2018. It begins by calculating holding period returns and expected returns for both companies, followed by an analysis of shareholder returns. The study then delves into financial ratios, including profitability, efficiency, liquidity, and solvency, to determine the annual growth of the companies using 2017/18 financial data. Case Study 2 focuses on capital budgeting, specifically profitability index and NPV calculations, to advise on an investment decision related to a cupcake business. The study concludes with recommendations for managing risks in the cupcake business, such as price adjustments and product innovation.

DOLLARS AND SENSE
STUDENT ID:
[Pick the date]
STUDENT ID:
[Pick the date]
Paraphrase This Document
Need a fresh take? Get an instant paraphrase of this document with our AI Paraphraser

CASE STUDY 1
TASK 1
The holding period returns for Retail Food Group and Dominos Pizza from 30 June 2013 to
30 June 2018 is computed as below.
Holding period return = ൜
(Pricec n+1 − Pricec n) + Dividend
Price n
ൠ
Dividend from June 30, 2013 to June 30, 2018
Closing adjusted prices June 30, 2013 to June 30, 2018
Holding period return
2

TASK 2
The expected returnsfor Retail Food Group and Dominos Pizza from 30 June 2013 to 30 June
2018 is computed as below.
Dominos Pizza Enterprises = 104.41 + 70.94 + 95.11 − 21.12 + 4.71
5
Dominos Pizza Enterprises = 50.81% p.a.
Retail Food Group = 27.05 + 30.26 + 12.40 − 5.13 − 84.83
5
Retail Food Group = −4.05% p.a.
TASK 3
The overall returnsof the shareholders for Retail Food Group and Dominos Pizza from 30
June 2013 to 30 June 2018 is computed as below.
Total return to the shareholders = P5 − D1−5
P0
൨
1
5
− 1
Dominos Pizza Enterprises = 51 − 3.288
9.78 ൨
1
5
− 1
Dominos Pizza Enterprises = 40.89%
Retail Food Group = 0.54 − 1.1275
3.1785 ൨
1
5
− 1
Retail Food Group = −12.10%
TASK 4
The total return to the shareholders for Dominos and Retail Food Group comes out to be
40.89% and -12.10% respectively. It refers that Dominos has provided higher return to
shareholders as compared with the returns provided by Retail Food group. The performance
of the Dominos stock was quite stellar during June 30, 2013 to June 30, 2016 when it saw
appreciation by almost 600%. The stock has corrected somewhat since the peak but still has
managed to keep most of the gains. During the period June 30, 2013 to June 30, 2016, RFG
3
⊘ This is a preview!⊘
Do you want full access?
Subscribe today to unlock all pages.

Trusted by 1+ million students worldwide

stock also registered modest gains but the stock has been in free fall in 2018 which has led to
negative shareholders return (Arnold, 2015).
TASK 5
Annual growth of the companies would be determined by using the financial ratios for Y
2017/18 with the help of the given information.
Financial ratio
TASK 6
1) A) Profitability – Dominos has seen not only consistent increase in the EPS but more
importantly, it has seem profit margin increasing during the given period by a hefty 5%.
This is quite significant when the revenue growth is also factored in which might be the
reason for the stock’s stellar gains during the period. In contrast, RFG has not had any
consistency in EPS as it has delivered loss in two of the five years. Also, the profit
4
Paraphrase This Document
Need a fresh take? Get an instant paraphrase of this document with our AI Paraphraser

margins for the company has seen constant erosion resulting in falling share price
(Parrino and Kidwell, 2014).
B) Efficiency - In terms of efficiency (Asset Turnover Ratio), improvement is seen for RFG
over the give year period. On the other hand, Dominos has shown a declining trend as
efficiency has reduced by about 50% from 2013 to 2018. Despite the above trend, asset
turnover ratio for Dominos is significantly higher than RFG indicating more efficient asset
usage for generation of revenues (Ross et. al., 2015).
C) Liquidity – There is no particular trend with regards to quick ratio of Dominos which ahs
remained more or less stable during the five year period and has shown improvement in 2018
when the quick ratio has shown a jump. This augers well for the current liquidity of the
company. In case of RFG no clear trend emerges as there are extreme swings witnessed.
Despite this behaviour, one does not see cash crunch at RFG (Petty et. al., 2016).
D) Solvency – As both companies have expanded their operations in the given time period,
thus, the overall leverage has increased for both companies. The extent of this trend is more
visible for Dominos in comparison to RFG. However, risk is lower for Dominos as the
business seems to be doing quite well which is not necessarily true for RFG considering their
operational performance in 2018 (Arnold, 2015).
CASE STUDY 2
TASK 1
5

TASK 2
TASK 3
TASK 4
Net profit per year =?
6
TASK 3
TASK 4
Net profit per year =?
6
⊘ This is a preview!⊘
Do you want full access?
Subscribe today to unlock all pages.

Trusted by 1+ million students worldwide

TASK 5
NPV =?
Business sold for the amount = $150,000
Cost of capital = 16% p.a.
TASK 6
Profitability index =?
7
NPV =?
Business sold for the amount = $150,000
Cost of capital = 16% p.a.
TASK 6
Profitability index =?
7
Paraphrase This Document
Need a fresh take? Get an instant paraphrase of this document with our AI Paraphraser

TASK 7
In order to advice Janet on the feasibility of the current investment, it is imperative to
consider the various capital budgeting parameters which have been indicated for the current
business. These vital parameters are profitability index and NPV. Following are key
observations (Parrino and Kidwell, 2014).
The profitability index for the given project is higher than 1 which is the threshold for
economically viable projects.
The NPV for the given project is positive (ie. Greater than zero) which again provides
conclusive evidence in relation to current business being feasible.
Hence, Janet should make investment in the business.
TASK 8
The nature of cupcake business is such that there are a host of intrinsic risks which the article
has highlighted. In wake of these, following actions ought to be taken by Janet in order keep
the risk under control.
A key substitute of cupcakes is donuts which are prices much cheaper than cupcakes.
Hence, in order to ensure that customers see cupcakes as product for daily
consumption, the price point ought to be low. This would make the business
sustainable in the long term.
Novelty is considered as a key sales driver. This factor tends to erode pretty quickly
leading to sales plummeting. For avoiding this trend, innovation in product is
paramount. As a result, new product lines or flavours should be launched periodically.
Further, it makes sense to send information about the same to loyal customers who in
turn would lead to repeat purchase and more diversified customer base.
References
8

Arnold, G. (2015) Corporate Financial Management. 3rd ed. Sydney: Financial Times
Management, pp. 165-166
Ross,S.A., Tryaler,R., Bird, R.,Westerfield, R.W. and Jorden,B.D. (2015) Essentials of
Corporate Finance. 2nd ed. New York City: McGraw-Hill, pp. 178
Parrino, R. and Kidwell, D. (2014) Fundamentals of Corporate Finance, 3rd ed. London:
Wiley Publications, pp. 145-146
Petty, J.W., Titman, S., Keown, A., Martin, J.D., Martin, P., Burrow, M., and Nguyen, H. (2016)
Financial Management, Principles and Applications. 6th ed. NSW: Pearson Education, French
Forest Australia, pp. 201-202
9
⊘ This is a preview!⊘
Do you want full access?
Subscribe today to unlock all pages.

Trusted by 1+ million students worldwide
1 out of 9
Related Documents

Your All-in-One AI-Powered Toolkit for Academic Success.
+13062052269
info@desklib.com
Available 24*7 on WhatsApp / Email
Unlock your academic potential
Copyright © 2020–2025 A2Z Services. All Rights Reserved. Developed and managed by ZUCOL.