Financial Analysis Case Study: Domino's Pizza Enterprise Ltd

Verified

Added on  2021/01/01

|7
|1293
|465
Case Study
AI Summary
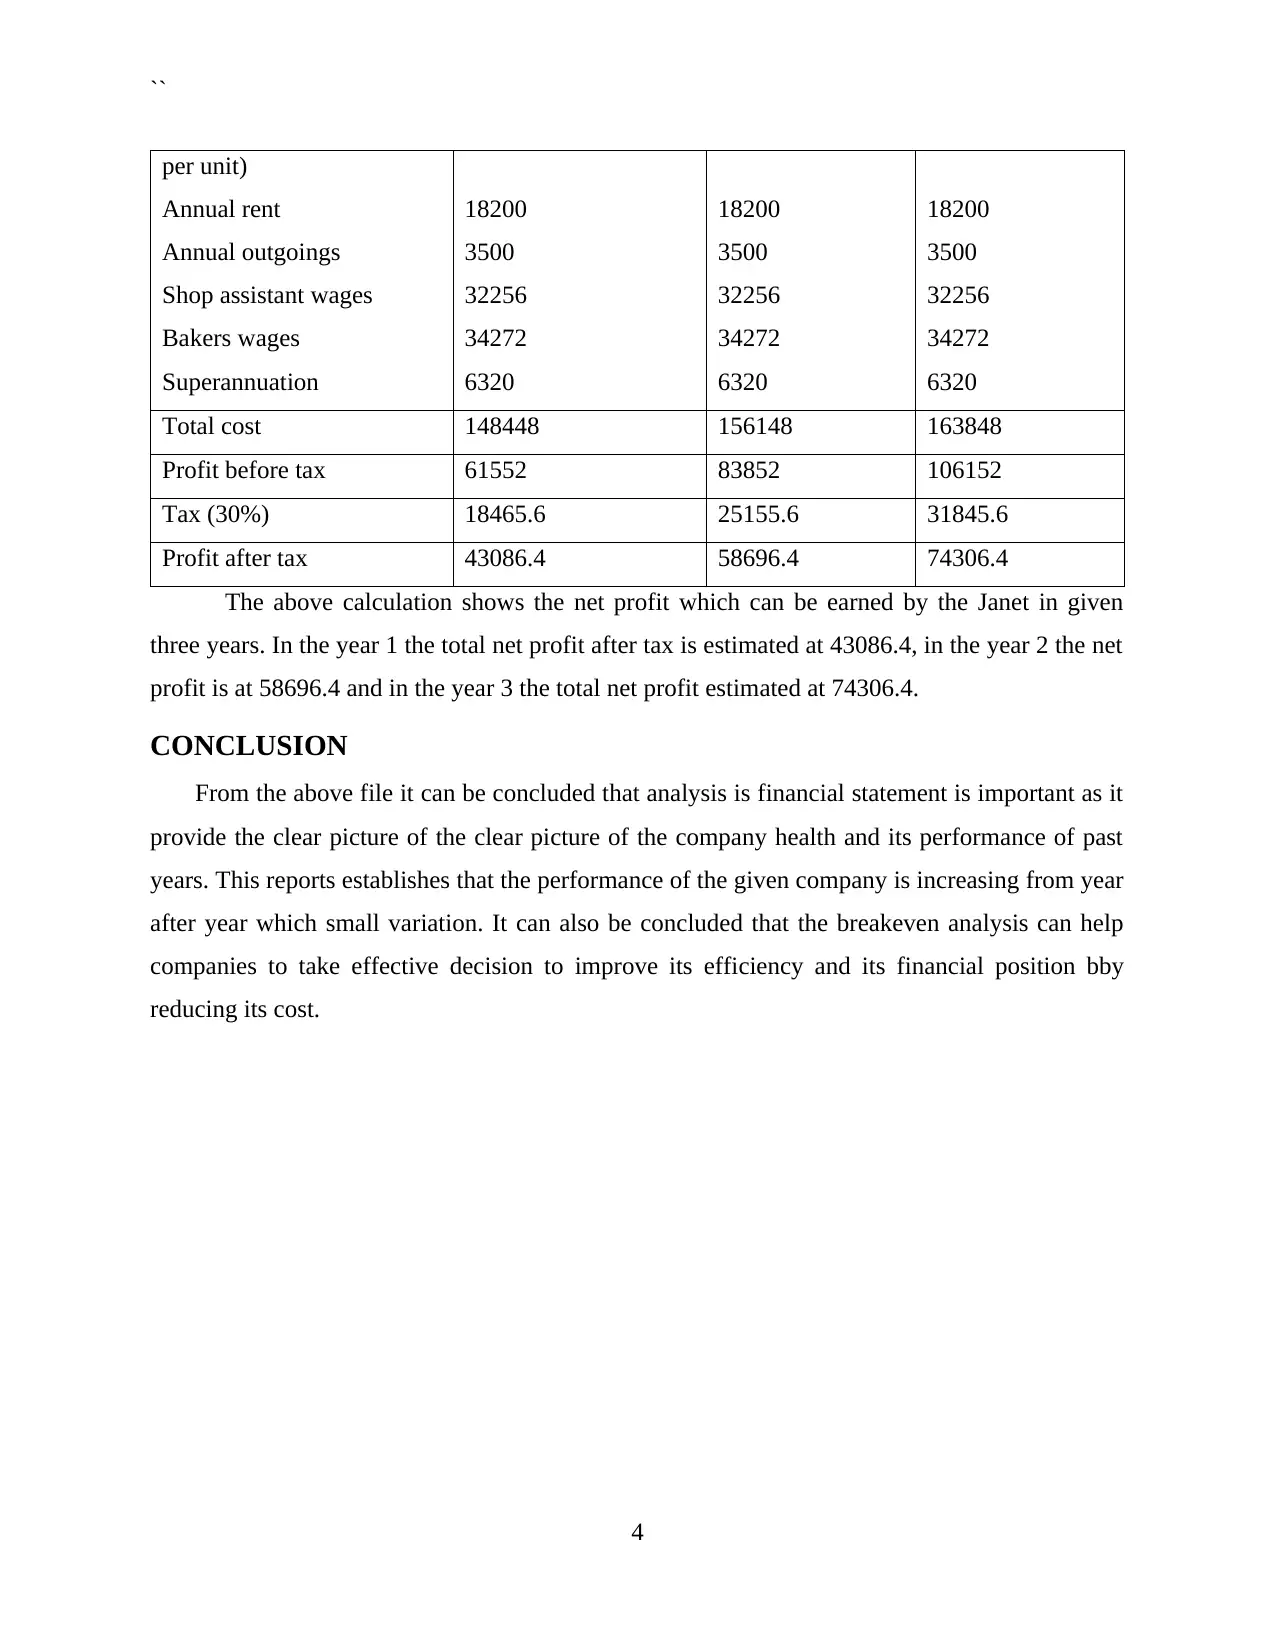
This case study presents a financial analysis of two distinct business scenarios. The first part analyzes the financial performance of Domino's Pizza Enterprise Ltd, calculating holding period return, expected return, and total return to shareholders from 2014 to 2018, along with share price trends. The second part focuses on a new cupcake franchise, performing a contribution margin analysis, break-even point calculation, and projections for annual and net profits over three years. The analysis uses relevant formulas and data to evaluate the financial health and performance of the businesses, providing insights into their profitability and sustainability. The study concludes with a summary of the importance of financial statement analysis in understanding a company's performance and making informed decisions.
tabler-icon-diamond-filled.svg

Contribute Materials

Your contribution can guide someone’s learning journey. Share your documents today.
Document Page
``
CASE STUDY
tabler-icon-diamond-filled.svg

Secure Best Marks with AI Grader

Need help grading? Try our AI Grader for instant feedback on your assignments.
Document Page
``
Contents
INTRODUCTION...........................................................................................................................1
CASE 1............................................................................................................................................1
Calculation of holding period return......................................................................................1
Estimation of Expected return................................................................................................1
Calculation of total return to shareholders.............................................................................1
The performance of the company on the basis of share price................................................2
CASE 2............................................................................................................................................2
Contribution margin...............................................................................................................2
Calculation of break even.......................................................................................................2
Calculation of annual profit....................................................................................................3
Calculation of net profit for the year......................................................................................3
CONCLUSION................................................................................................................................4
REFERENCES................................................................................................................................5
Document Page
``
INTRODUCTION
Financial analysis is a process in which a managers evaluate business, budgets, projects and the
other entities which are related to finance (Sheikhi, Ranjbar and Oraee, 2012). It helps managers
to analyse that whether an entity is solvent, stable, profitable or liquid. The following report
consists of two case studies, case one contains the calculation of holding period return, expected
return, total return to the shareholders. It also contains the comparison of company’s past
performance in case one example of Domino’s pizza enterprise Ltd is used. In case two example
of a new cupcakes franchise business is taken. This report also contains the explanation of
various topics.
CASE 1
Calculation of holding period return
Holding period of return: Holding period of return is the return which is received by a
company from holding a particular asset over a period of time. It can be calculated for by using
the following formula:
Growth in earning per share states the holding period of return for Dominos Pizza
Enterprise Ltd. In the year 2014 it was stated at 129% which means the share holders are getting
a positive return on their investment. In the year 2015 it is stated as 146% in year 2016 it was at
127%, later in the year 2017 it fell down to 124% and in the year 2018 it was stated at 128%
which means that the company is providing good returns to its shareholders.
Estimation of Expected return
From the above historic return it can be estimated that the company will be performing
better in the near future as per the historic return the shareholders are generating a high return
from the company (Bragg, 2012 ). It can also be stated that company can improve its operation in
order to reduce its cost and increase its profit margin and provide better return in the future.
Calculation of total return to shareholders
Total return to shareholders: Total return to shareholders is a measure which is used by
managers to measure the performance of the stocks of various companies over a given period off
time.
1
Document Page
``
Total return to shareholders of Dominos Pizza Enterprise Ltd is as follows:
Total return which shareholder generated in the year 2018 is states at 28%, in the year
2017 it is 24% in the year 2016 it was shown at 27% whereas in the year 2015 it showed a
increase up to 46% and in the year 2014 it was stated at 29%
The performance of the company on the basis of share price
For the year 2014 the share price of domino’s pizza enterprise Ltd was recorded as $21.2
in the year 2015 it raised up to $35.69 in the year 2016 it was recorded at $68.3 after than in the
year 2017 it fell down to $52.08 whereas in the year 2018 it was recorded at $52.2 the above data
showed an increasing trend in the performance of the company an it can be analysed that the
growth of the company will continue to rise.
CASE 2
Contribution margin
It is stated on a basis of per unit or a gross which represents the incremental generated
funds for each number of product or unit sold in the market (El Kasmioui and Ceulemans, 2012).
It is calculated after subtracting the variable prices from the total selling price it helps cost
accountant to measure the contribution per unit of a particular product in total profit earned by aa
company. It can be calculated by using the following formula:
Calculation of break even
Break even point: Break even point is point at which a company does not earn any profit
nor incur any losses (Cucchiella and Rosa, 2015). The number of cupcakes sold by a company is
as follows:
Less: Royalty (8%)
Marketing cost (5%)
Cost of ingredients (0.38)
Annual rent
Annual outgoings
16800
10500
26600
18200
3500
2
tabler-icon-diamond-filled.svg

Secure Best Marks with AI Grader

Need help grading? Try our AI Grader for instant feedback on your assignments.
Document Page
``
Shop assistant wages
Bakers wages
Superannuation
32256
34272
6320
Total cost 148448
Break even unit 148448 / 3
49483
In order to achieve its break even Janet Fleming has to sell approx. 49483 units of
cupcakes.
Calculation of annual profit
Sales 210000
Less: Royalty (8%)
Marketing cost (5%)
Cost of ingredients (0.38 per unit)
Annual rent
Annual outgoings
Shop assistant wages
Bakers wages
Superannuation
16800
10500
26600
18200
3500
32256
34272
6320
Total cost 148448
Profit before tax 61552
If Janet sells all the cupcakes produced in one year it can earn a profit before tax up to
61552. The above calculation shows the various cost which is associated to the calculation of
profit earned in the first year by Janet.
Calculation of net profit for the year
Year 1 (70000) Year 2 (80000) Year 3 (90000)
Sales (3 per unit) 210000 240000 270000
Less: Royalty (8%)
Marketing cost (5%)
Cost of ingredients (0.38
16800
10500
26600
19200
12000
30400
21600
13500
34200
3
Document Page
``
per unit)
Annual rent
Annual outgoings
Shop assistant wages
Bakers wages
Superannuation
18200
3500
32256
34272
6320
18200
3500
32256
34272
6320
18200
3500
32256
34272
6320
Total cost 148448 156148 163848
Profit before tax 61552 83852 106152
Tax (30%) 18465.6 25155.6 31845.6
Profit after tax 43086.4 58696.4 74306.4
The above calculation shows the net profit which can be earned by the Janet in given
three years. In the year 1 the total net profit after tax is estimated at 43086.4, in the year 2 the net
profit is at 58696.4 and in the year 3 the total net profit estimated at 74306.4.
CONCLUSION
From the above file it can be concluded that analysis is financial statement is important as it
provide the clear picture of the clear picture of the company health and its performance of past
years. This reports establishes that the performance of the given company is increasing from year
after year which small variation. It can also be concluded that the breakeven analysis can help
companies to take effective decision to improve its efficiency and its financial position bby
reducing its cost.
4
Document Page
``
REFERENCES
Books and Journals
Sheikhi, A., Ranjbar, A. M. and Oraee, H., 2012. Financial analysis and optimal size and
operation for a multicarrier energy system. Energy and buildings. 48. pp.71-78.
Bragg, S. M., 2012. Financial analysis: a controller's guide. John Wiley & Sons.
El Kasmioui, O. and Ceulemans, R., 2012. Financial analysis of the cultivation of poplar and
willow for bioenergy. Biomass and bioenergy. 43. pp.52-64.
Cucchiella, F. and Rosa, P., 2015. End-of-Life of used photovoltaic modules: A financial
analysis. Renewable and Sustainable Energy Reviews. 47. pp.552-561.
5
chevron_up_icon
1 out of 7
circle_padding
hide_on_mobile
zoom_out_icon
logo.png

Your All-in-One AI-Powered Toolkit for Academic Success.

Available 24*7 on WhatsApp / Email

[object Object]