BUSM4741 Financial Analytics: Cash Converters Financial Report
VerifiedAdded on 2023/06/10
|10
|2644
|375
Report
AI Summary
This report provides a comprehensive financial analysis of Cash Converter International Limited, utilizing various financial techniques to assess the company's performance and inform managerial decisions. The analysis includes the computation and interpretation of five key financial ratios (solvency, profitability, liquidity, turnover, and earnings) over a three-year period (2019-2021), a DuPont analysis to break down the components of return on equity, and an evaluation of the company's profitability using graphs. The report identifies strengths and weaknesses in the business based on the financial data, and proposes suitable business strategies such as structuralist, growth, market expansion, product differentiation, and price skimming to enhance future performance and profitability. The conclusion summarizes the findings, highlighting the company's financial position and the implications of the analysis for strategic decision-making.
BUSM4741 Financial
Analytics for
Managerial Decisions
Analytics for
Managerial Decisions
Paraphrase This Document
Need a fresh take? Get an instant paraphrase of this document with our AI Paraphraser
Contents
INTRODUCTION...........................................................................................................................3
Main Body.......................................................................................................................................3
Computation of Five key categories of financial Ratios of company Cash Converter
International Limited over 3 years...............................................................................................3
Conduct the DuPont analysis.......................................................................................................5
Evaluating profitability of the company with the help of graphs................................................6
Discussing suitable business strategies and its use in future purpose.........................................7
CONCLUSION................................................................................................................................8
REFERENCES................................................................................................................................9
Appendix........................................................................................................................................10
INTRODUCTION
In the below report, financial analytics for managerial decision are explained with the
help of some financial techniques. Financial reporting is the tool which helps the organization to
meet the needs of outsider users of accounting information (Chen and et.al., 2018). These users
are works in the firm for analysing the financial position of the company by different types of
analytics methods. The following report describe how does financial analysis help in decision
making. It further include the key categories of financial ratio, Du point analysis, business
segment, major business profitability segments along with graph and strategic business planning.
In which financial ratio contain 5 different ratio over 3 year of the company. Financial ratio is the
key element of every business organization, investors and shareholders to know about where the
business are stand and what types of changes are required in the business for generating more
income and cash flows. It also describe the causes and reason behind the ratio result in a given
year.
Main Body
Computation of Five key categories of financial Ratios of company Cash Converter International
Limited over 3 years
Solvency Ratios
Solvency ratios are a critical part of financial analysis that determines whether a firm has enough
cash flow to meet its debt commitments. Leverage ratios and solvency ratios are two terms that
are used interchangeably (Cui and et.al., 2019).
Debt-Equity Ratio: It is a critical metric for determining a company's financial leverage.
This ratio determines if the shareholder's equity has the ability to satisfy all debts in the event of
a business failure.
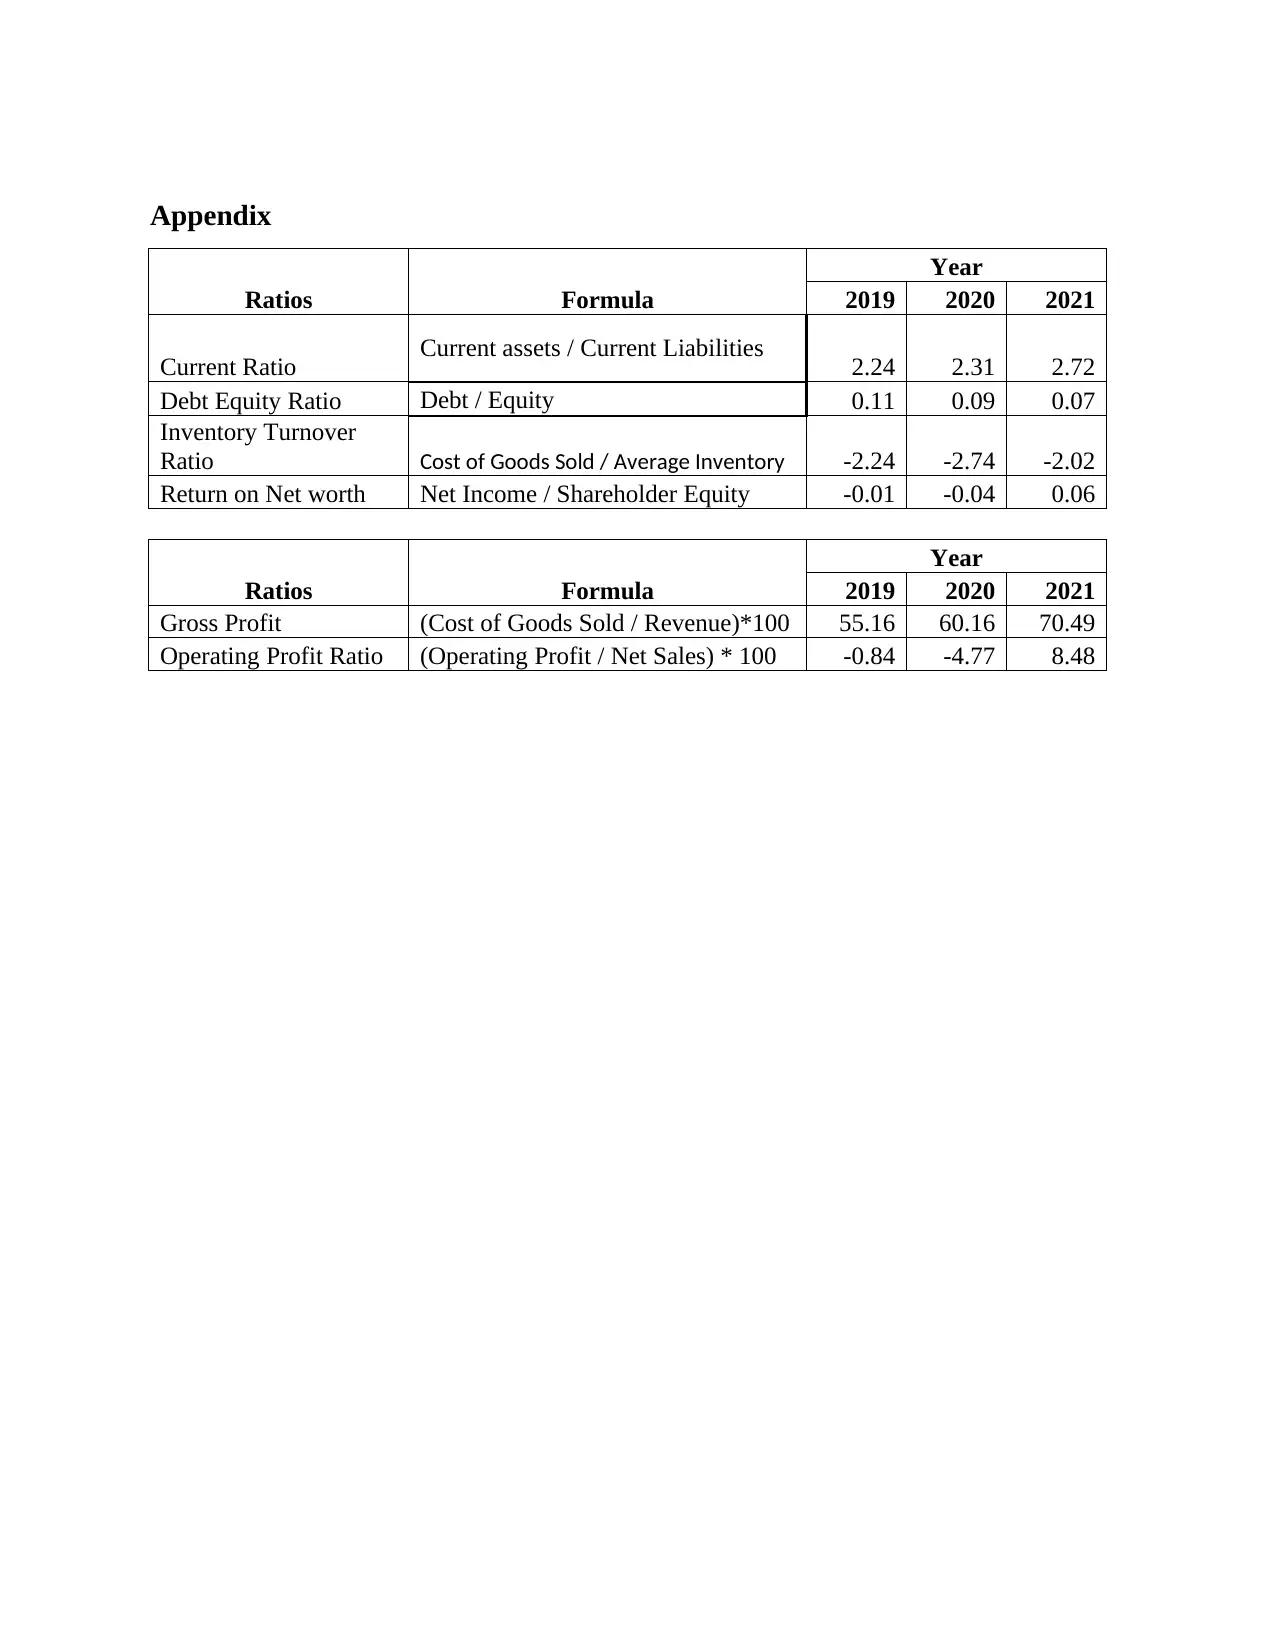
Calculation attached in below appendix
Interpretation and comparison: According to the calculation of ratio, the results shows
that the company debt equity ratio is decreasing continuously from 2019 to 2021 that indicates
the company have high debt then shareholder equity. The company is more depended on the
debts to run the business operations as compare to its equity that means since 2019, business is
not satisfying the needs of the ideal debt equity ratio which is around 2 to 5. It is also says that
business has not dependent on borrowings to finance the business operations.
In the below report, financial analytics for managerial decision are explained with the
help of some financial techniques. Financial reporting is the tool which helps the organization to
meet the needs of outsider users of accounting information (Chen and et.al., 2018). These users
are works in the firm for analysing the financial position of the company by different types of
analytics methods. The following report describe how does financial analysis help in decision
making. It further include the key categories of financial ratio, Du point analysis, business
segment, major business profitability segments along with graph and strategic business planning.
In which financial ratio contain 5 different ratio over 3 year of the company. Financial ratio is the
key element of every business organization, investors and shareholders to know about where the
business are stand and what types of changes are required in the business for generating more
income and cash flows. It also describe the causes and reason behind the ratio result in a given
year.
Main Body
Computation of Five key categories of financial Ratios of company Cash Converter International
Limited over 3 years
Solvency Ratios
Solvency ratios are a critical part of financial analysis that determines whether a firm has enough
cash flow to meet its debt commitments. Leverage ratios and solvency ratios are two terms that
are used interchangeably (Cui and et.al., 2019).
Debt-Equity Ratio: It is a critical metric for determining a company's financial leverage.
This ratio determines if the shareholder's equity has the ability to satisfy all debts in the event of
a business failure.
Calculation attached in below appendix
Interpretation and comparison: According to the calculation of ratio, the results shows
that the company debt equity ratio is decreasing continuously from 2019 to 2021 that indicates
the company have high debt then shareholder equity. The company is more depended on the
debts to run the business operations as compare to its equity that means since 2019, business is
not satisfying the needs of the ideal debt equity ratio which is around 2 to 5. It is also says that
business has not dependent on borrowings to finance the business operations.
⊘ This is a preview!⊘
Do you want full access?
Subscribe today to unlock all pages.
Trusted by 1+ million students worldwide
Profitability Ratios
Profitability ratio is used to determine a company's financial success at the end of a fiscal
year. Profitability ratios indicate how profitable a company's activities are.
Gross Profit Ratio: The gross profit margin is the profit produced before subtracting selling,
operating, and administrative charges, which is the net profit margin of the company (Gan and
et.al., 2020).
Calculation attached in below appendix
Interpretation and comparison: According to the calculation of ratio, it can be says that
company gross profit is much more liable in the year 2021 as compare to both the year because
in 2021 the ratio resulted 8.48 and 2019 and 2020 it valued on -0.84 and -4.77 which indicates
operating expenses of the business is higher relative to the sales or revenue. It is also says that in
year 2019 and 2020 company expenses are decrease, sales is increase or may be both are taken
place at a same time. But in the previous year company are more able to control the management
efficiently by holding the lower costs while generating revenue.
Liquidity Ratios
A liquidity ratio is a financial ratio that is used to assess a company's capacity to meet its
short-term borrowings. The indicator is used to assess if a company's current assets, or liquid
assets, can cover its current obligations.
Current Ratio: The weight of total current assets versus total current liabilities is taken into
account in this ratio. It reveals a company's financial health (Hua and et.al., 2018).
Calculation attached in below appendix
Interpretation and comparison: According to the calculation of ratio value in all these
year 2019, 2020 and 2021 shows company acquiring or keeping more current assets then current
liabilities. The ideal current ratio of the most of companies are 2 : 1 which indicates business
have high liquidity ratio or company are more capable to recover its short obligation at a given
period of time. From 2019 to 20201 the ratio value are gradually increases of the company cash
converter international limited or they are also fulfilling the business current assets needs in all
these year. The resulted value of 2019, 2020 and 2021 are 2.24, 2.31 and 2.72 respectively.
Turnover Ratios
The quantity of assets or liabilities that a firm replaces in relation to its sales is referred to
as a turnover ratio. The concept is important for assessing how well a company uses its assets.
Paraphrase This Document
Need a fresh take? Get an instant paraphrase of this document with our AI Paraphraser
Inventory Turnover Ratio: The inventory turnover ratio is calculated by dividing the cost of
products sold by total or average inventory to determine how many times inventory is sold
during a given period (Huang., 2022).
Calculation attached in below appendix
Interpretation and comparison: According to the calculation of ratio, it is interpreted that
company inventory ratio are decreasing continuously or even minus in all these three years. In
2019, 2020 and 2021 the ratio value are -2.24, -2.74 and -2.02 respectively which indicates the
company are not able to convert its stock into sales. The company is suffering from huge
inventory storage, resulting business facing high storage expenses. Generally the ideal ratio of
the inventory turnover ratio of most of industries are between 5 to 10.
Earnings Ratio
Current and prospective investors who need to evaluate the rate of return on shares and risk
while making an investment to acquire shares are particularly interested in this ratios (Medcalfe
and Miro, 2021).
Return on Net Worth: The net worth ratio expresses the potential return on a company's
investment for its shareholders.
Calculation attached in below appendix
Interpretation and comparison: According to the calculation of ratio, it has been analysis
that the performance of the company has been negative in both the year 2019 and 2020. Further
in 2021 it is significantly low which shows that they are not adequately sufficient enough to
generate profit.
Conduct the DuPont analysis
DuPont Analysis meaning: It is an important tool which is used to measure the financial
performance of the company and also used for comparing the financial information of one
business organization to another one. Dupont analysis is a method utilise to breakdown the
various operators of return on equity(Omondi-Ochieng, 2020). In context of manager Dupont
analysis helps to find out the company strength and weakness that need to be solved. It is
calculated by multiplying the net profit margin, Assets turnover and equity multiplier together
respectively where net profit is derived by dividing net income into sales, Assets turnover is
computed by dividing the sales into average total assets and equity multiplier is figure out by
dividing average total assets into average shareholders’ equity.
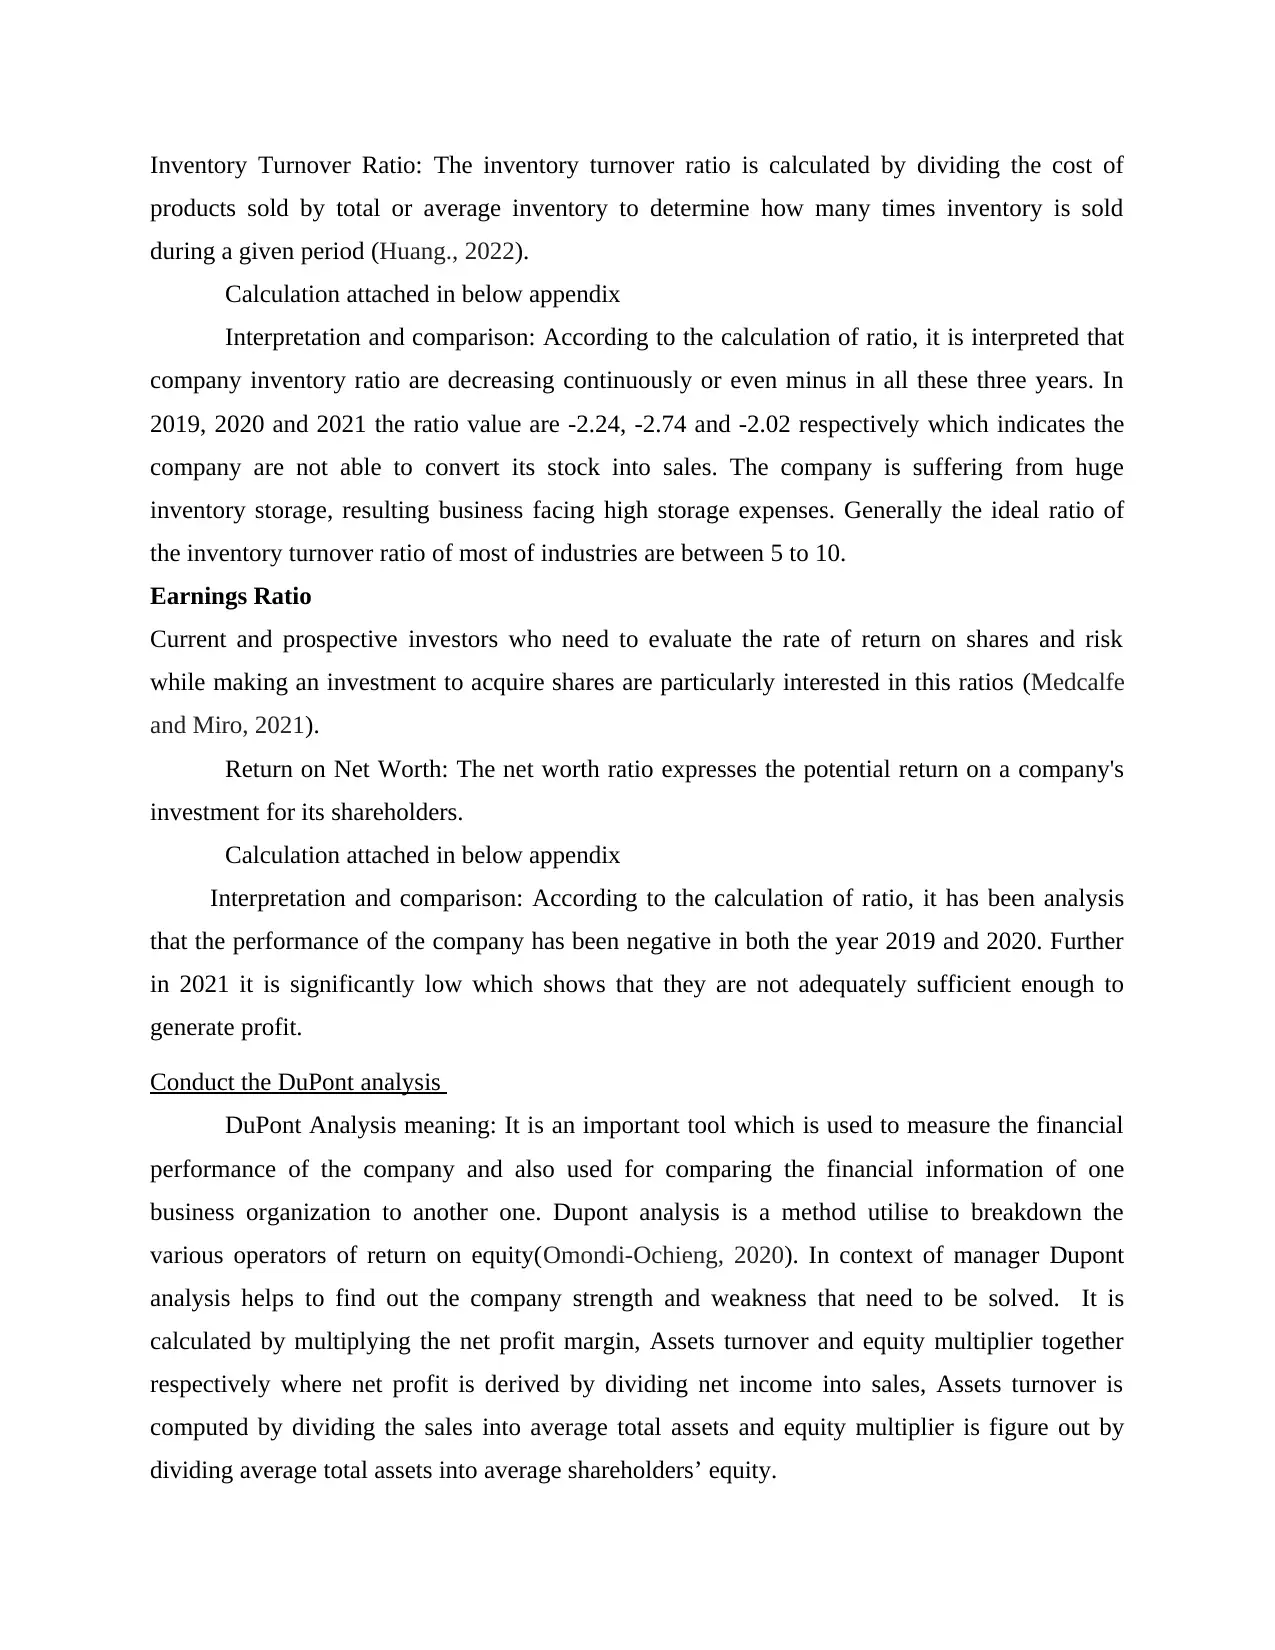
Particular Formula 2019 2020 2021
DuPont
Analysis Net Profit margin × AT × EM
-
0.00661 -0.041 0.062
Evaluating profitability of the company with the help of graphs
Every company want to generate higher profits in order to achieve their goals. Segment margin is
a profitability metric that evaluates the profit or loss made by a business's specific product line or
geographic area. The segment margin is primarily used to compare the profitability of various
firm components (Przychodzen and et.al., 2018).
According to the gross profit ratio company is performing well because gross profit ratio
increasing every year and this indicate that company working in efficient manner in order to
manage their cost of production.
According to the operating profit ratio company suffering huge losses in two respective year
2019 and 2020 but in 2021 year company generate profits and this indicate that company is
efficiently working in order to improve its operating profits. Company effectively and efficiently
manage their operating expenses. Company’s financial position in last two years is not good
⊘ This is a preview!⊘
Do you want full access?
Subscribe today to unlock all pages.
Trusted by 1+ million students worldwide
because of losses but in 2021 it improve its performance and back on track to achieve its
objectives.
Discussing suitable business strategies and its use in future purpose
Business strategies are a set of actions or set of decisions that provide direction for the
operations to achieving business goal. It is complete plan that is prepared or implemented by the
management of the company to survive in the market. In other words, It is long term design of
the desired image, direction and destination of the company (Rahman and et.al., 2020). It is a
continuous process which take too much time but they are profitable for the organisations. These
strategies are prepared with the help of past performance of the company and by analysing future
market conditions.
There is various type of suitable business strategies are discussed below:
1. Structuralist: this strategy help in order to take business operations around the market
conditions with the help of industry structure. It formed a proper structure among the
customer and buyer. This structuralist strategies are attractive when a firm has enough
resources and have ability to build different position in the market.
2. Growth strategy: This strategy adopted in order to launch new product or by improving
existing product. Company has to always one step forward from its competitors so it has
to modify it product time to time according to the needs of consumer otherwise consumer
may shift to other company and trust of consumer is also decreased. Company has to
adopt new technology in order to update its products.
3. Finding new marketplace: This strategy tells about the adoption of new marketplace with
the aim of increase sale. Company has to explore new market in order to increase its
customer and growth. A new market place provide new opportunities to the company and
if company deal with these opportunities in efficient manner than it is beneficial for the
company. This is a very important strategy to reach maximum number of people to sell
its product.
4. Product differentiates strategy: Small companies are using this strategy when they have
advantages. They improve quality of the product or adding new features to them. The
main objective of this strategy is to make company product different and innovative from
its competitors so that consumer only have one choice in the market to purchase such
product. It is helpful to maximise sales and also increase the brand value of the company.
Paraphrase This Document
Need a fresh take? Get an instant paraphrase of this document with our AI Paraphraser
Price skimming strategy: This strategy mainly focuses on the covering its production and
advertising cost by increasing the prices of product. This strategy helps a firm to recovers its
expenses cost as fast as possible by rising prices. This strategy only works when the product is
special or necessary for the consumers and they can purchase in high prices also (Vibhakar and
et.al., 2020).
Above discussed strategies are helpful for company Cash convertor international limited in
maximising growth as well as profitability of the firm. These strategies are developed to the
purpose of:
Achieving the goal with effectiveness
Recognizing and utilising the future opportunities
Collection of various resources
Affixing the favourable position in the market.
Provide strength to meet future challenges and threats
Guiding Efforts, behaviour and attitudes
Provide dictation over the market situations.
CONCLUSION
From the above report, it can be concluded that the financial analytics for business
administrative decisions of the company, Cash Converter International Limited. It is observed
after calculating the five different financial ratios on the basis of a three-year financial statement.
The ratio includes the current ratio, return on net worth, gross profit ratio, inventory ratio, and
debt-equity ratio. It was further helpful for the company in analysing the financial position of the
company by comparing all these ratio results. These ratios indicate that a company has not
performed well over the last three years, implying that the company is generating risk on its own.
It is implemented because the business operations are not properly controlled and managed by
the department of accounts or the manager itself, which causes the high debt over equity,
decreasing inventory stock, and so on.
REFERENCES
Books and Journals
Chen, C.J. and et.al., 2018. How business strategy in non-financial firms moderates the
curvilinear effects of corporate social responsibility and irresponsibility on corporate
financial performance. Journal of Business Research. 92, pp.154-167.
Cui, Y. and et.al., 2019. Top management team knowledge heterogeneity, ownership structure
and financial performance: Evidence from Chinese IT listed companies. Technological
Forecasting and Social Change. 140, pp.14-21.
Gan, H. and et.al., 2020. Non-financial performance measures, CEO compensation, and firms’
future value. Journal of Business Research. 110, pp.213-227.
Hua, N. and et.al., 2018. Do loyalty programs really matter for hotel operational and financial
performance?. International Journal of Contemporary Hospitality Management.
Huang, J., 2022. Corporate social responsibility and financial performance: The moderating role
of the turnover of local officials. Finance Research Letters. 46, p.102497.
Medcalfe, S. and Miro, E.M., 2021. Sustainable practices and financial performance in fashion
firms. Journal of Fashion Marketing and Management: An International Journal.
Omondi-Ochieng, P., 2020. Financial performance of the United Kingdom's national non-profit
sport federations: A binary logistic regression approach. Managerial Finance.
Przychodzen, W. and et.al., 2018. Green information technologies practices and financial
performance–the empirical evidence from German publicly traded companies. Journal
of Cleaner Production. 201, pp.570-579.
Rahman, M.T. and et.al., 2020. Impact of management practices and managerial ability on the
financial performance of aquaculture farms in Bangladesh. Aquaculture Economics &
Management. 24(1), pp.79-101.
Vibhakar, N.N. and et.al., 2020. Identification of significant financial performance indicators for
the Indian construction companies. International Journal of Construction Management,
pp.1-11.
⊘ This is a preview!⊘
Do you want full access?
Subscribe today to unlock all pages.
Trusted by 1+ million students worldwide
Appendix
Ratios Formula
Year
2019 2020 2021
Current Ratio Current assets / Current Liabilities 2.24 2.31 2.72
Debt Equity Ratio Debt / Equity 0.11 0.09 0.07
Inventory Turnover
Ratio Cost of Goods Sold / Average Inventory -2.24 -2.74 -2.02
Return on Net worth Net Income / Shareholder Equity -0.01 -0.04 0.06
Ratios Formula
Year
2019 2020 2021
Gross Profit (Cost of Goods Sold / Revenue)*100 55.16 60.16 70.49
Operating Profit Ratio (Operating Profit / Net Sales) * 100 -0.84 -4.77 8.48
Ratios Formula
Year
2019 2020 2021
Current Ratio Current assets / Current Liabilities 2.24 2.31 2.72
Debt Equity Ratio Debt / Equity 0.11 0.09 0.07
Inventory Turnover
Ratio Cost of Goods Sold / Average Inventory -2.24 -2.74 -2.02
Return on Net worth Net Income / Shareholder Equity -0.01 -0.04 0.06
Ratios Formula
Year
2019 2020 2021
Gross Profit (Cost of Goods Sold / Revenue)*100 55.16 60.16 70.49
Operating Profit Ratio (Operating Profit / Net Sales) * 100 -0.84 -4.77 8.48
1 out of 10
Related Documents


Your All-in-One AI-Powered Toolkit for Academic Success.
+13062052269
info@desklib.com
Available 24*7 on WhatsApp / Email
![[object Object]](/_next/static/media/star-bottom.7253800d.svg)
Unlock your academic potential
Copyright © 2020–2026 A2Z Services. All Rights Reserved. Developed and managed by ZUCOL.