ACC10007: Financial Analysis of Premier Investments Cash Flows
VerifiedAdded on 2022/11/10
|5
|1114
|118
Report
AI Summary
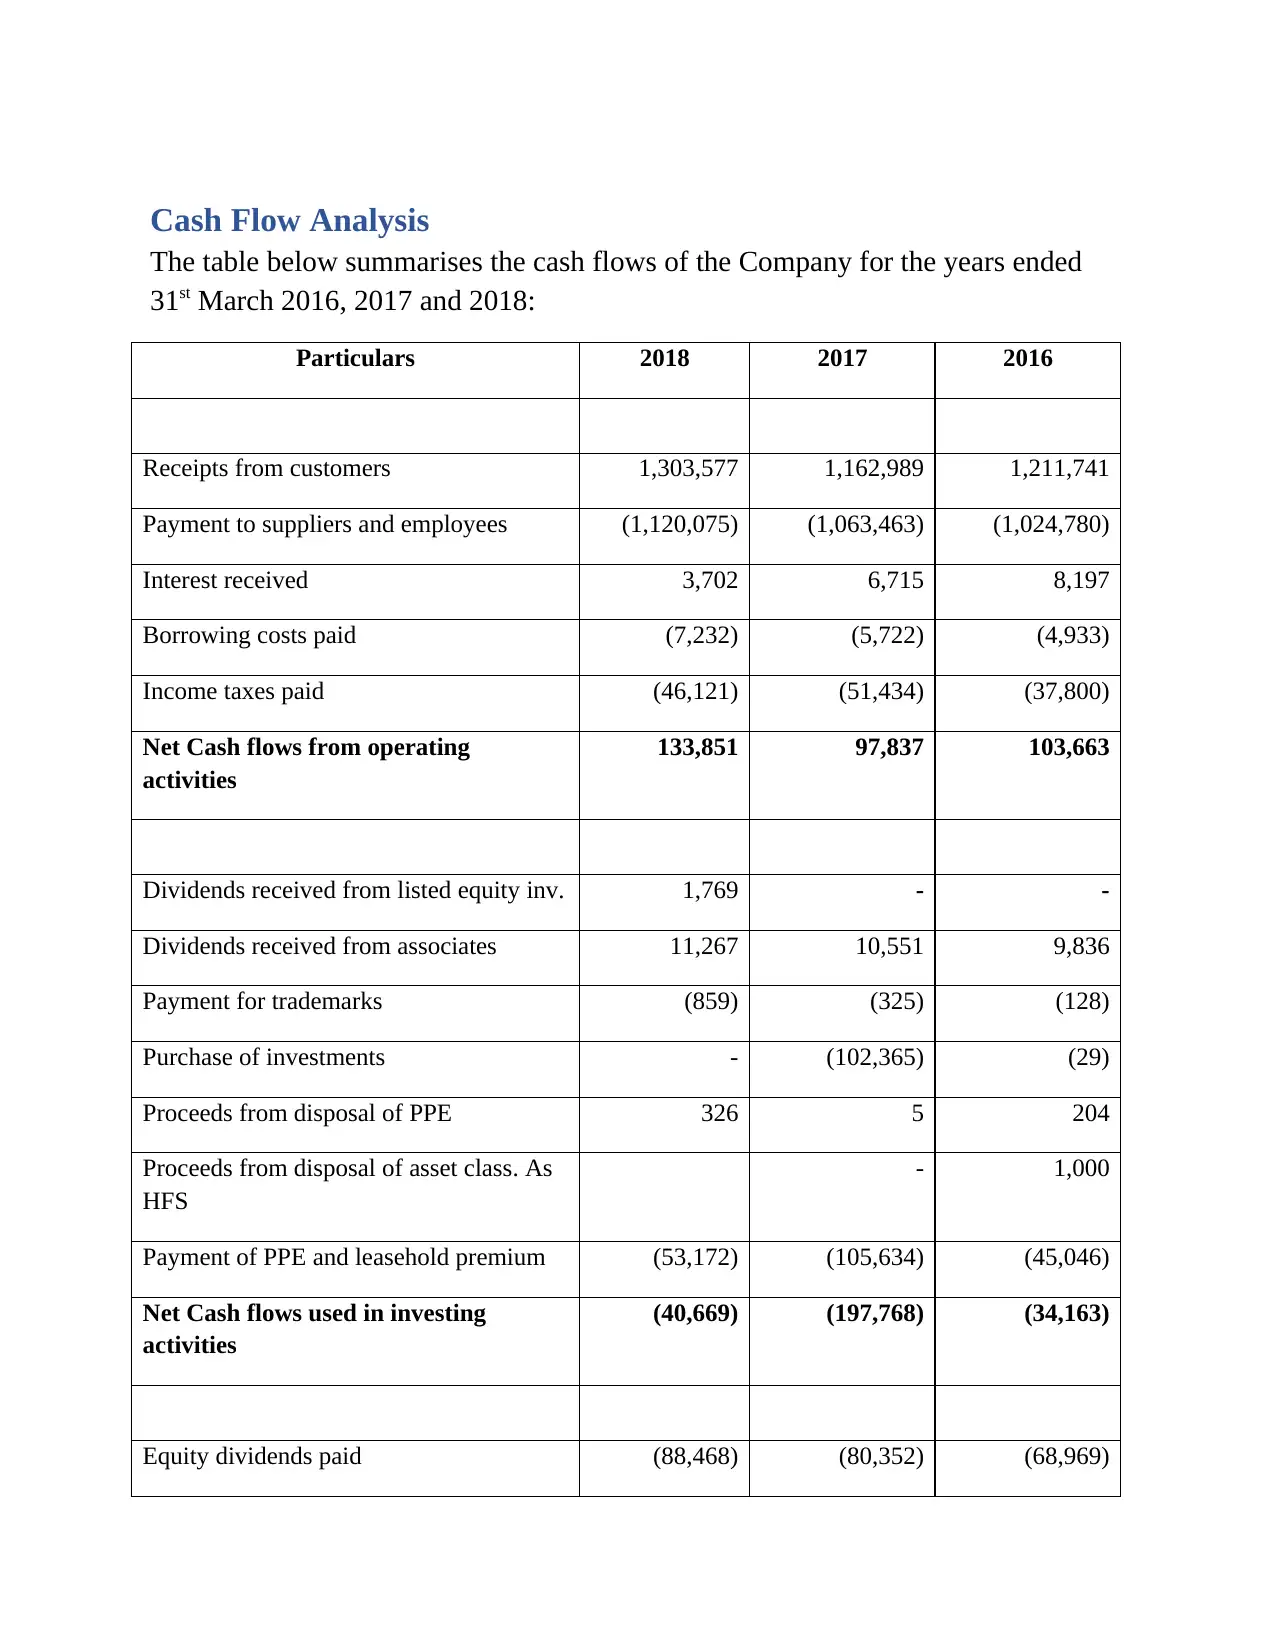
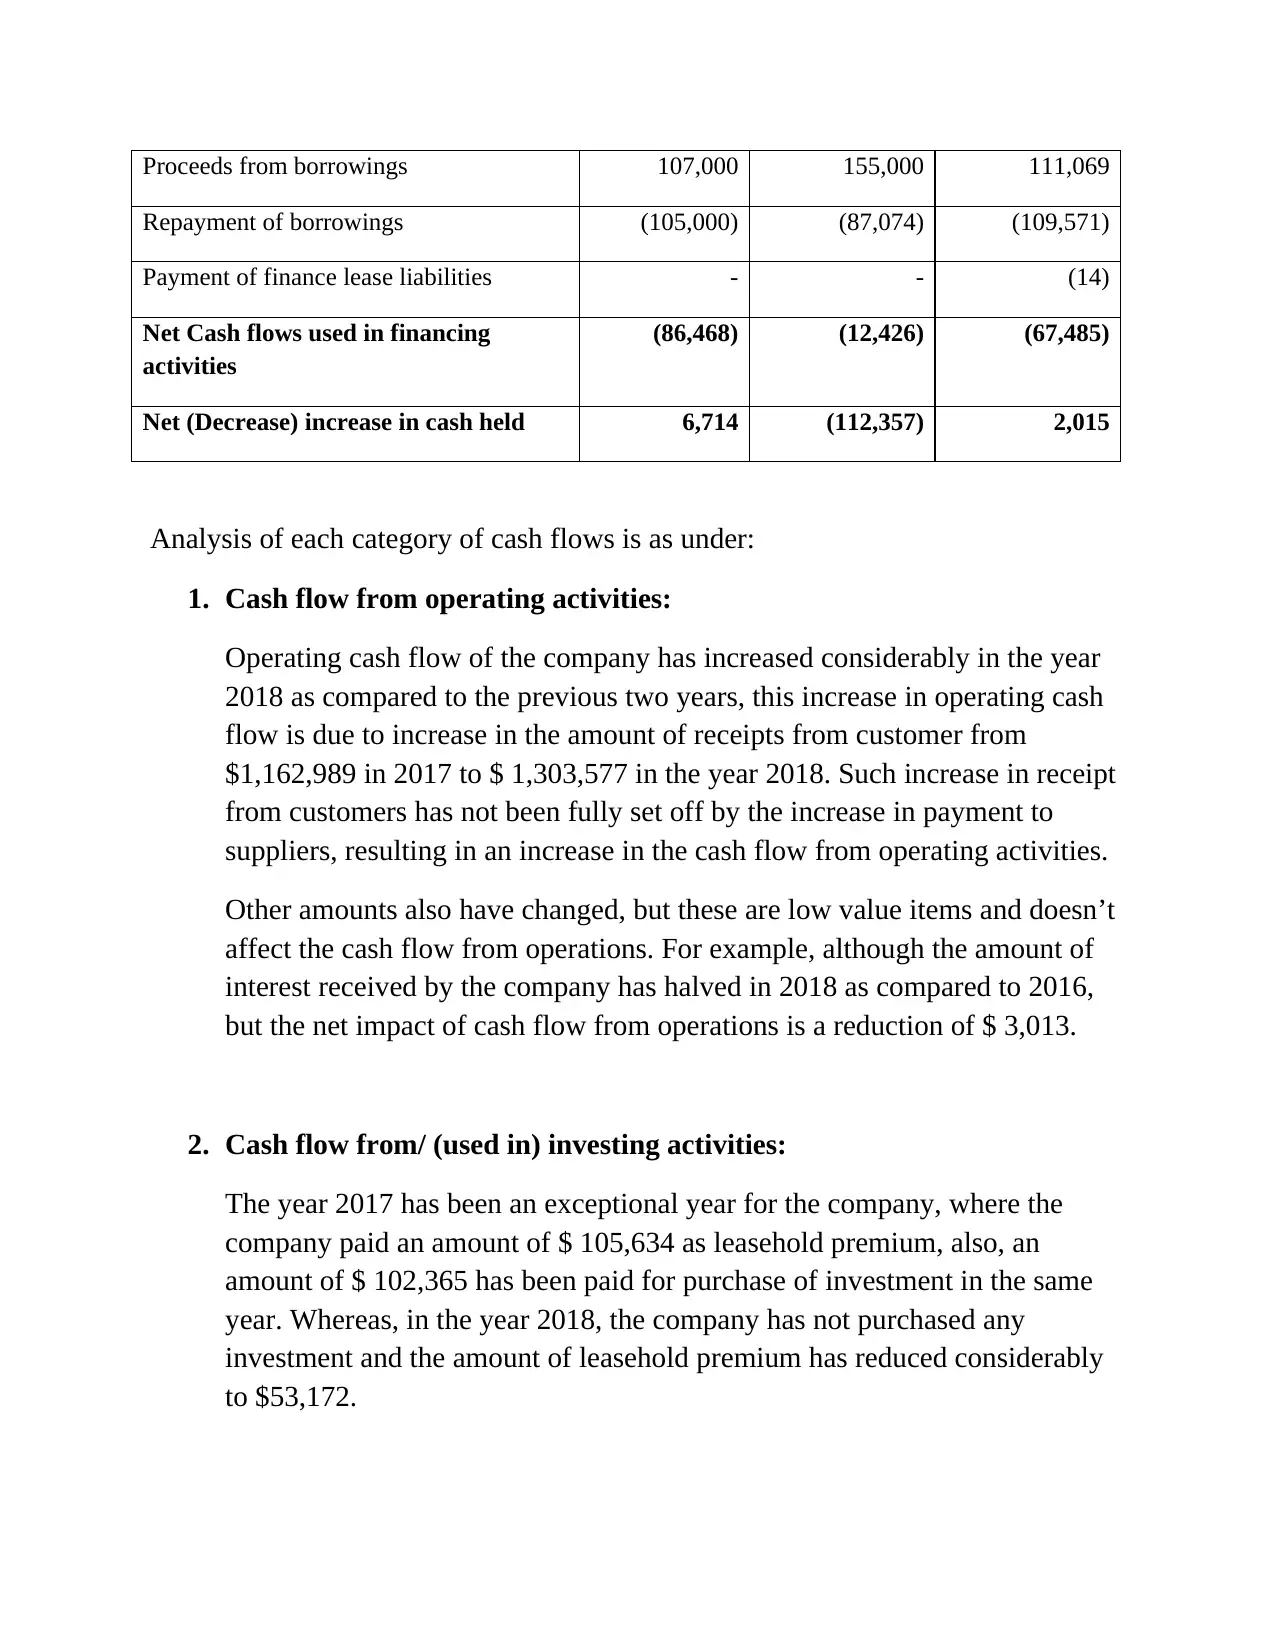
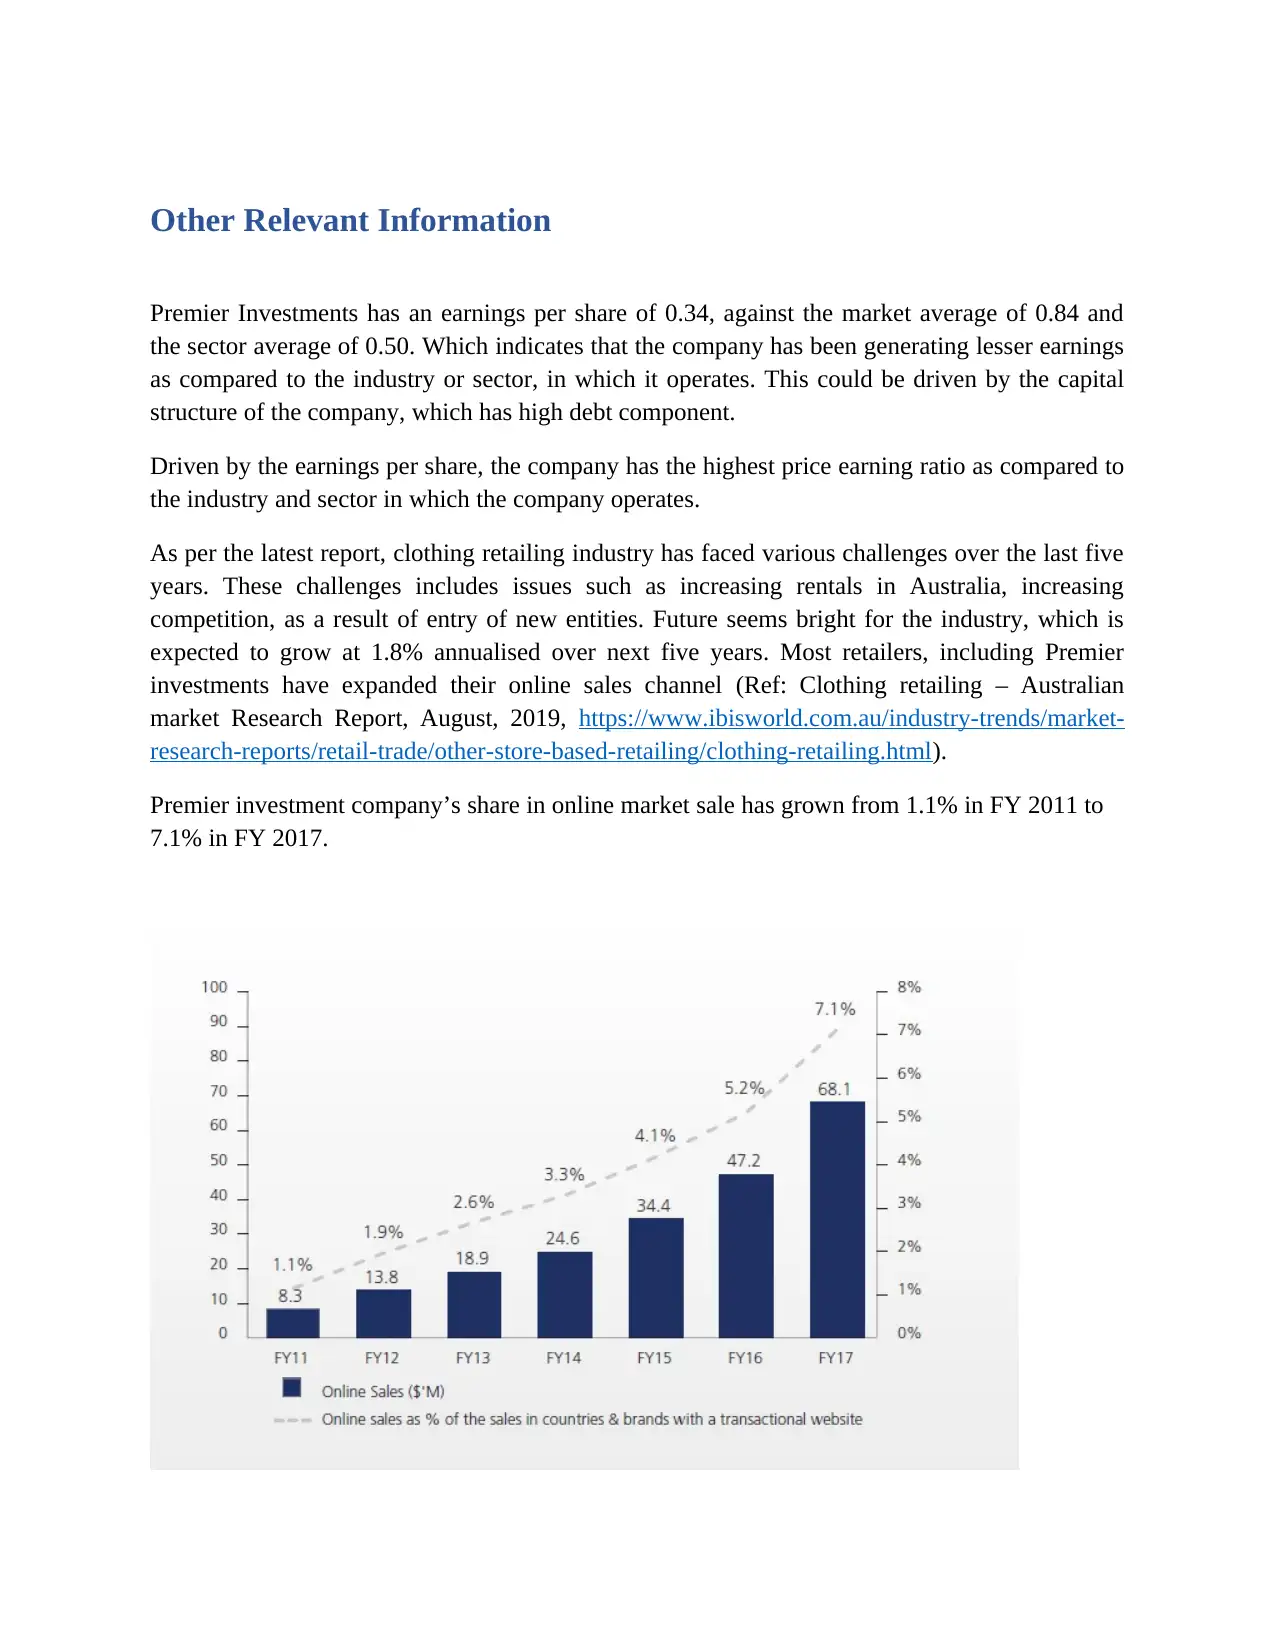
This report presents a cash flow analysis of Premier Investments Limited for the years ending March 31, 2016, 2017, and 2018. The analysis examines the company's cash flows from operating, investing, and financing activities, using data from the annual reports. Operating cash flow increased in 2018 due to higher receipts from customers. Investing activities saw significant fluctuations, particularly in 2017 due to a large leasehold premium payment and investment purchases. Financing activities reveal consistent dividend payments and varying levels of borrowing and repayment. The report also includes relevant information such as earnings per share and industry challenges, along with Premier Investments' expansion plans. Overall, the company generates positive cash flows, except for 2017, and is expanding its online sales channel and planning to open new stores.
1 out of 5
Related Documents


Your All-in-One AI-Powered Toolkit for Academic Success.
+13062052269
info@desklib.com
Available 24*7 on WhatsApp / Email
![[object Object]](/_next/static/media/star-bottom.7253800d.svg)
Copyright © 2020–2026 A2Z Services. All Rights Reserved. Developed and managed by ZUCOL.