City & Islington College: Financial Budgeting and Analysis Homework

Verified

Added on  2022/11/29

|7
|1213
|86
Homework Assignment
AI Summary
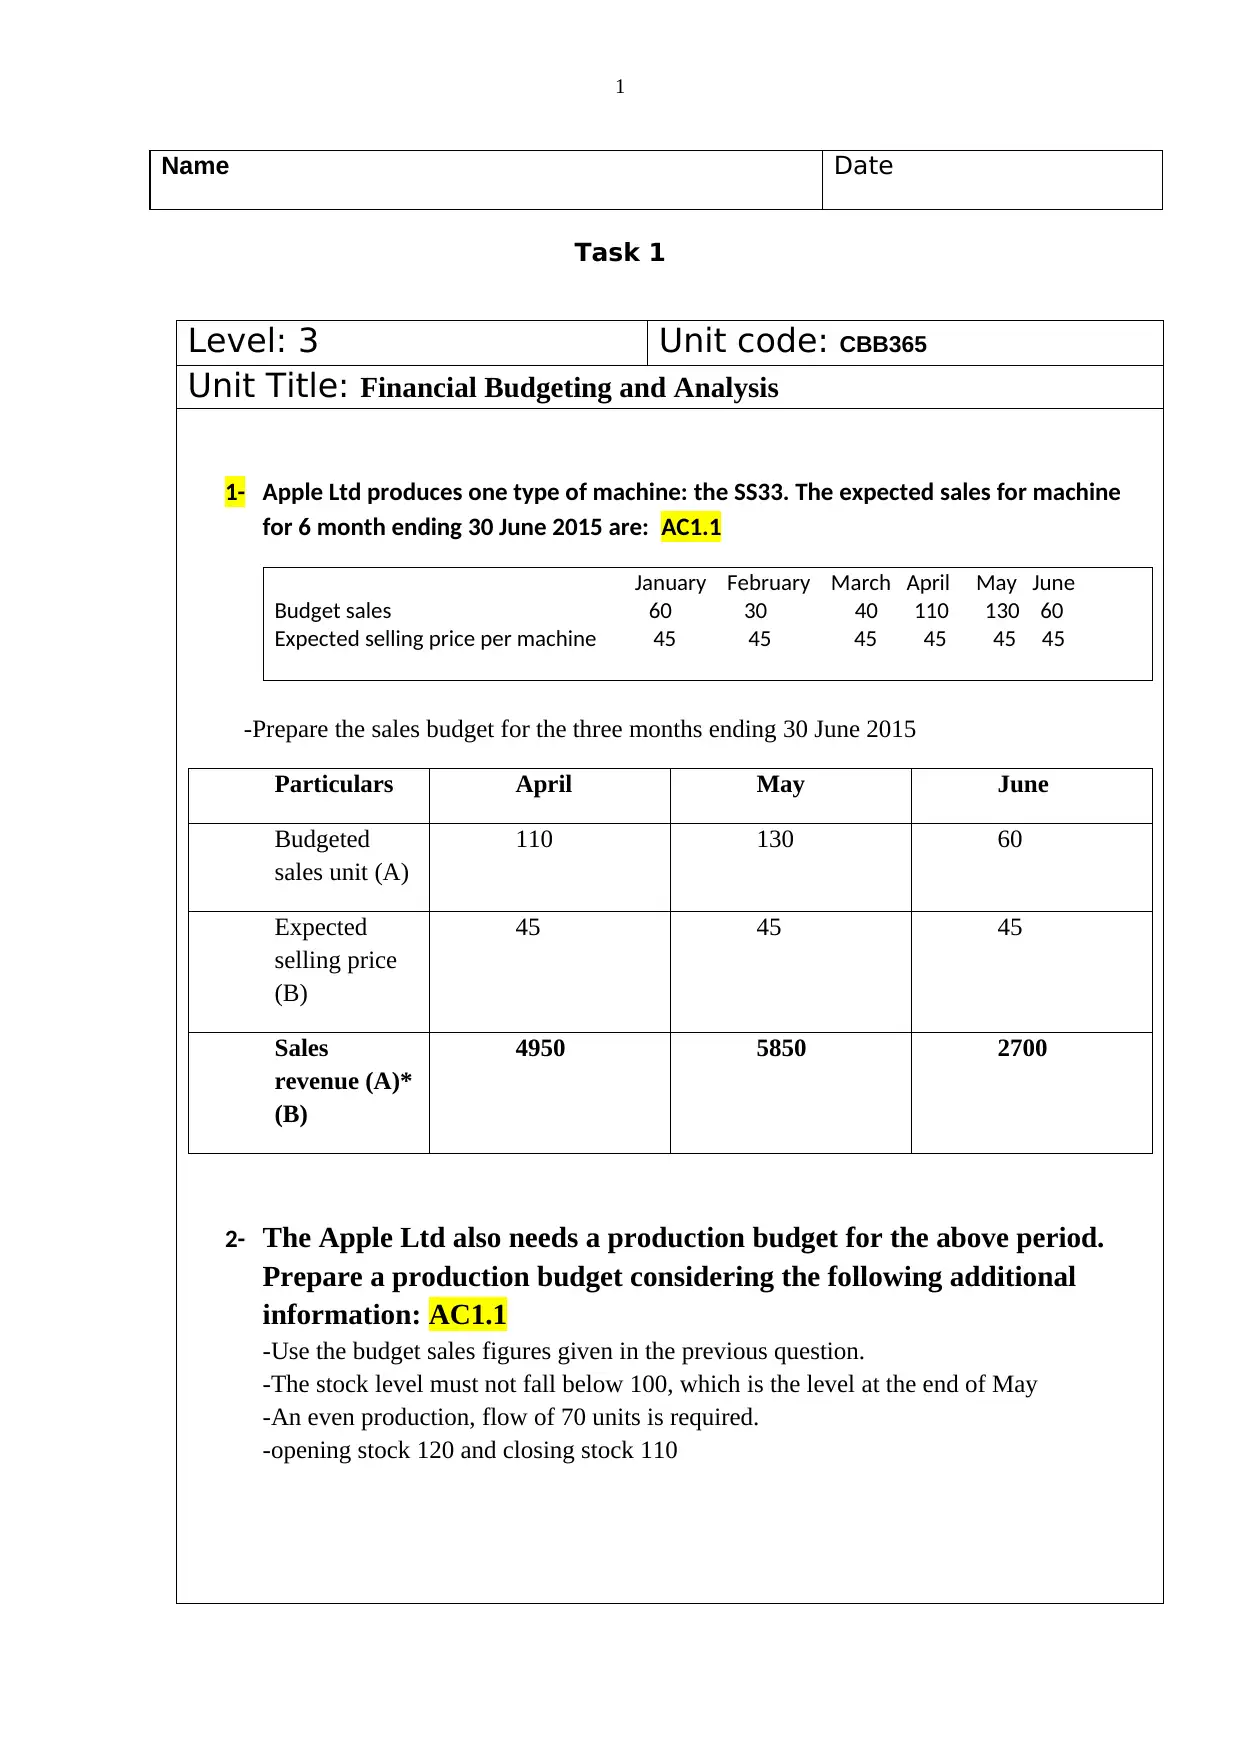
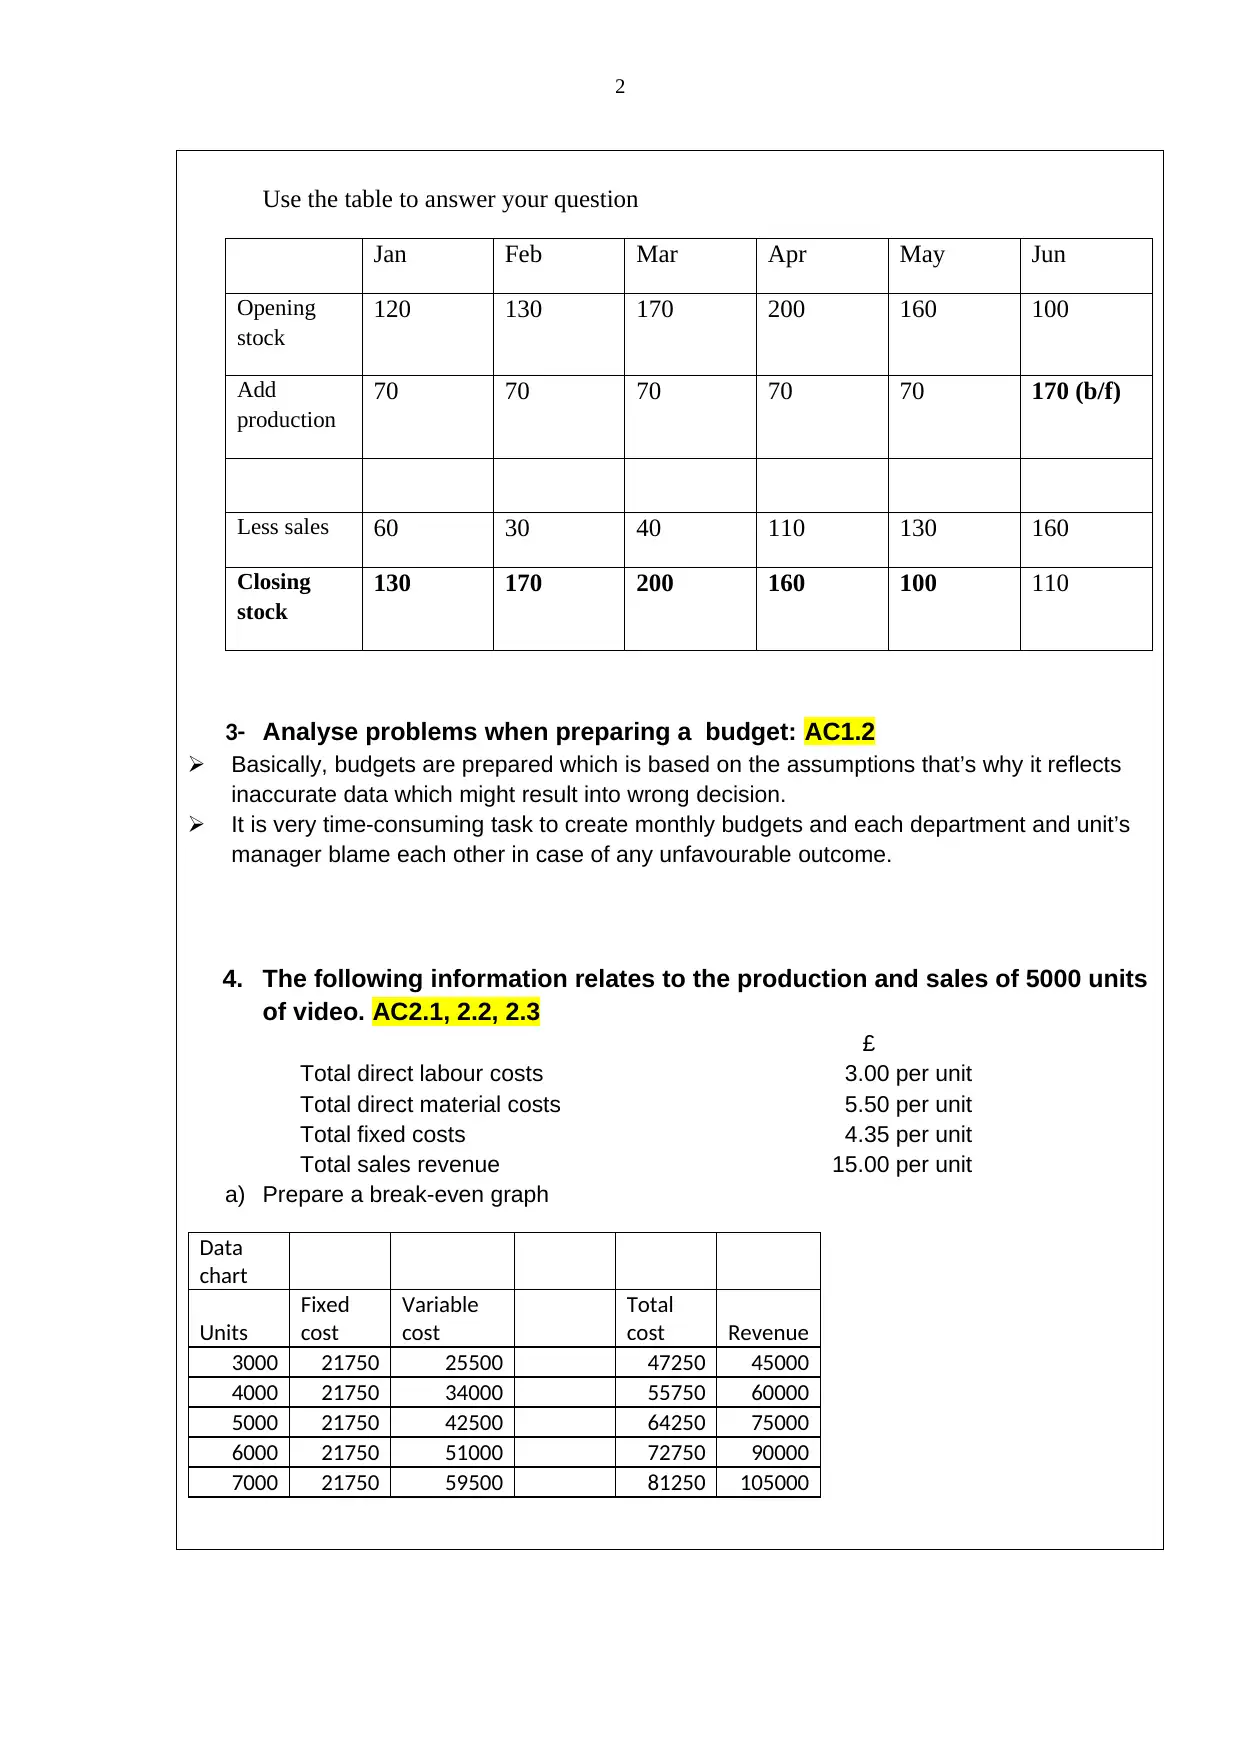
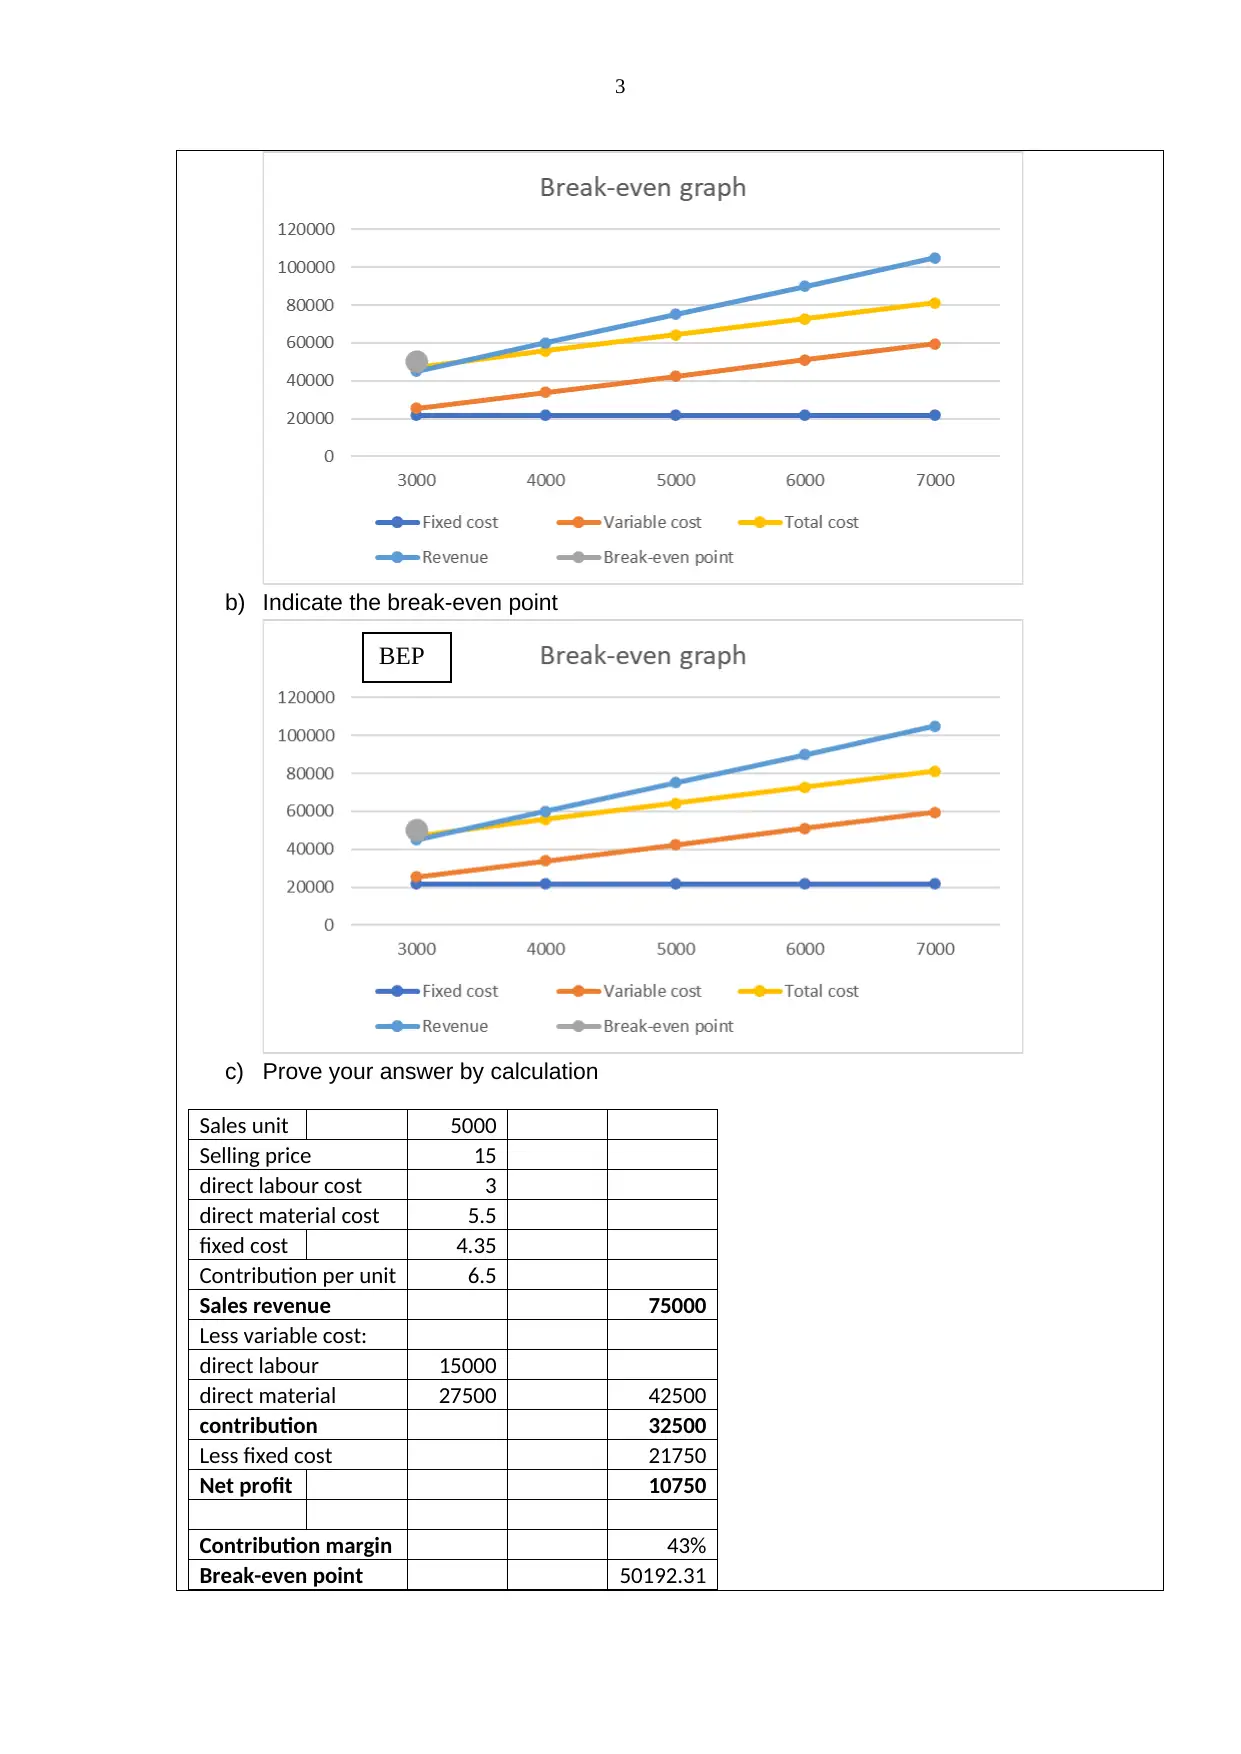
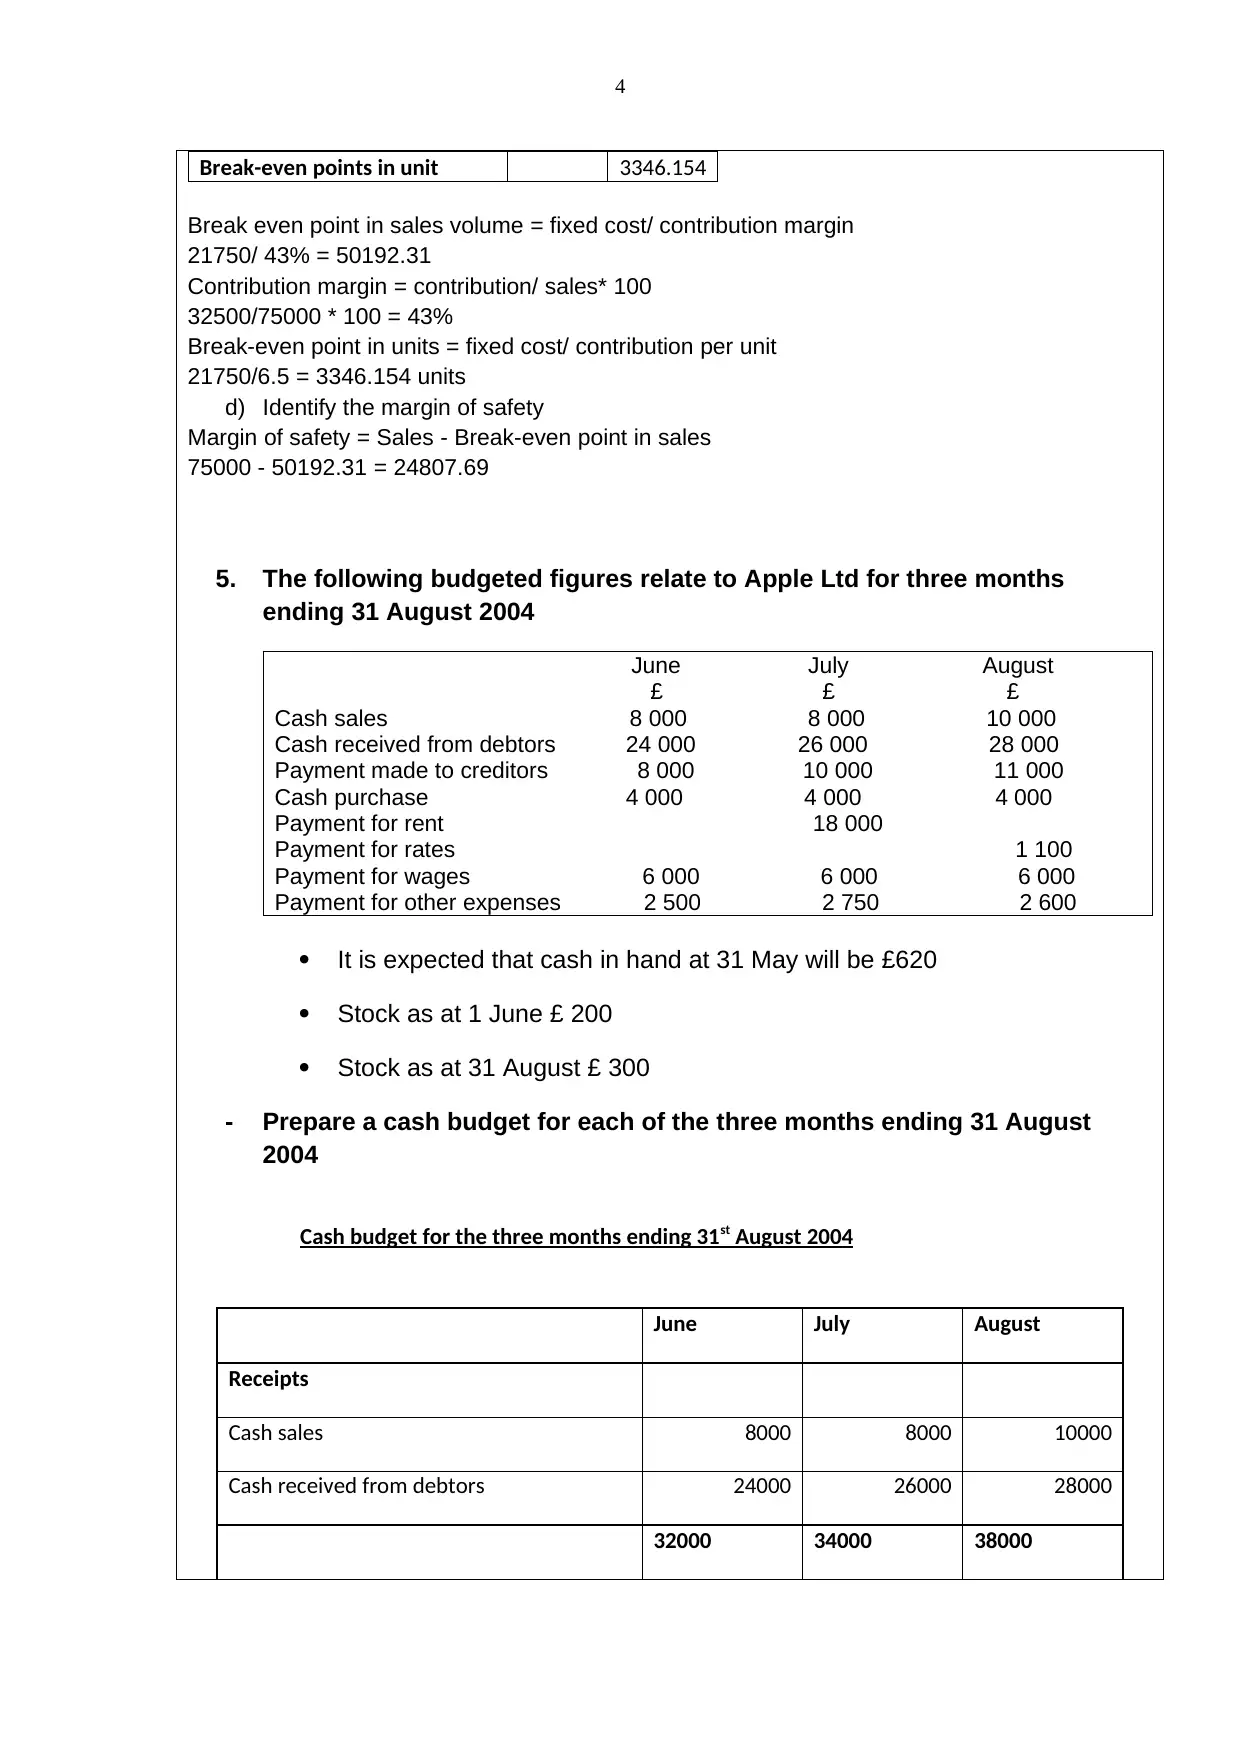
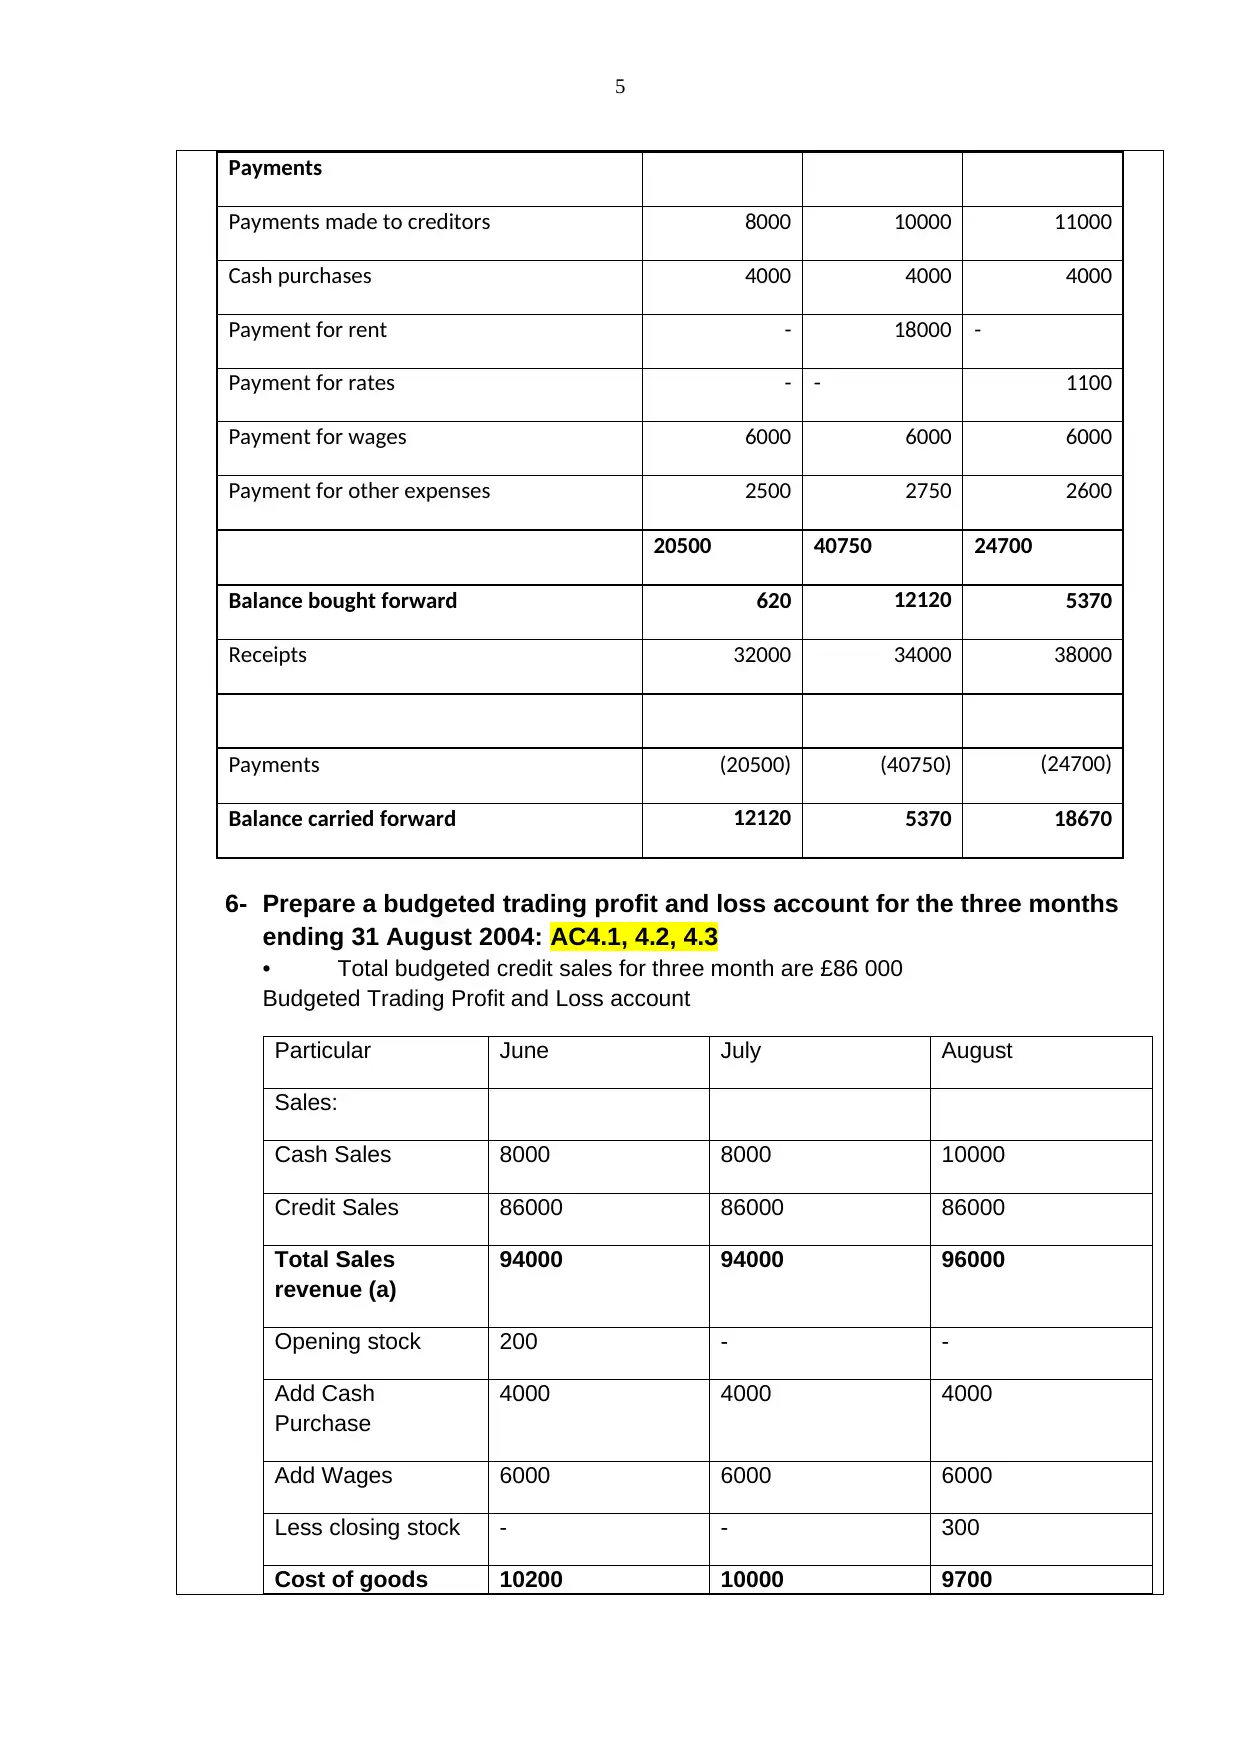
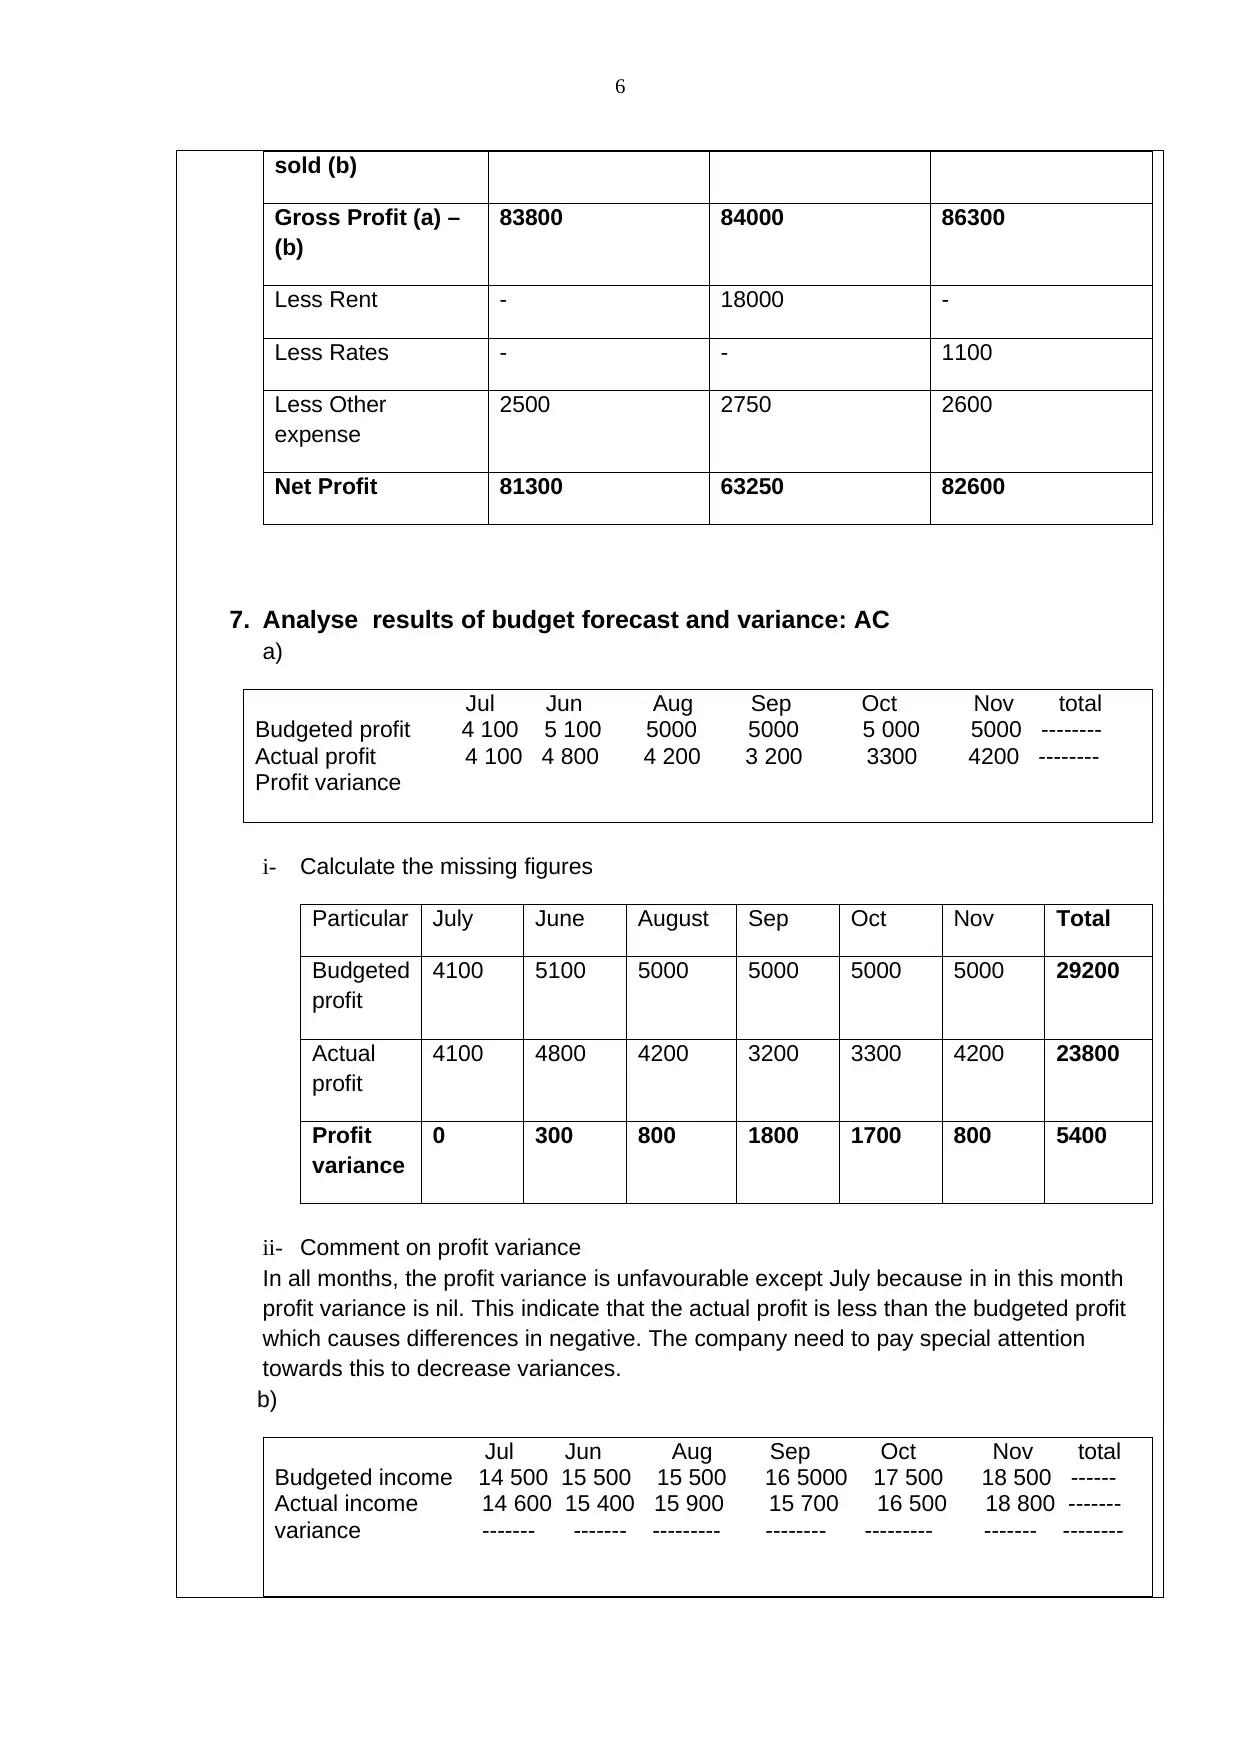
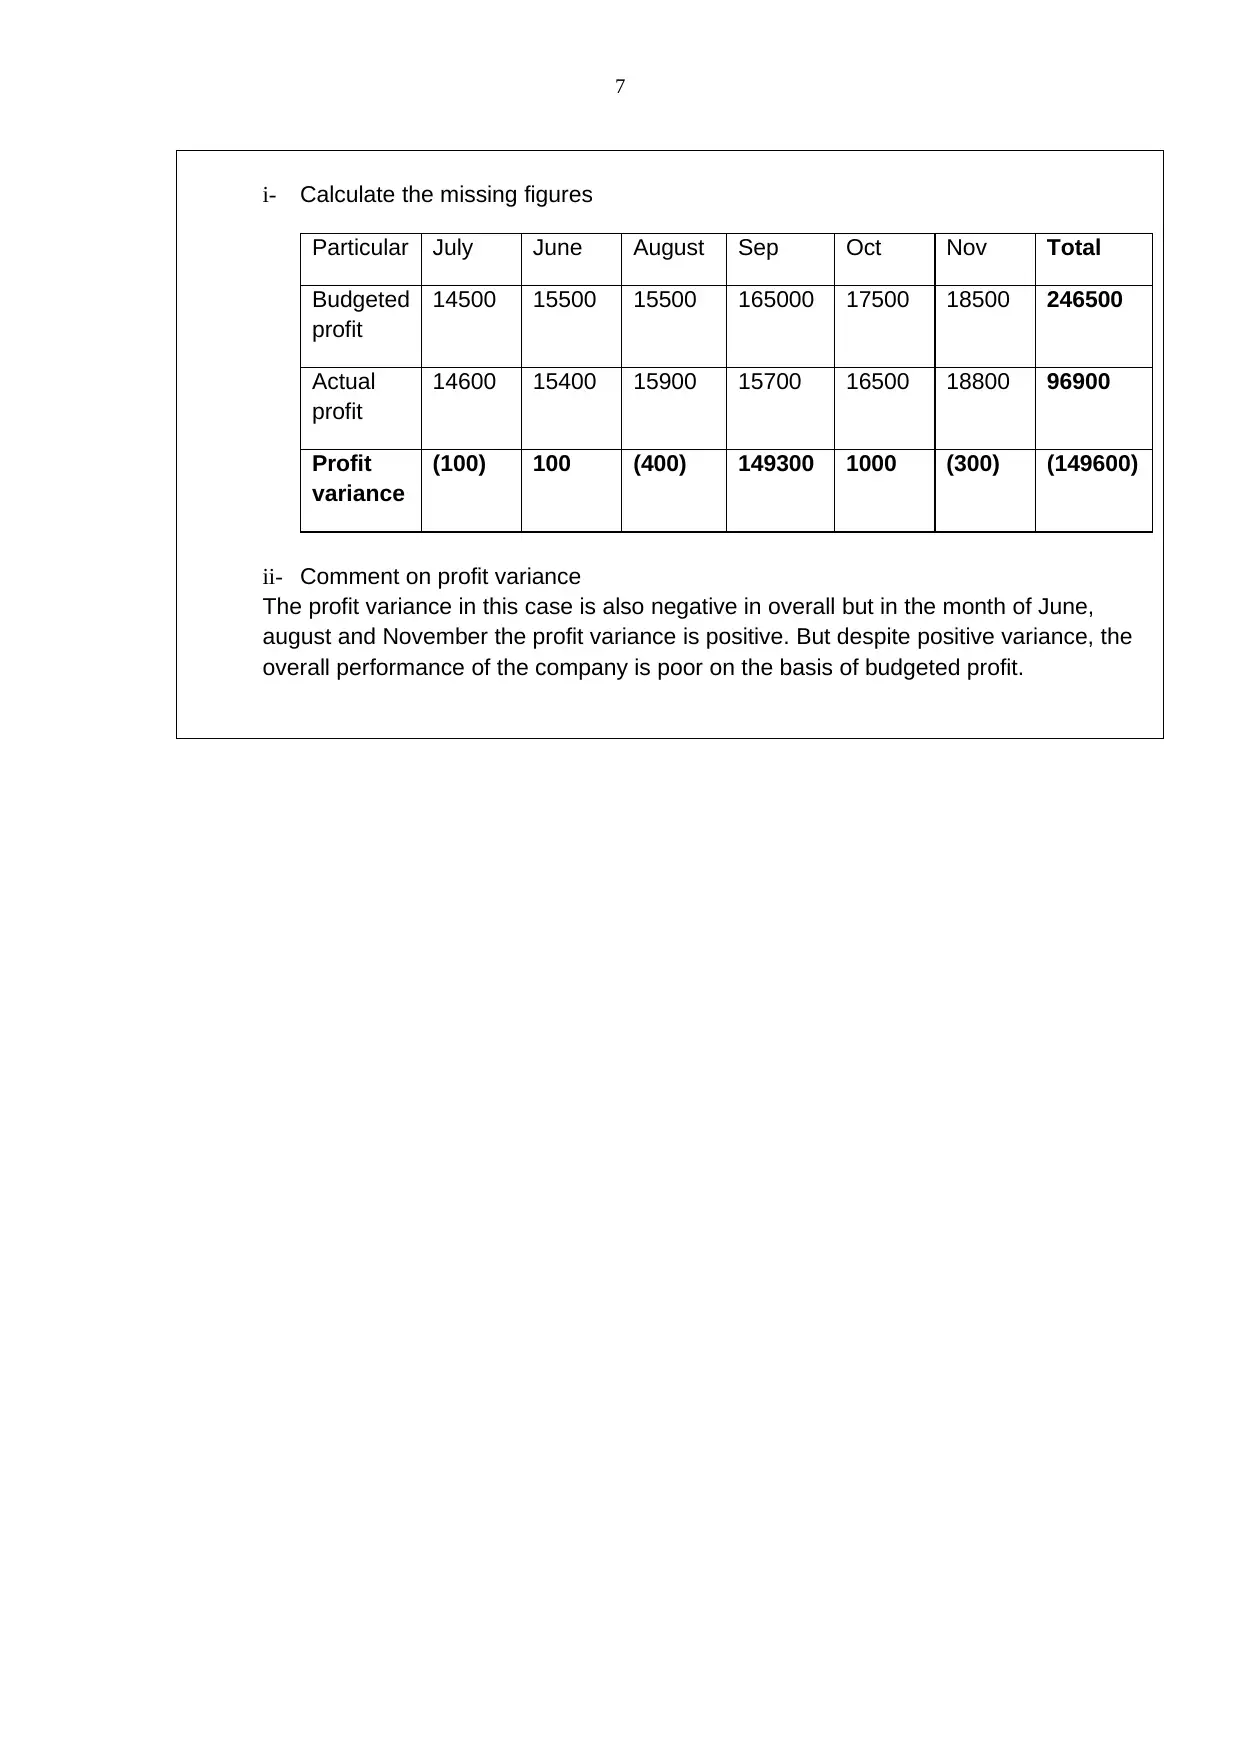
This assignment solution addresses key concepts in financial budgeting and analysis, using Apple Ltd as a case study. It includes the creation of sales and production budgets, along with a break-even analysis to determine profitability. The solution further explores cash budgeting for a three-month period, incorporating cash sales and debtor receipts. A budgeted trading profit and loss account is prepared, and the analysis extends to budget forecast results and variance analysis. The assignment also delves into cost behavior, examining variable, fixed, mixed, and step-variable costs and their impact on budget preparation. It covers marginal costing and provides a detailed breakdown of calculations and interpretations to aid in understanding the practical application of financial planning principles.
Document Page
Name Date
Task 1
Level: 3 Unit code: CBB365
Unit Title: Financial Budgeting and Analysis
1- Apple Ltd produces one type of machine: the SS33. The expected sales for machine
for 6 month ending 30 June 2015 are: AC1.1
January February March April May June
Budget sales 60 30 40 110 130 60
Expected selling price per machine 45 45 45 45 45 45
-Prepare the sales budget for the three months ending 30 June 2015
Particulars April May June
Budgeted
sales unit (A)
110 130 60
Expected
selling price
(B)
45 45 45
Sales
revenue (A)*
(B)
4950 5850 2700
2- The Apple Ltd also needs a production budget for the above period.
Prepare a production budget considering the following additional
information: AC1.1
-Use the budget sales figures given in the previous question.
-The stock level must not fall below 100, which is the level at the end of May
-An even production, flow of 70 units is required.
-opening stock 120 and closing stock 110
1
tabler-icon-diamond-filled.svg

Paraphrase This Document

Need a fresh take? Get an instant paraphrase of this document with our AI Paraphraser
Document Page
Use the table to answer your question
Jan Feb Mar Apr May Jun
Opening
stock
120 130 170 200 160 100
Add
production
70 70 70 70 70 170 (b/f)
Less sales 60 30 40 110 130 160
Closing
stock
130 170 200 160 100 110
3- Analyse problems when preparing a budget: AC1.2
 Basically, budgets are prepared which is based on the assumptions that’s why it reflects
inaccurate data which might result into wrong decision.
 It is very time-consuming task to create monthly budgets and each department and unit’s
manager blame each other in case of any unfavourable outcome.
4. The following information relates to the production and sales of 5000 units
of video. AC2.1, 2.2, 2.3
£
Total direct labour costs 3.00 per unit
Total direct material costs 5.50 per unit
Total fixed costs 4.35 per unit
Total sales revenue 15.00 per unit
a) Prepare a break-even graph
Data
chart
Units
Fixed
cost
Variable
cost
Total
cost Revenue
3000 21750 25500 47250 45000
4000 21750 34000 55750 60000
5000 21750 42500 64250 75000
6000 21750 51000 72750 90000
7000 21750 59500 81250 105000
2
Document Page
b) Indicate the break-even point
c) Prove your answer by calculation
Sales unit 5000
Selling price 15
direct labour cost 3
direct material cost 5.5
fixed cost 4.35
Contribution per unit 6.5
Sales revenue 75000
Less variable cost:
direct labour 15000
direct material 27500 42500
contribution 32500
Less fixed cost 21750
Net profit 10750
Contribution margin 43%
Break-even point 50192.31
3
BEP
Document Page
Break-even points in unit 3346.154
Break even point in sales volume = fixed cost/ contribution margin
21750/ 43% = 50192.31
Contribution margin = contribution/ sales* 100
32500/75000 * 100 = 43%
Break-even point in units = fixed cost/ contribution per unit
21750/6.5 = 3346.154 units
d) Identify the margin of safety
Margin of safety = Sales - Break-even point in sales
75000 - 50192.31 = 24807.69
5. The following budgeted figures relate to Apple Ltd for three months
ending 31 August 2004
June July August
£ £ £
Cash sales 8 000 8 000 10 000
Cash received from debtors 24 000 26 000 28 000
Payment made to creditors 8 000 10 000 11 000
Cash purchase 4 000 4 000 4 000
Payment for rent 18 000
Payment for rates 1 100
Payment for wages 6 000 6 000 6 000
Payment for other expenses 2 500 2 750 2 600
 It is expected that cash in hand at 31 May will be £620
 Stock as at 1 June £ 200
 Stock as at 31 August £ 300
- Prepare a cash budget for each of the three months ending 31 August
2004
Cash budget for the three months ending 31st August 2004
June July August
Receipts
Cash sales 8000 8000 10000
Cash received from debtors 24000 26000 28000
32000 34000 38000
4
tabler-icon-diamond-filled.svg

Paraphrase This Document

Need a fresh take? Get an instant paraphrase of this document with our AI Paraphraser
Document Page
Payments
Payments made to creditors 8000 10000 11000
Cash purchases 4000 4000 4000
Payment for rent - 18000 -
Payment for rates - - 1100
Payment for wages 6000 6000 6000
Payment for other expenses 2500 2750 2600
20500 40750 24700
Balance bought forward 620 12120 5370
Receipts 32000 34000 38000
Payments (20500) (40750) (24700)
Balance carried forward 12120 5370 18670
6- Prepare a budgeted trading profit and loss account for the three months
ending 31 August 2004: AC4.1, 4.2, 4.3
• Total budgeted credit sales for three month are £86 000
Budgeted Trading Profit and Loss account
Particular June July August
Sales:
Cash Sales 8000 8000 10000
Credit Sales 86000 86000 86000
Total Sales
revenue (a)
94000 94000 96000
Opening stock 200 - -
Add Cash
Purchase
4000 4000 4000
Add Wages 6000 6000 6000
Less closing stock - - 300
Cost of goods 10200 10000 9700
5
Document Page
sold (b)
Gross Profit (a) –
(b)
83800 84000 86300
Less Rent - 18000 -
Less Rates - - 1100
Less Other
expense
2500 2750 2600
Net Profit 81300 63250 82600
7. Analyse results of budget forecast and variance: AC
a)
Jul Jun Aug Sep Oct Nov total
Budgeted profit 4 100 5 100 5000 5000 5 000 5000 --------
Actual profit 4 100 4 800 4 200 3 200 3300 4200 --------
Profit variance
i- Calculate the missing figures
Particular July June August Sep Oct Nov Total
Budgeted
profit
4100 5100 5000 5000 5000 5000 29200
Actual
profit
4100 4800 4200 3200 3300 4200 23800
Profit
variance
0 300 800 1800 1700 800 5400
ii- Comment on profit variance
In all months, the profit variance is unfavourable except July because in in this month
profit variance is nil. This indicate that the actual profit is less than the budgeted profit
which causes differences in negative. The company need to pay special attention
towards this to decrease variances.
b)
Jul Jun Aug Sep Oct Nov total
Budgeted income 14 500 15 500 15 500 16 5000 17 500 18 500 ------
Actual income 14 600 15 400 15 900 15 700 16 500 18 800 -------
variance ------- ------- --------- -------- --------- ------- --------
6
Document Page
i- Calculate the missing figures
Particular July June August Sep Oct Nov Total
Budgeted
profit
14500 15500 15500 165000 17500 18500 246500
Actual
profit
14600 15400 15900 15700 16500 18800 96900
Profit
variance
(100) 100 (400) 149300 1000 (300) (149600)
ii- Comment on profit variance
The profit variance in this case is also negative in overall but in the month of June,
august and November the profit variance is positive. But despite positive variance, the
overall performance of the company is poor on the basis of budgeted profit.
7
chevron_up_icon
1 out of 7
circle_padding
hide_on_mobile
zoom_out_icon
[object Object]