Financial Performance Analysis: Citadel Group PLC Project Report
VerifiedAdded on 2020/05/08
|15
|3444
|188
Project
AI Summary
This project report provides a comprehensive financial analysis of Citadel Group PLC, examining its performance in the Australian market. The analysis covers debt valuation, share valuation, cost of capital, and market analysis to assess the company's financial health and position within the industry. The report evaluates the company's debt levels, share prices using dividend discount and PE multiple models, and cost of capital, highlighting areas for improvement in capital structure. The market analysis assesses the company's standing and growth opportunities, concluding that Citadel Group PLC is performing well and offers investment potential, with a focus on optimizing its capital structure for improved financial performance. The report uses financial data from 2016 and 2017, including revenue, EPS, and dividend information, to support its findings and recommendations.
Running Head: Introduction to Accounting
1
Project Report: Introduction to Accounting
1
Project Report: Introduction to Accounting
Paraphrase This Document
Need a fresh take? Get an instant paraphrase of this document with our AI Paraphraser
Introduction to accounting
2
Contents
Introduction.......................................................................................................................3
CITADEL GROUP PLC..................................................................................................3
Analysis over Debt Valuation...........................................................................................3
Analysis over Share valuation..........................................................................................4
Analysis over Cost of capital............................................................................................6
Analysis over the market..................................................................................................7
Conclusion........................................................................................................................7
References.........................................................................................................................9
Appendix.........................................................................................................................11
Introduction to accounting
3
Introduction:
Australian market is enhancing rapidly. At the time of global financial crisis, the
economy condition of the country has become very bad and right now the performance of the
country is becoming better. The investors and the foreign direct investment of the comapny
are enhancing. Investors are looking for the comapny and the industry in which they could
invest their amount. In this report, CITADEL GROUP LTD has been analyzed. This
comapny has been analyzed to evaluate the financial performance of the comapny and the
position of the comapny in the industry.
CITADEL GROUP PLC:
CIITADEL GROUP PLC is an American global comapny. This comapny has been
established in 1990. The key founder of the comapny is Kenneth C., Griffin. Mainly, this
comapny operates its business into the investment industry. The main operations of the
company are asset management and the Citadel securities. This comapny has 1400 manpower
to manage the business. Currently the annual turnover of the company is US $149 billion.
The comapny has used various new techniques and technologies to manage the business and
enhance the level of the business (Home, 2017). The financial performance of the comapny
has been analyzed according to the debt valuation, share valuation, market analysis and the
cost of capital. The further study over the company’s operations is as follows:
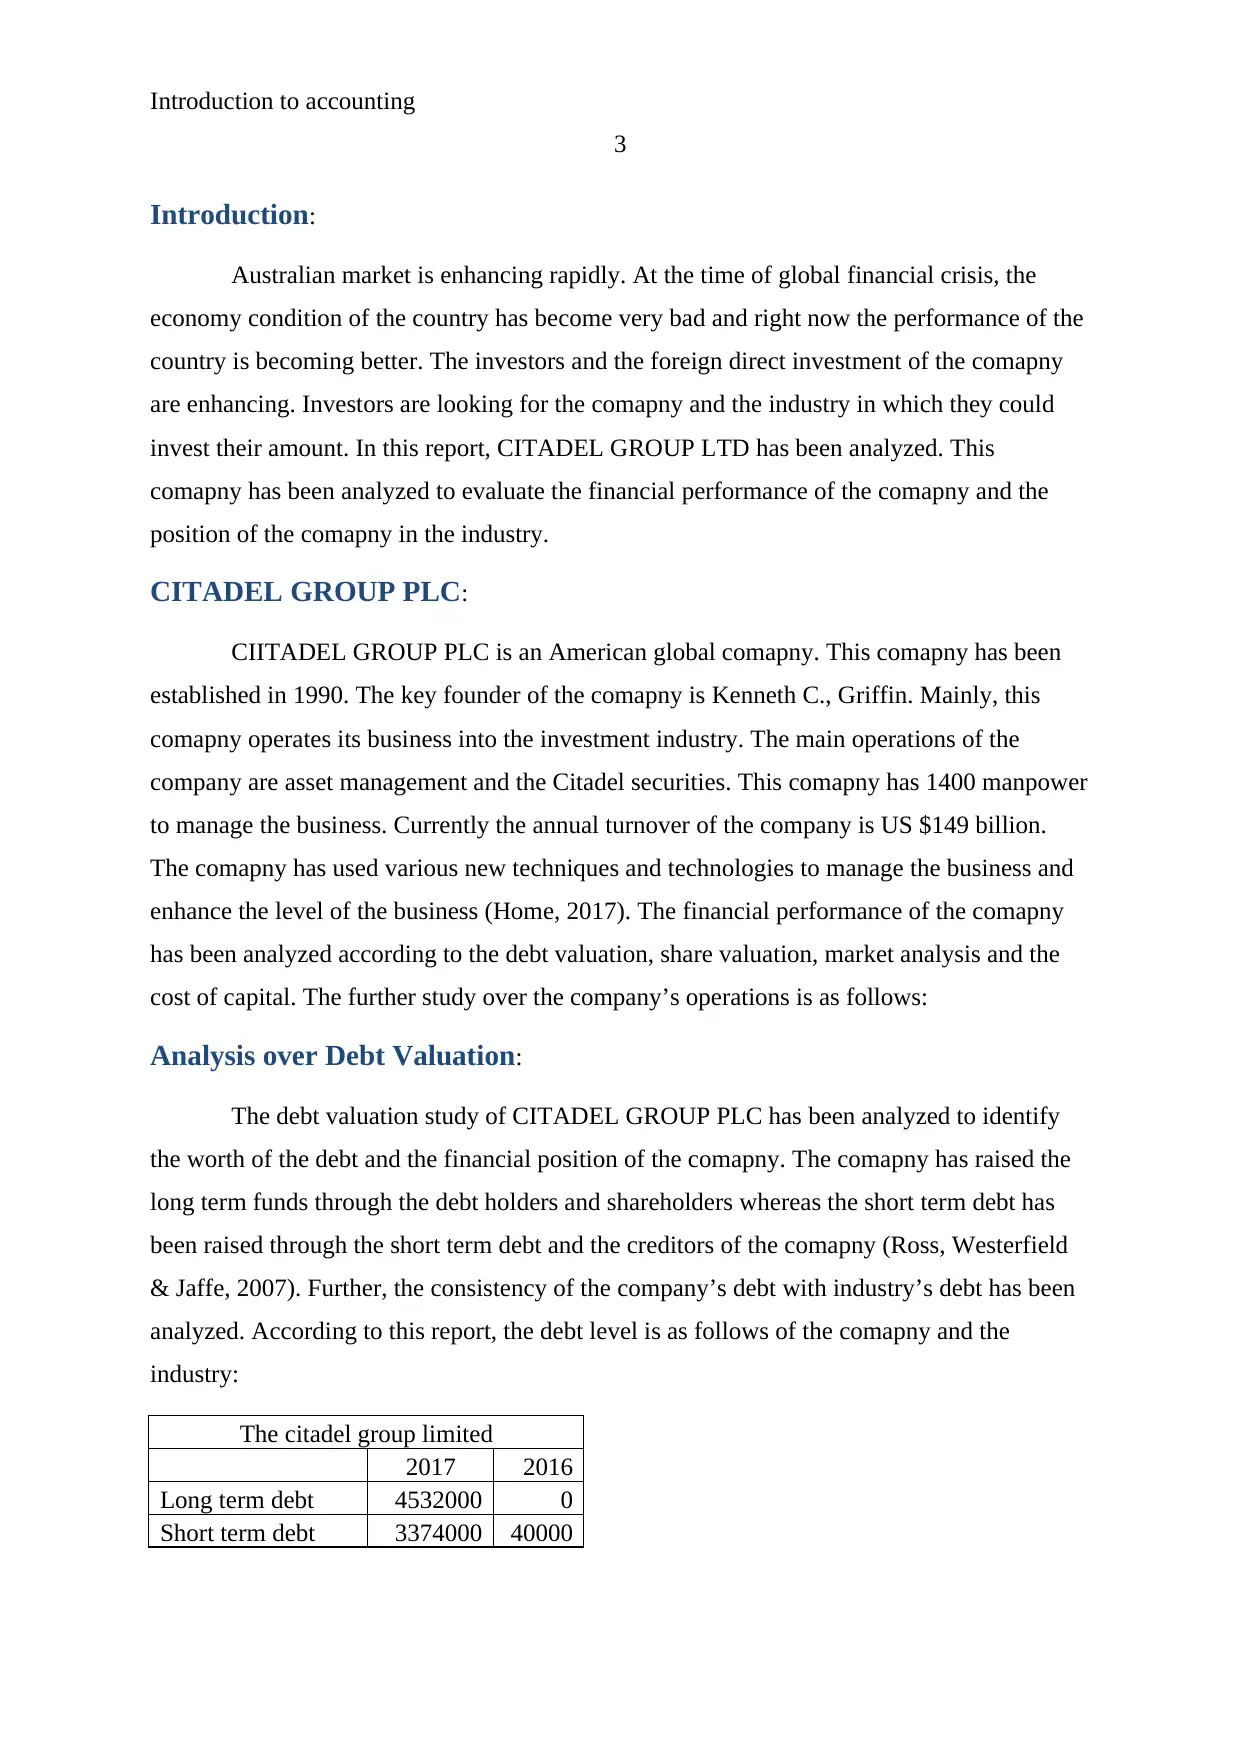
Analysis over Debt Valuation:
The debt valuation study of CITADEL GROUP PLC has been analyzed to identify
the worth of the debt and the financial position of the comapny. The comapny has raised the
long term funds through the debt holders and shareholders whereas the short term debt has
been raised through the short term debt and the creditors of the comapny (Ross, Westerfield
& Jaffe, 2007). Further, the consistency of the company’s debt with industry’s debt has been
analyzed. According to this report, the debt level is as follows of the comapny and the
industry:
The citadel group limited
2017 2016
Long term debt 4532000 0
Short term debt 3374000 40000
3
Introduction:
Australian market is enhancing rapidly. At the time of global financial crisis, the
economy condition of the country has become very bad and right now the performance of the
country is becoming better. The investors and the foreign direct investment of the comapny
are enhancing. Investors are looking for the comapny and the industry in which they could
invest their amount. In this report, CITADEL GROUP LTD has been analyzed. This
comapny has been analyzed to evaluate the financial performance of the comapny and the
position of the comapny in the industry.
CITADEL GROUP PLC:
CIITADEL GROUP PLC is an American global comapny. This comapny has been
established in 1990. The key founder of the comapny is Kenneth C., Griffin. Mainly, this
comapny operates its business into the investment industry. The main operations of the
company are asset management and the Citadel securities. This comapny has 1400 manpower
to manage the business. Currently the annual turnover of the company is US $149 billion.
The comapny has used various new techniques and technologies to manage the business and
enhance the level of the business (Home, 2017). The financial performance of the comapny
has been analyzed according to the debt valuation, share valuation, market analysis and the
cost of capital. The further study over the company’s operations is as follows:
Analysis over Debt Valuation:
The debt valuation study of CITADEL GROUP PLC has been analyzed to identify
the worth of the debt and the financial position of the comapny. The comapny has raised the
long term funds through the debt holders and shareholders whereas the short term debt has
been raised through the short term debt and the creditors of the comapny (Ross, Westerfield
& Jaffe, 2007). Further, the consistency of the company’s debt with industry’s debt has been
analyzed. According to this report, the debt level is as follows of the comapny and the
industry:
The citadel group limited
2017 2016
Long term debt 4532000 0
Short term debt 3374000 40000
⊘ This is a preview!⊘
Do you want full access?
Subscribe today to unlock all pages.
Trusted by 1+ million students worldwide
Introduction to accounting
4
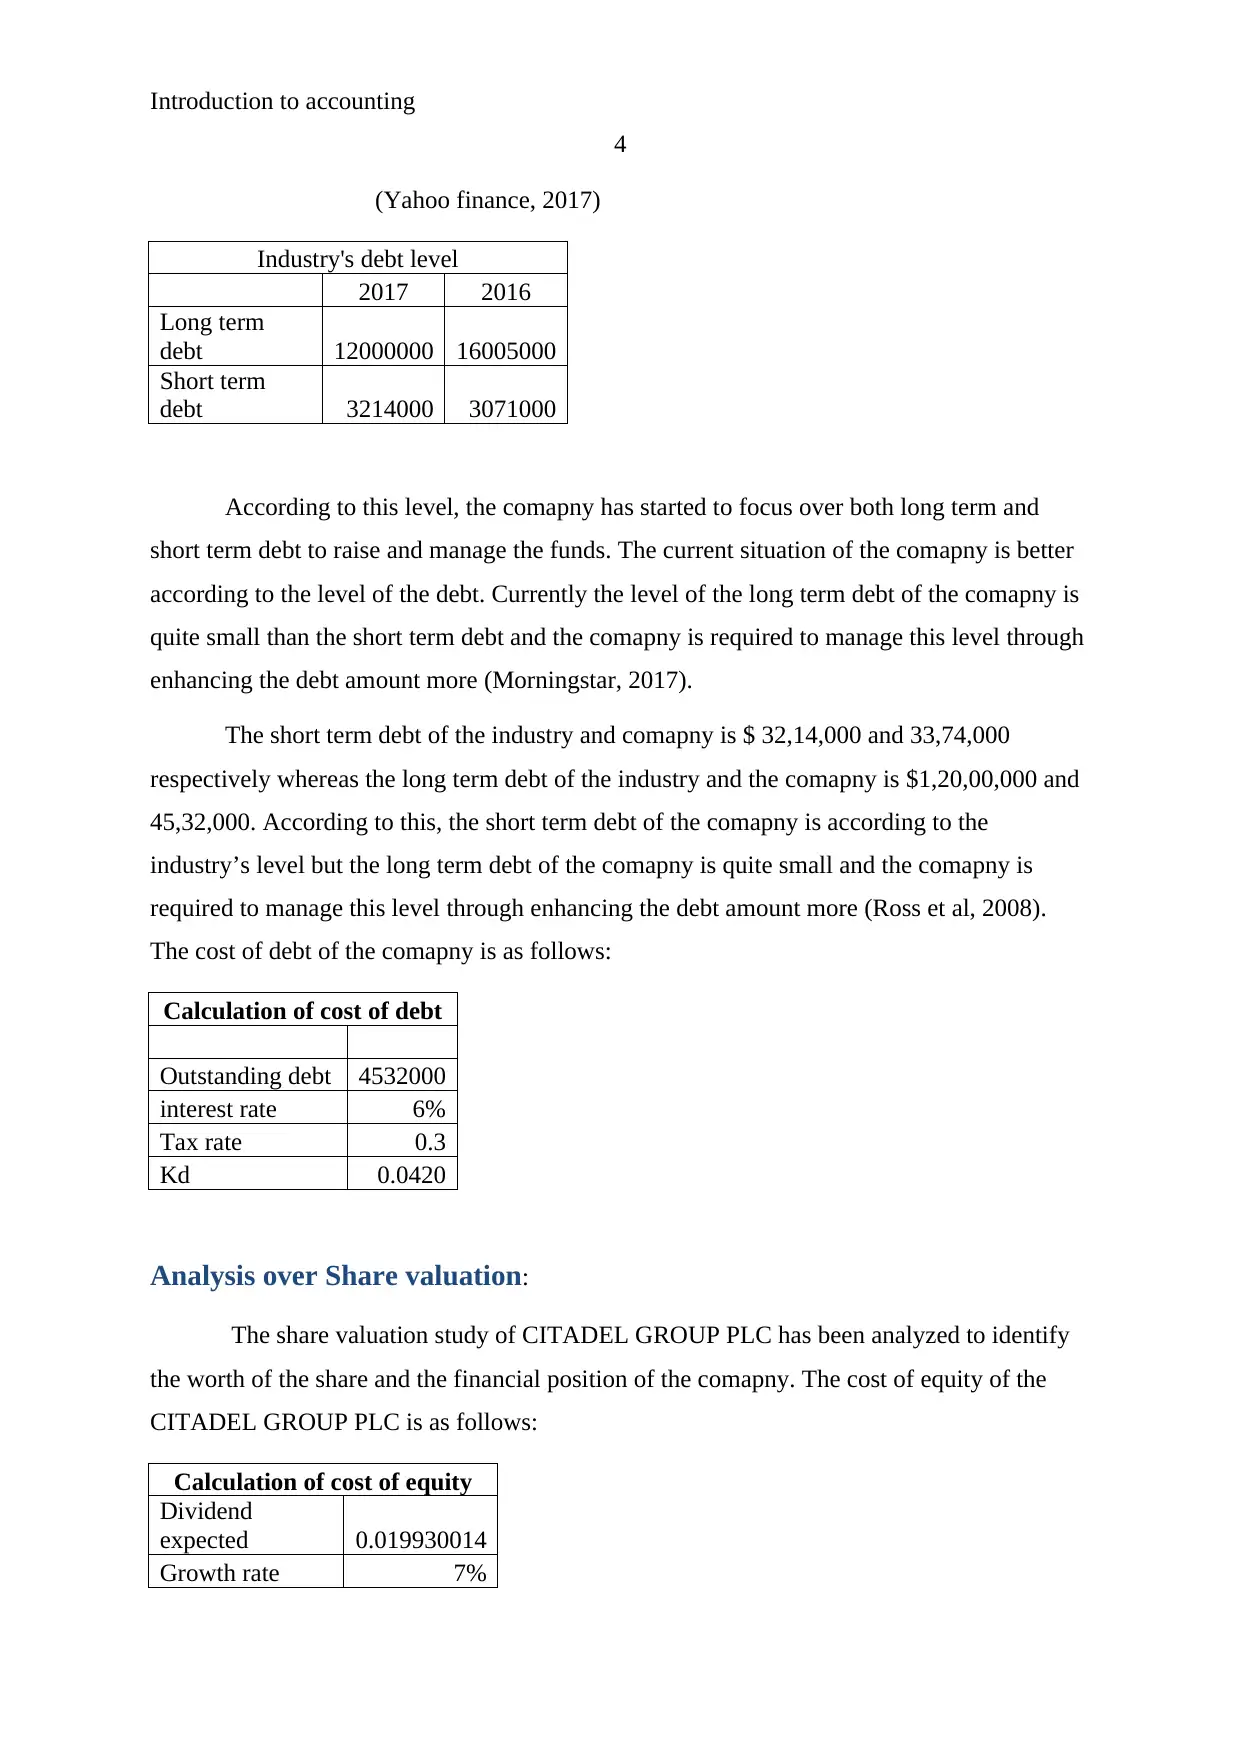
(Yahoo finance, 2017)
Industry's debt level
2017 2016
Long term
debt 12000000 16005000
Short term
debt 3214000 3071000
According to this level, the comapny has started to focus over both long term and
short term debt to raise and manage the funds. The current situation of the comapny is better
according to the level of the debt. Currently the level of the long term debt of the comapny is
quite small than the short term debt and the comapny is required to manage this level through
enhancing the debt amount more (Morningstar, 2017).
The short term debt of the industry and comapny is $ 32,14,000 and 33,74,000
respectively whereas the long term debt of the industry and the comapny is $1,20,00,000 and
45,32,000. According to this, the short term debt of the comapny is according to the
industry’s level but the long term debt of the comapny is quite small and the comapny is
required to manage this level through enhancing the debt amount more (Ross et al, 2008).
The cost of debt of the comapny is as follows:
Calculation of cost of debt
Outstanding debt 4532000
interest rate 6%
Tax rate 0.3
Kd 0.0420
Analysis over Share valuation:
The share valuation study of CITADEL GROUP PLC has been analyzed to identify
the worth of the share and the financial position of the comapny. The cost of equity of the
CITADEL GROUP PLC is as follows:
Calculation of cost of equity
Dividend
expected 0.019930014
Growth rate 7%
4
(Yahoo finance, 2017)
Industry's debt level
2017 2016
Long term
debt 12000000 16005000
Short term
debt 3214000 3071000
According to this level, the comapny has started to focus over both long term and
short term debt to raise and manage the funds. The current situation of the comapny is better
according to the level of the debt. Currently the level of the long term debt of the comapny is
quite small than the short term debt and the comapny is required to manage this level through
enhancing the debt amount more (Morningstar, 2017).
The short term debt of the industry and comapny is $ 32,14,000 and 33,74,000
respectively whereas the long term debt of the industry and the comapny is $1,20,00,000 and
45,32,000. According to this, the short term debt of the comapny is according to the
industry’s level but the long term debt of the comapny is quite small and the comapny is
required to manage this level through enhancing the debt amount more (Ross et al, 2008).
The cost of debt of the comapny is as follows:
Calculation of cost of debt
Outstanding debt 4532000
interest rate 6%
Tax rate 0.3
Kd 0.0420
Analysis over Share valuation:
The share valuation study of CITADEL GROUP PLC has been analyzed to identify
the worth of the share and the financial position of the comapny. The cost of equity of the
CITADEL GROUP PLC is as follows:
Calculation of cost of equity
Dividend
expected 0.019930014
Growth rate 7%
Paraphrase This Document
Need a fresh take? Get an instant paraphrase of this document with our AI Paraphraser
Introduction to accounting
5
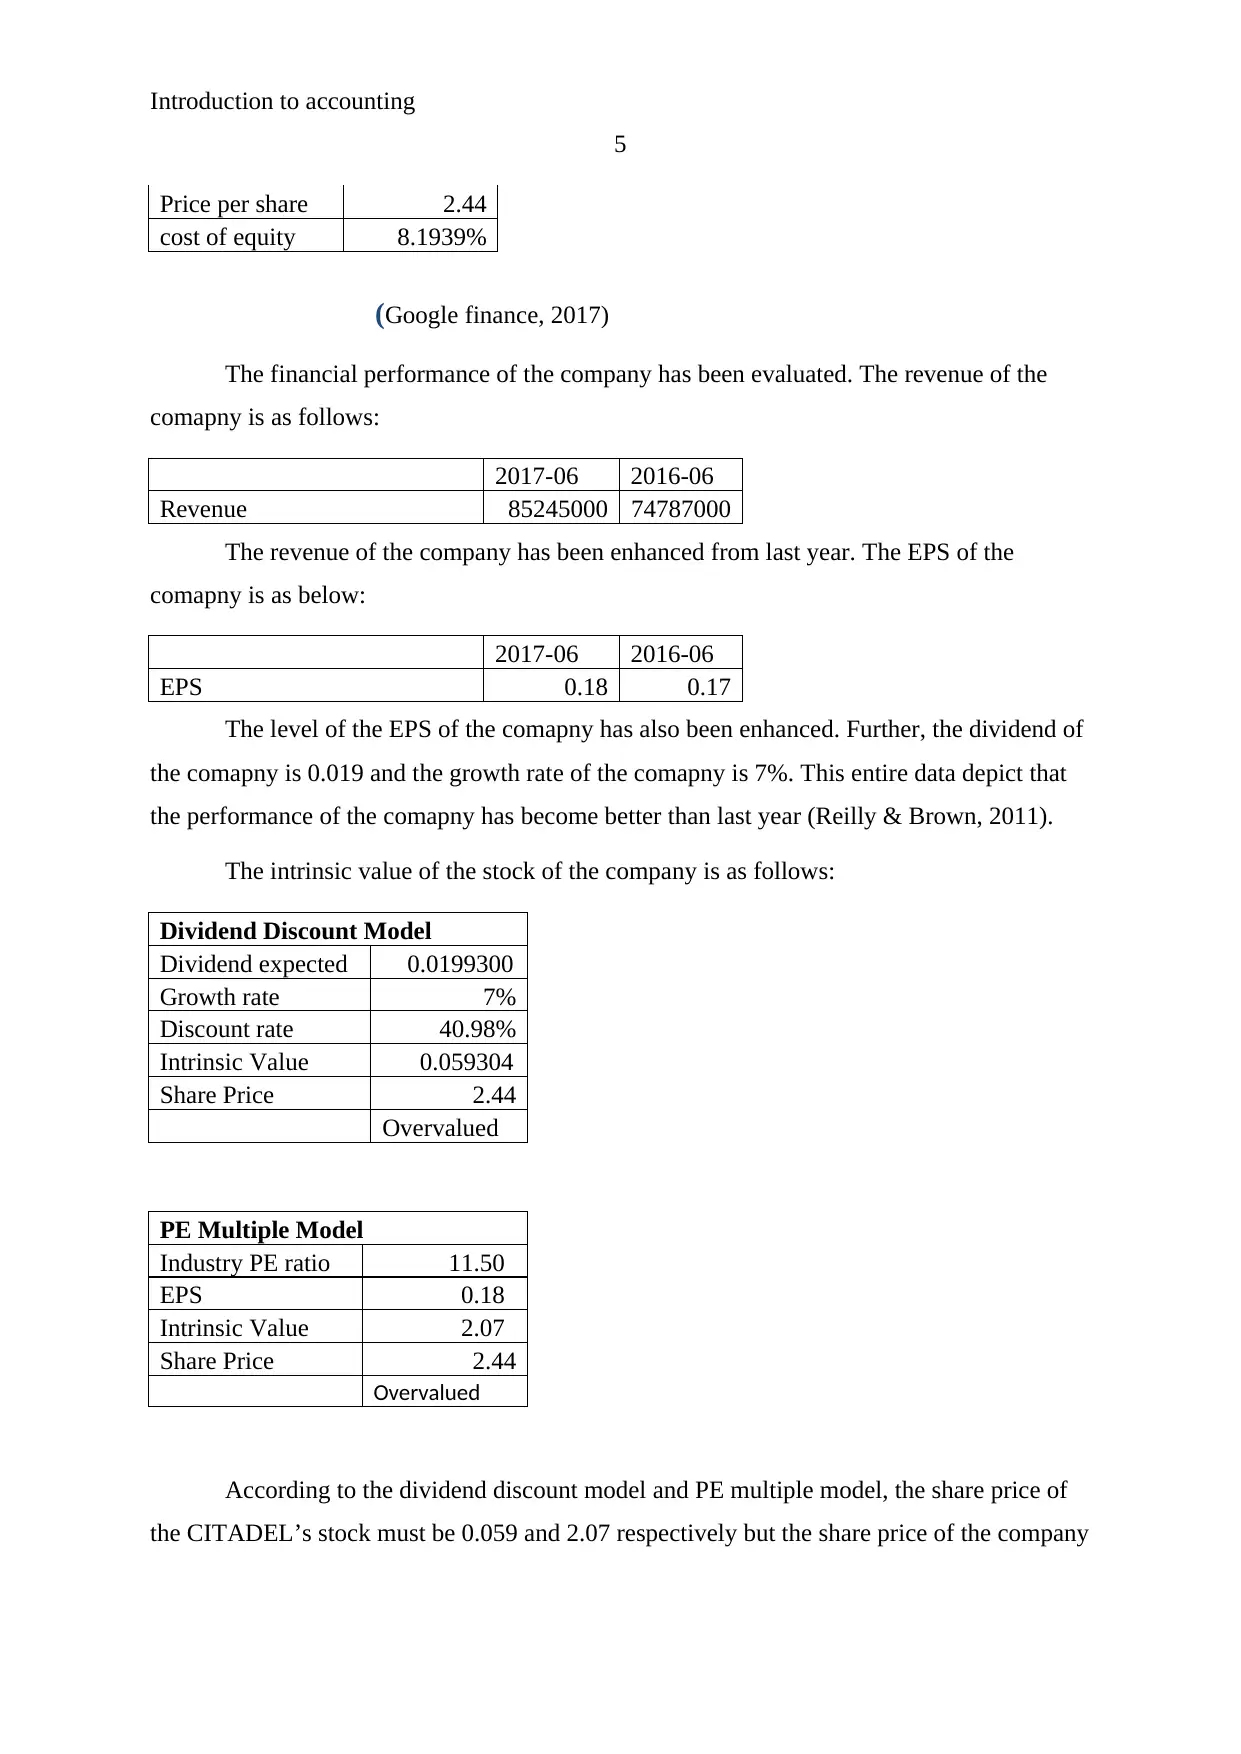
Price per share 2.44
cost of equity 8.1939%
(Google finance, 2017)
The financial performance of the company has been evaluated. The revenue of the
comapny is as follows:
2017-06 2016-06
Revenue 85245000 74787000
The revenue of the company has been enhanced from last year. The EPS of the
comapny is as below:
2017-06 2016-06
EPS 0.18 0.17
The level of the EPS of the comapny has also been enhanced. Further, the dividend of
the comapny is 0.019 and the growth rate of the comapny is 7%. This entire data depict that
the performance of the comapny has become better than last year (Reilly & Brown, 2011).
The intrinsic value of the stock of the company is as follows:
Dividend Discount Model
Dividend expected 0.0199300
Growth rate 7%
Discount rate 40.98%
Intrinsic Value 0.059304
Share Price 2.44
Overvalued
PE Multiple Model
Industry PE ratio 11.50
EPS 0.18
Intrinsic Value 2.07
Share Price 2.44
Overvalued
According to the dividend discount model and PE multiple model, the share price of
the CITADEL’s stock must be 0.059 and 2.07 respectively but the share price of the company
5
Price per share 2.44
cost of equity 8.1939%
(Google finance, 2017)
The financial performance of the company has been evaluated. The revenue of the
comapny is as follows:
2017-06 2016-06
Revenue 85245000 74787000
The revenue of the company has been enhanced from last year. The EPS of the
comapny is as below:
2017-06 2016-06
EPS 0.18 0.17
The level of the EPS of the comapny has also been enhanced. Further, the dividend of
the comapny is 0.019 and the growth rate of the comapny is 7%. This entire data depict that
the performance of the comapny has become better than last year (Reilly & Brown, 2011).
The intrinsic value of the stock of the company is as follows:
Dividend Discount Model
Dividend expected 0.0199300
Growth rate 7%
Discount rate 40.98%
Intrinsic Value 0.059304
Share Price 2.44
Overvalued
PE Multiple Model
Industry PE ratio 11.50
EPS 0.18
Intrinsic Value 2.07
Share Price 2.44
Overvalued
According to the dividend discount model and PE multiple model, the share price of
the CITADEL’s stock must be 0.059 and 2.07 respectively but the share price of the company
Introduction to accounting
6
is $ 2.44. According to these techniques, it has been found that both the methods take the help
of financial figures of the comapny to analyze the intrinsic value (Morningstar, 2017).
According to the evaluation, the PE model depict that the intrinsic value of the stock
of the company is 2.07, this method is more reliable as it takes the concern of reliable data
only and offer a result on the basis of that.
According to the analysis and investigation, a comapny always have various other
factors such as the activity, investments, project, technology, competitors, and supply and
demand of shares etc which directly affect the share price of the company. So while
evaluating the intrinsic value of any organization, analyst must take the consideration of
above described factors also (Moles Parrino & Kidwekk, 2011). It would offer a better result.
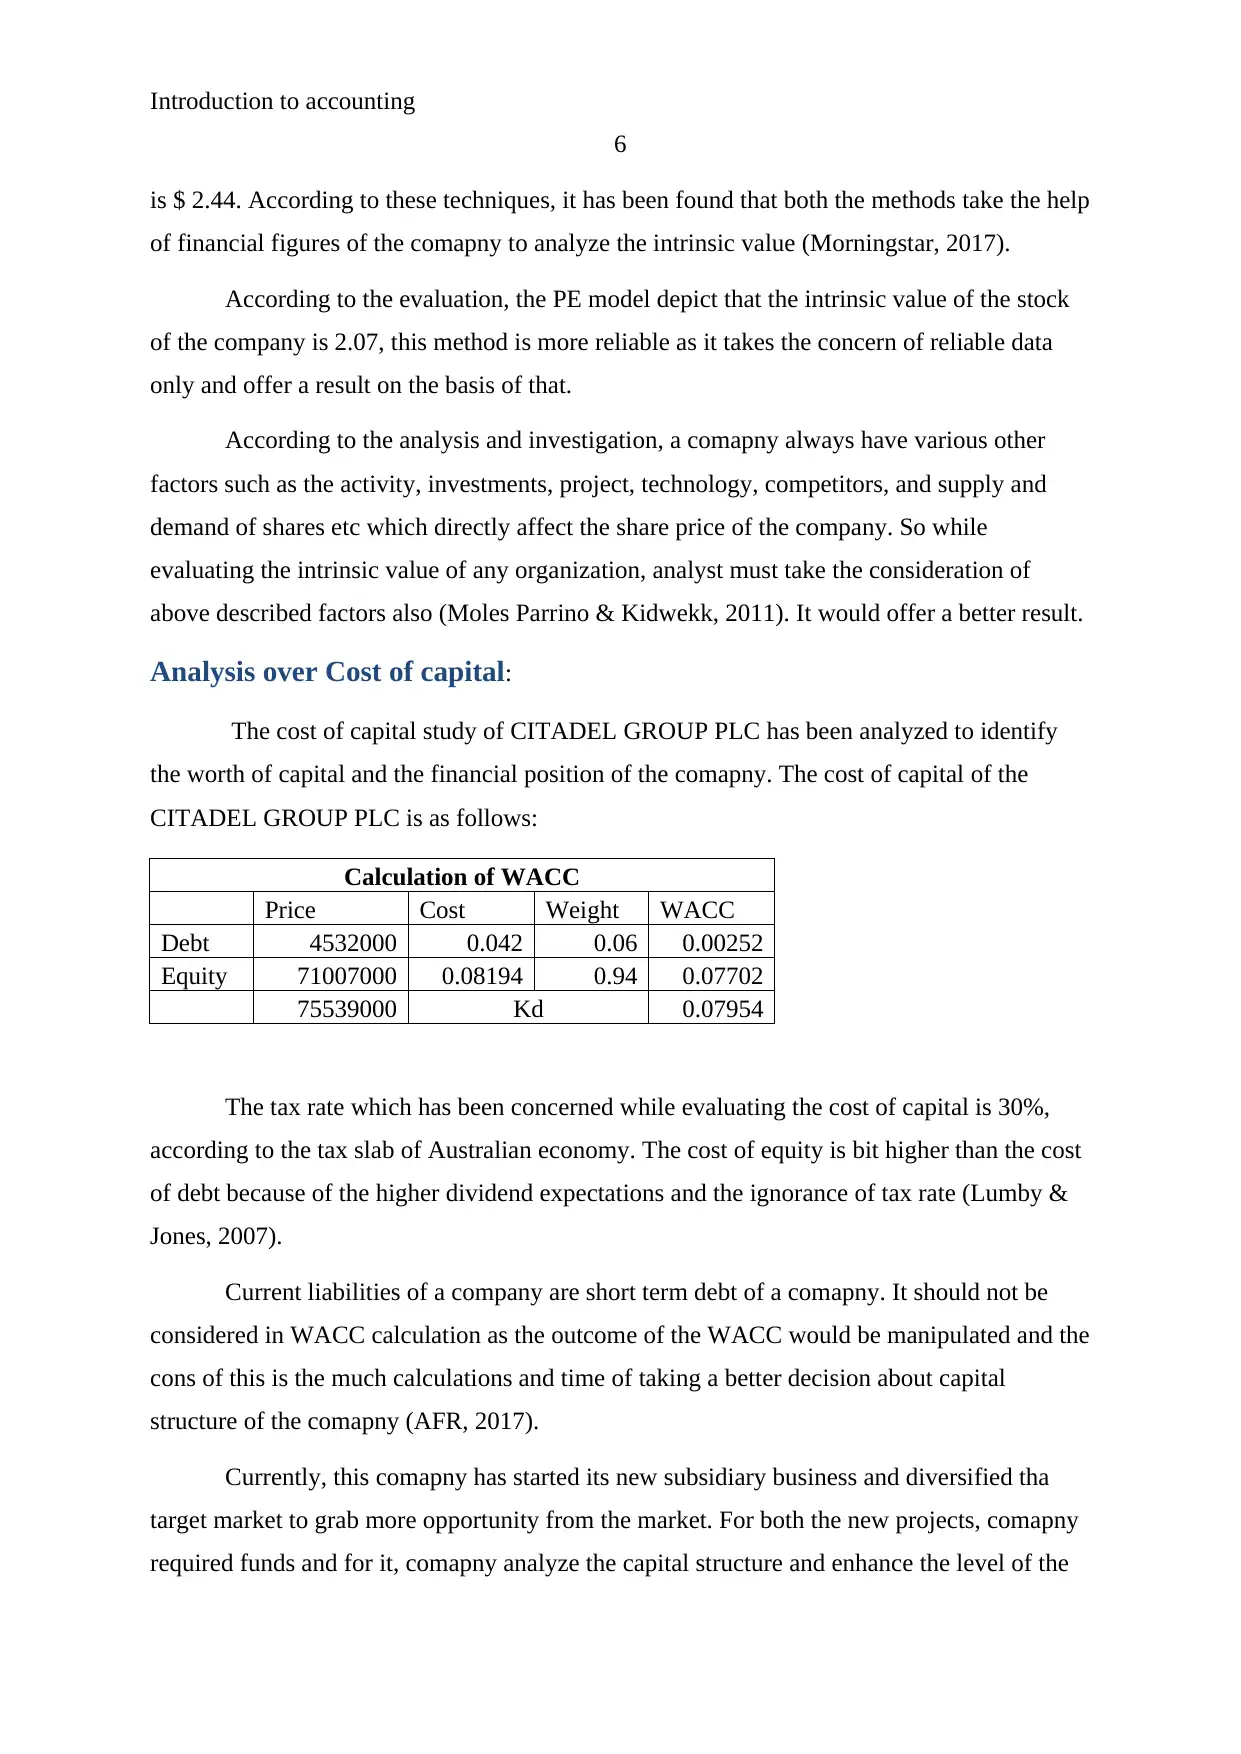
Analysis over Cost of capital:
The cost of capital study of CITADEL GROUP PLC has been analyzed to identify
the worth of capital and the financial position of the comapny. The cost of capital of the
CITADEL GROUP PLC is as follows:
Calculation of WACC
Price Cost Weight WACC
Debt 4532000 0.042 0.06 0.00252
Equity 71007000 0.08194 0.94 0.07702
75539000 Kd 0.07954
The tax rate which has been concerned while evaluating the cost of capital is 30%,
according to the tax slab of Australian economy. The cost of equity is bit higher than the cost
of debt because of the higher dividend expectations and the ignorance of tax rate (Lumby &
Jones, 2007).
Current liabilities of a company are short term debt of a comapny. It should not be
considered in WACC calculation as the outcome of the WACC would be manipulated and the
cons of this is the much calculations and time of taking a better decision about capital
structure of the comapny (AFR, 2017).
Currently, this comapny has started its new subsidiary business and diversified tha
target market to grab more opportunity from the market. For both the new projects, comapny
required funds and for it, comapny analyze the capital structure and enhance the level of the
6
is $ 2.44. According to these techniques, it has been found that both the methods take the help
of financial figures of the comapny to analyze the intrinsic value (Morningstar, 2017).
According to the evaluation, the PE model depict that the intrinsic value of the stock
of the company is 2.07, this method is more reliable as it takes the concern of reliable data
only and offer a result on the basis of that.
According to the analysis and investigation, a comapny always have various other
factors such as the activity, investments, project, technology, competitors, and supply and
demand of shares etc which directly affect the share price of the company. So while
evaluating the intrinsic value of any organization, analyst must take the consideration of
above described factors also (Moles Parrino & Kidwekk, 2011). It would offer a better result.
Analysis over Cost of capital:
The cost of capital study of CITADEL GROUP PLC has been analyzed to identify
the worth of capital and the financial position of the comapny. The cost of capital of the
CITADEL GROUP PLC is as follows:
Calculation of WACC
Price Cost Weight WACC
Debt 4532000 0.042 0.06 0.00252
Equity 71007000 0.08194 0.94 0.07702
75539000 Kd 0.07954
The tax rate which has been concerned while evaluating the cost of capital is 30%,
according to the tax slab of Australian economy. The cost of equity is bit higher than the cost
of debt because of the higher dividend expectations and the ignorance of tax rate (Lumby &
Jones, 2007).
Current liabilities of a company are short term debt of a comapny. It should not be
considered in WACC calculation as the outcome of the WACC would be manipulated and the
cons of this is the much calculations and time of taking a better decision about capital
structure of the comapny (AFR, 2017).
Currently, this comapny has started its new subsidiary business and diversified tha
target market to grab more opportunity from the market. For both the new projects, comapny
required funds and for it, comapny analyze the capital structure and enhance the level of the
⊘ This is a preview!⊘
Do you want full access?
Subscribe today to unlock all pages.
Trusted by 1+ million students worldwide
Introduction to accounting
7
equity rather than the debt to reduce the level of the risk. Currently the equity of the comapny
is quite higher than the cost of debt.
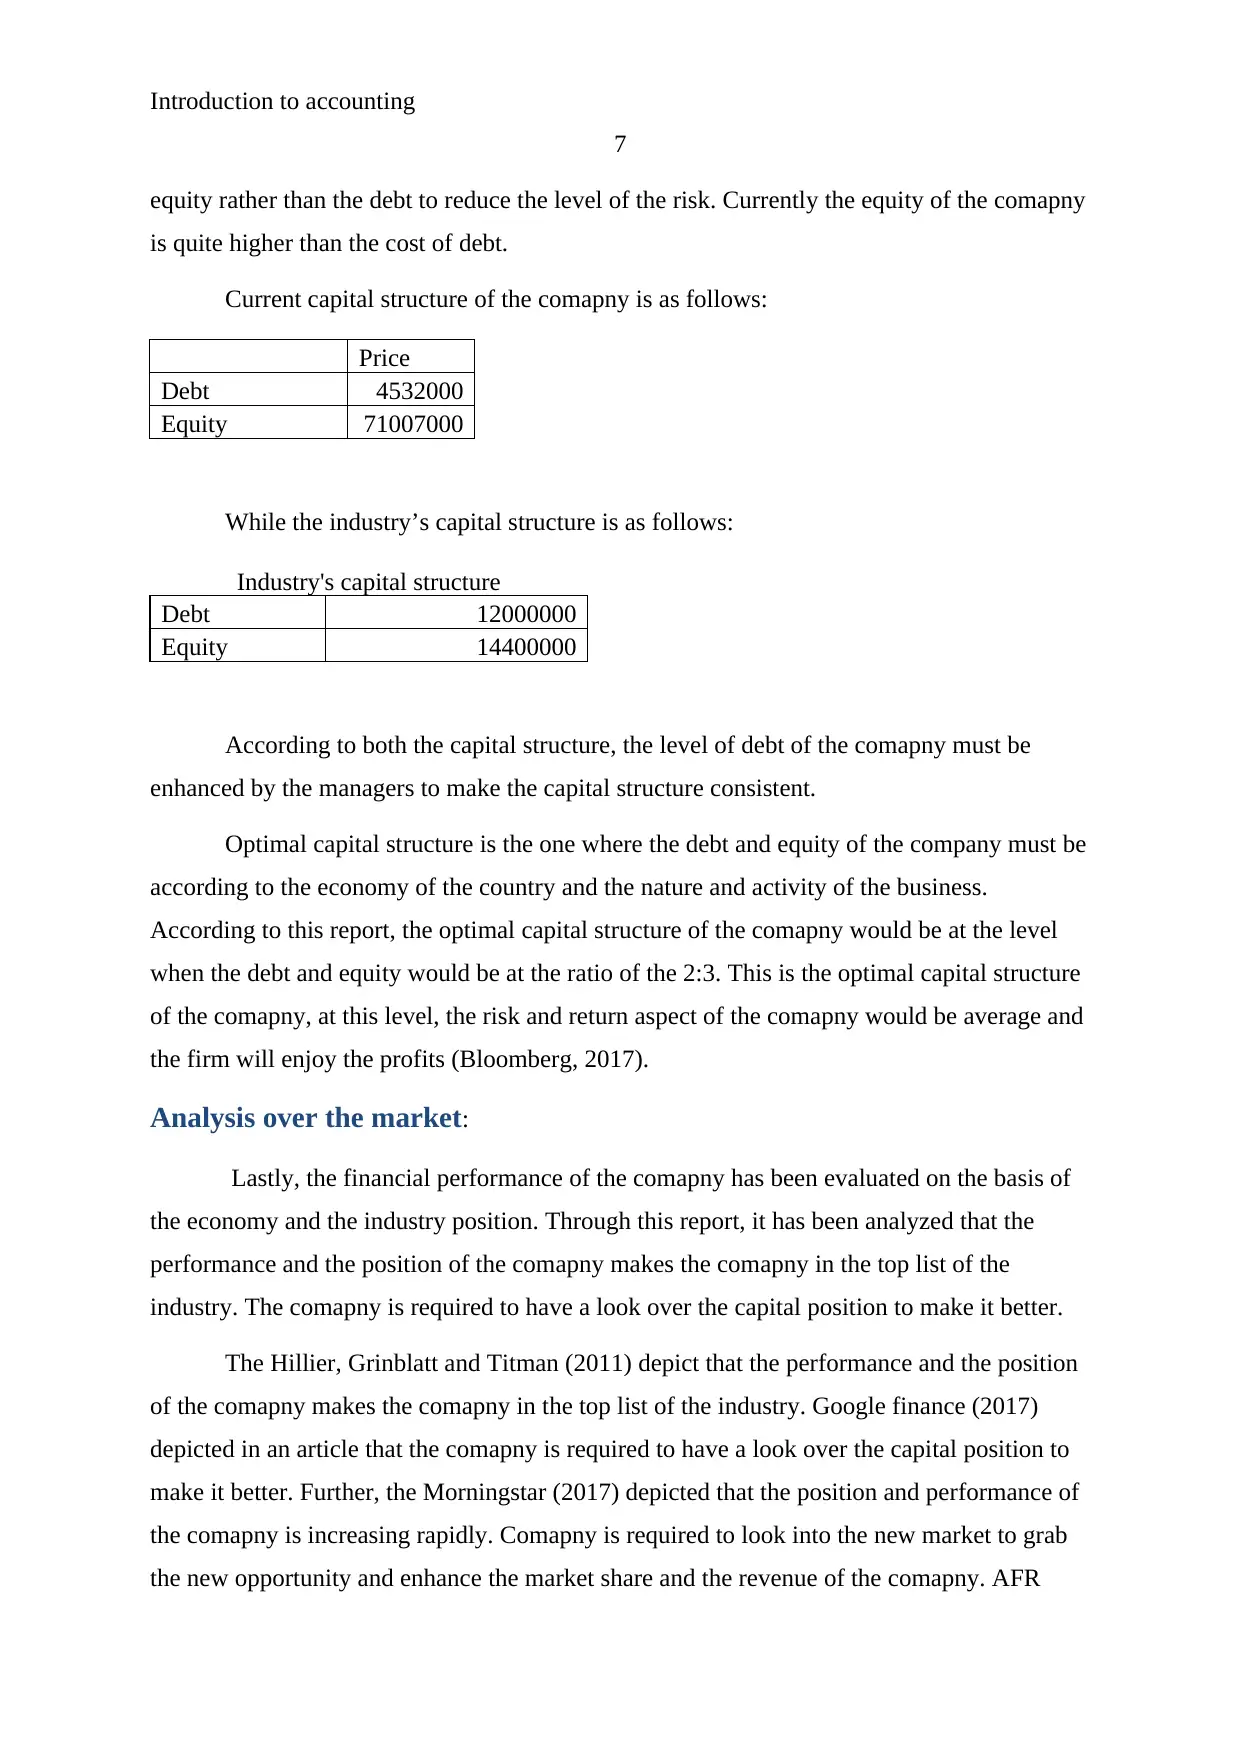
Current capital structure of the comapny is as follows:
Price
Debt 4532000
Equity 71007000
While the industry’s capital structure is as follows:
Industry's capital structure
Debt 12000000
Equity 14400000
According to both the capital structure, the level of debt of the comapny must be
enhanced by the managers to make the capital structure consistent.
Optimal capital structure is the one where the debt and equity of the company must be
according to the economy of the country and the nature and activity of the business.
According to this report, the optimal capital structure of the comapny would be at the level
when the debt and equity would be at the ratio of the 2:3. This is the optimal capital structure
of the comapny, at this level, the risk and return aspect of the comapny would be average and
the firm will enjoy the profits (Bloomberg, 2017).
Analysis over the market:
Lastly, the financial performance of the comapny has been evaluated on the basis of
the economy and the industry position. Through this report, it has been analyzed that the
performance and the position of the comapny makes the comapny in the top list of the
industry. The comapny is required to have a look over the capital position to make it better.
The Hillier, Grinblatt and Titman (2011) depict that the performance and the position
of the comapny makes the comapny in the top list of the industry. Google finance (2017)
depicted in an article that the comapny is required to have a look over the capital position to
make it better. Further, the Morningstar (2017) depicted that the position and performance of
the comapny is increasing rapidly. Comapny is required to look into the new market to grab
the new opportunity and enhance the market share and the revenue of the comapny. AFR
7
equity rather than the debt to reduce the level of the risk. Currently the equity of the comapny
is quite higher than the cost of debt.
Current capital structure of the comapny is as follows:
Price
Debt 4532000
Equity 71007000
While the industry’s capital structure is as follows:
Industry's capital structure
Debt 12000000
Equity 14400000
According to both the capital structure, the level of debt of the comapny must be
enhanced by the managers to make the capital structure consistent.
Optimal capital structure is the one where the debt and equity of the company must be
according to the economy of the country and the nature and activity of the business.
According to this report, the optimal capital structure of the comapny would be at the level
when the debt and equity would be at the ratio of the 2:3. This is the optimal capital structure
of the comapny, at this level, the risk and return aspect of the comapny would be average and
the firm will enjoy the profits (Bloomberg, 2017).
Analysis over the market:
Lastly, the financial performance of the comapny has been evaluated on the basis of
the economy and the industry position. Through this report, it has been analyzed that the
performance and the position of the comapny makes the comapny in the top list of the
industry. The comapny is required to have a look over the capital position to make it better.
The Hillier, Grinblatt and Titman (2011) depict that the performance and the position
of the comapny makes the comapny in the top list of the industry. Google finance (2017)
depicted in an article that the comapny is required to have a look over the capital position to
make it better. Further, the Morningstar (2017) depicted that the position and performance of
the comapny is increasing rapidly. Comapny is required to look into the new market to grab
the new opportunity and enhance the market share and the revenue of the comapny. AFR
Paraphrase This Document
Need a fresh take? Get an instant paraphrase of this document with our AI Paraphraser
Introduction to accounting
8
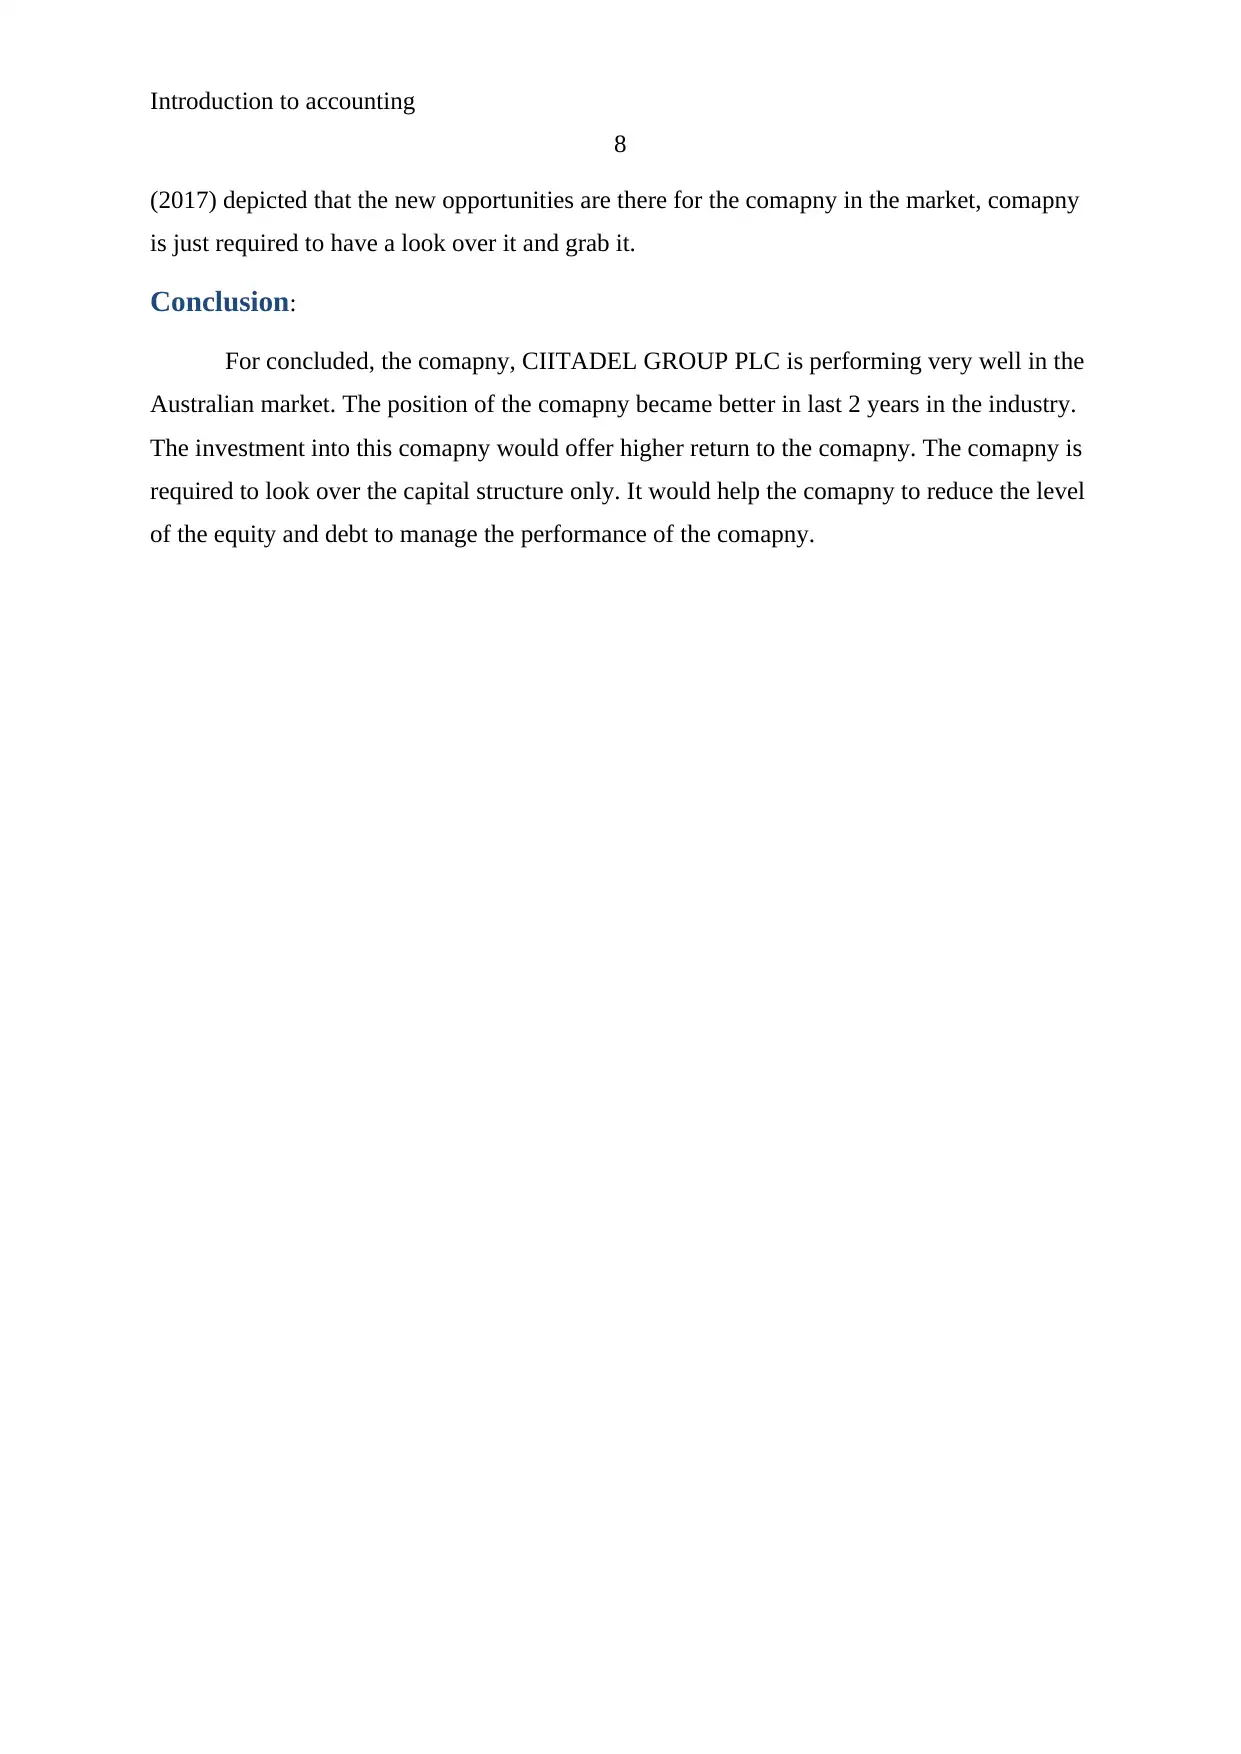
(2017) depicted that the new opportunities are there for the comapny in the market, comapny
is just required to have a look over it and grab it.
Conclusion:
For concluded, the comapny, CIITADEL GROUP PLC is performing very well in the
Australian market. The position of the comapny became better in last 2 years in the industry.
The investment into this comapny would offer higher return to the comapny. The comapny is
required to look over the capital structure only. It would help the comapny to reduce the level
of the equity and debt to manage the performance of the comapny.
8
(2017) depicted that the new opportunities are there for the comapny in the market, comapny
is just required to have a look over it and grab it.
Conclusion:
For concluded, the comapny, CIITADEL GROUP PLC is performing very well in the
Australian market. The position of the comapny became better in last 2 years in the industry.
The investment into this comapny would offer higher return to the comapny. The comapny is
required to look over the capital structure only. It would help the comapny to reduce the level
of the equity and debt to manage the performance of the comapny.
Introduction to accounting
9
References:
AFR. 2017. CITADEL GROUP PLC. Retrieved from
http://www.afr.com/research-tools/CGL/share-prices/shares-news available on 14th Oct
2017.
Bloomberg. 2017. CITADEL GROUP PLC. Retrieved from
https://www.bloomberg.com/quote/CGL:AU available on 14th Oct 2017.
Dixon, A.D. and Monk, A.H., 2009. The power of finance: accounting harmonization's effect
on pension provision. Journal of Economic Geography, 9(5), pp.619-639.
Glajnaric, M., 2016. The importance of dividend paying stocks. Equity, 30(2), p.6.
Google finance. 2017. CITADEL GROUP PLC. Retrieved from
http://finance.google.com/finance?q=ASX:CGL available on 14th Oct 2017.
Hillier, D., Grinblatt, M. and Titman, S., 2011. Financial markets and corporate strategy.
McGraw Hill.
Home. 2017. CITADEL GROUP PLC. Retrieved from http://www.citadelgroup.com.au/
available on 14th Oct 2017.
Lumby,S & Jones,C,.2007, Corporate finance theory & practice, 7th edition, Thomson,
London
Moles, P. Parrino, R & Kidwekk, D,.2011, Corporate finance, European edition, John Wiley
&sons, United Kingdom
Morningstar. 2017. CITADEL GROUP PLC. Reterived from
http://financials.morningstar.com/company-profile/c.action?t=CGL®ion=usa&culture=en-
US available on 14th Oct 2017.
⊘ This is a preview!⊘
Do you want full access?
Subscribe today to unlock all pages.
Trusted by 1+ million students worldwide
Introduction to accounting
10
Reilly.F.K & Brown.K.C,.2011,Investment analysis & portfolio management,10th edition,
South western Cengage learning, India
Ross, A,. Westerfield, R,W,. Jaffe,J,.& Kakani,R,K,.2008, Corporate Finance, 8th edition,
Tata McGraw hill education private limited, New Delhi, India
Ross, S, A,. Westerfield, R, W,. & Jaffe, J,.2007, Corporate Finance, the McGraw-hill, India
Yahoo finance. 2017. CITADEL GROUP PLC. Retrieved from
https://finance.yahoo.com/quote/cgl.ax?ltr=1 available on 14th Oct 2017.
Paraphrase This Document
Need a fresh take? Get an instant paraphrase of this document with our AI Paraphraser
Introduction to accounting
11
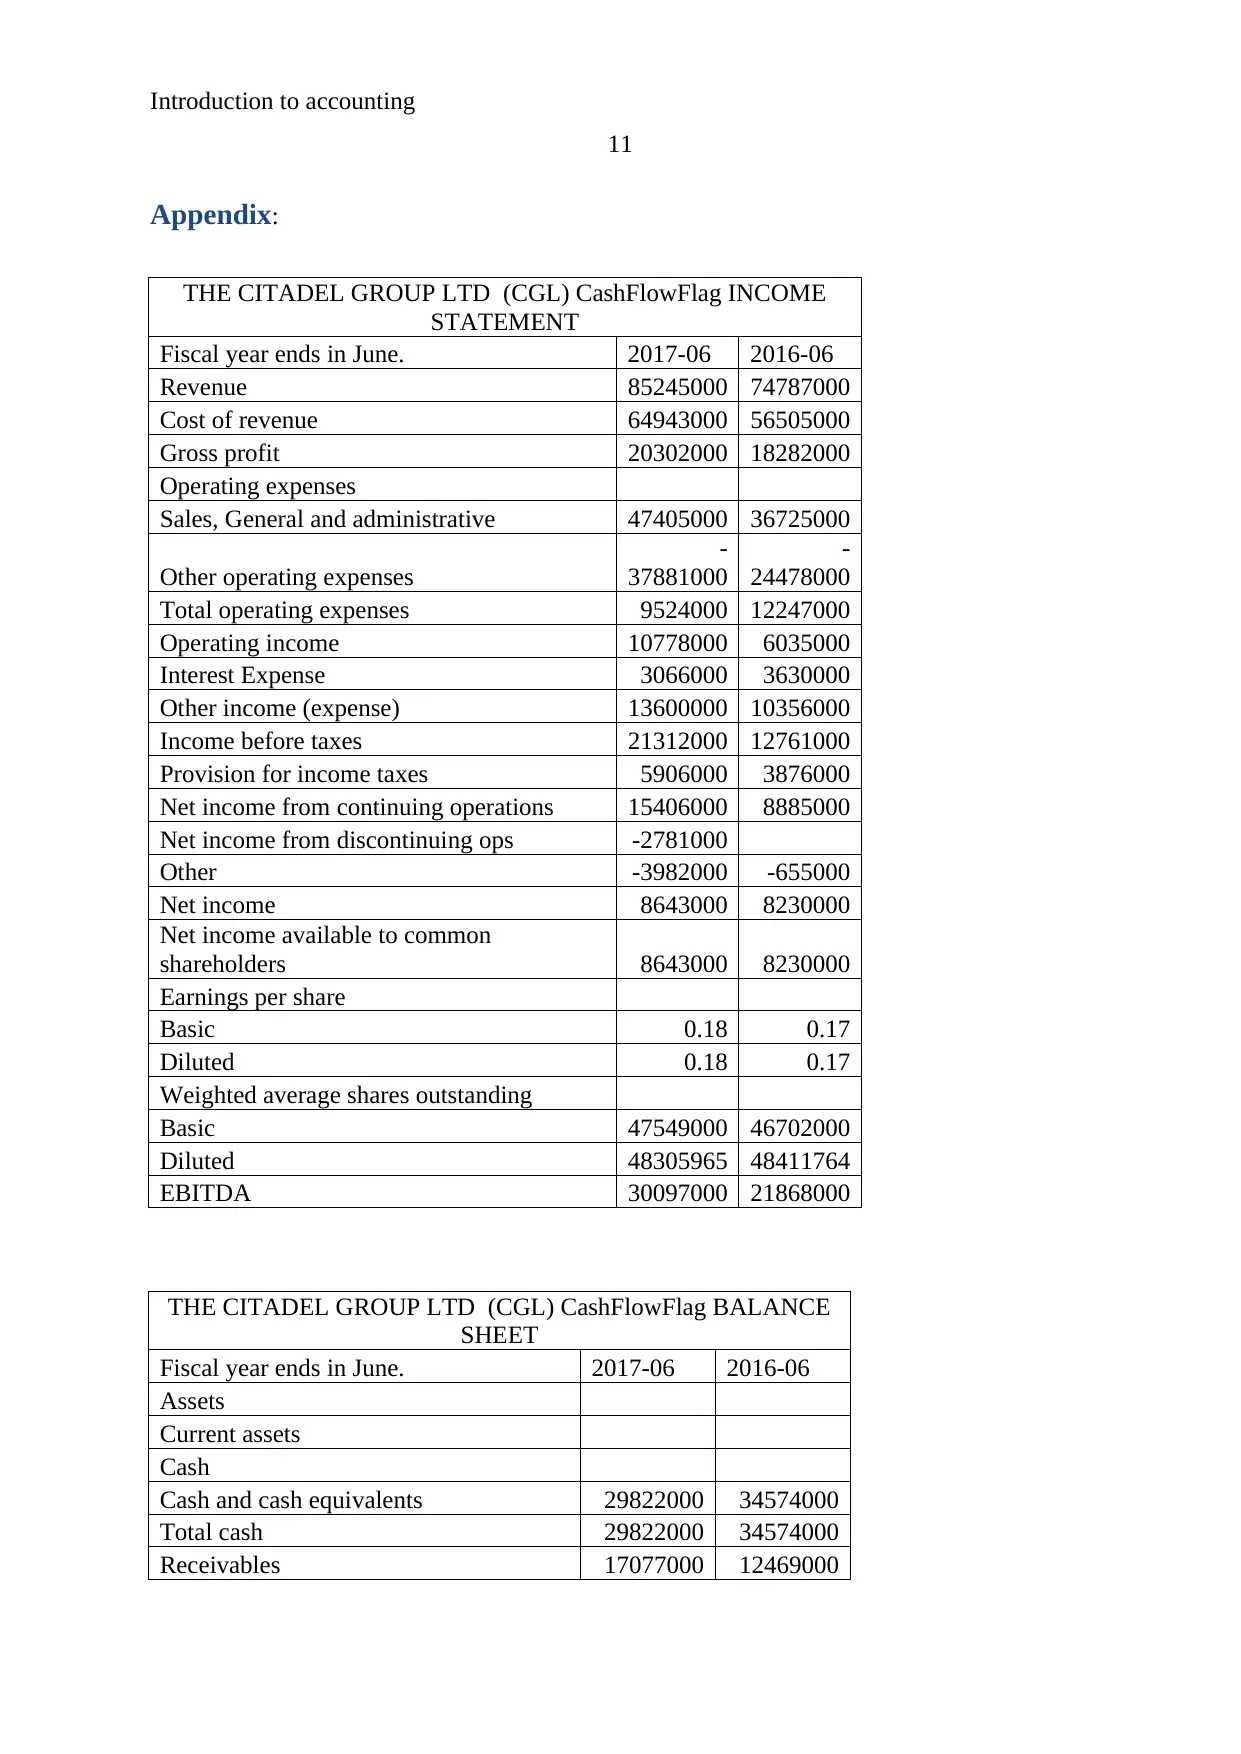
Appendix:
THE CITADEL GROUP LTD (CGL) CashFlowFlag INCOME
STATEMENT
Fiscal year ends in June. 2017-06 2016-06
Revenue 85245000 74787000
Cost of revenue 64943000 56505000
Gross profit 20302000 18282000
Operating expenses
Sales, General and administrative 47405000 36725000
Other operating expenses
-
37881000
-
24478000
Total operating expenses 9524000 12247000
Operating income 10778000 6035000
Interest Expense 3066000 3630000
Other income (expense) 13600000 10356000
Income before taxes 21312000 12761000
Provision for income taxes 5906000 3876000
Net income from continuing operations 15406000 8885000
Net income from discontinuing ops -2781000
Other -3982000 -655000
Net income 8643000 8230000
Net income available to common
shareholders 8643000 8230000
Earnings per share
Basic 0.18 0.17
Diluted 0.18 0.17
Weighted average shares outstanding
Basic 47549000 46702000
Diluted 48305965 48411764
EBITDA 30097000 21868000
THE CITADEL GROUP LTD (CGL) CashFlowFlag BALANCE
SHEET
Fiscal year ends in June. 2017-06 2016-06
Assets
Current assets
Cash
Cash and cash equivalents 29822000 34574000
Total cash 29822000 34574000
Receivables 17077000 12469000
11
Appendix:
THE CITADEL GROUP LTD (CGL) CashFlowFlag INCOME
STATEMENT
Fiscal year ends in June. 2017-06 2016-06
Revenue 85245000 74787000
Cost of revenue 64943000 56505000
Gross profit 20302000 18282000
Operating expenses
Sales, General and administrative 47405000 36725000
Other operating expenses
-
37881000
-
24478000
Total operating expenses 9524000 12247000
Operating income 10778000 6035000
Interest Expense 3066000 3630000
Other income (expense) 13600000 10356000
Income before taxes 21312000 12761000
Provision for income taxes 5906000 3876000
Net income from continuing operations 15406000 8885000
Net income from discontinuing ops -2781000
Other -3982000 -655000
Net income 8643000 8230000
Net income available to common
shareholders 8643000 8230000
Earnings per share
Basic 0.18 0.17
Diluted 0.18 0.17
Weighted average shares outstanding
Basic 47549000 46702000
Diluted 48305965 48411764
EBITDA 30097000 21868000
THE CITADEL GROUP LTD (CGL) CashFlowFlag BALANCE
SHEET
Fiscal year ends in June. 2017-06 2016-06
Assets
Current assets
Cash
Cash and cash equivalents 29822000 34574000
Total cash 29822000 34574000
Receivables 17077000 12469000
Introduction to accounting
12
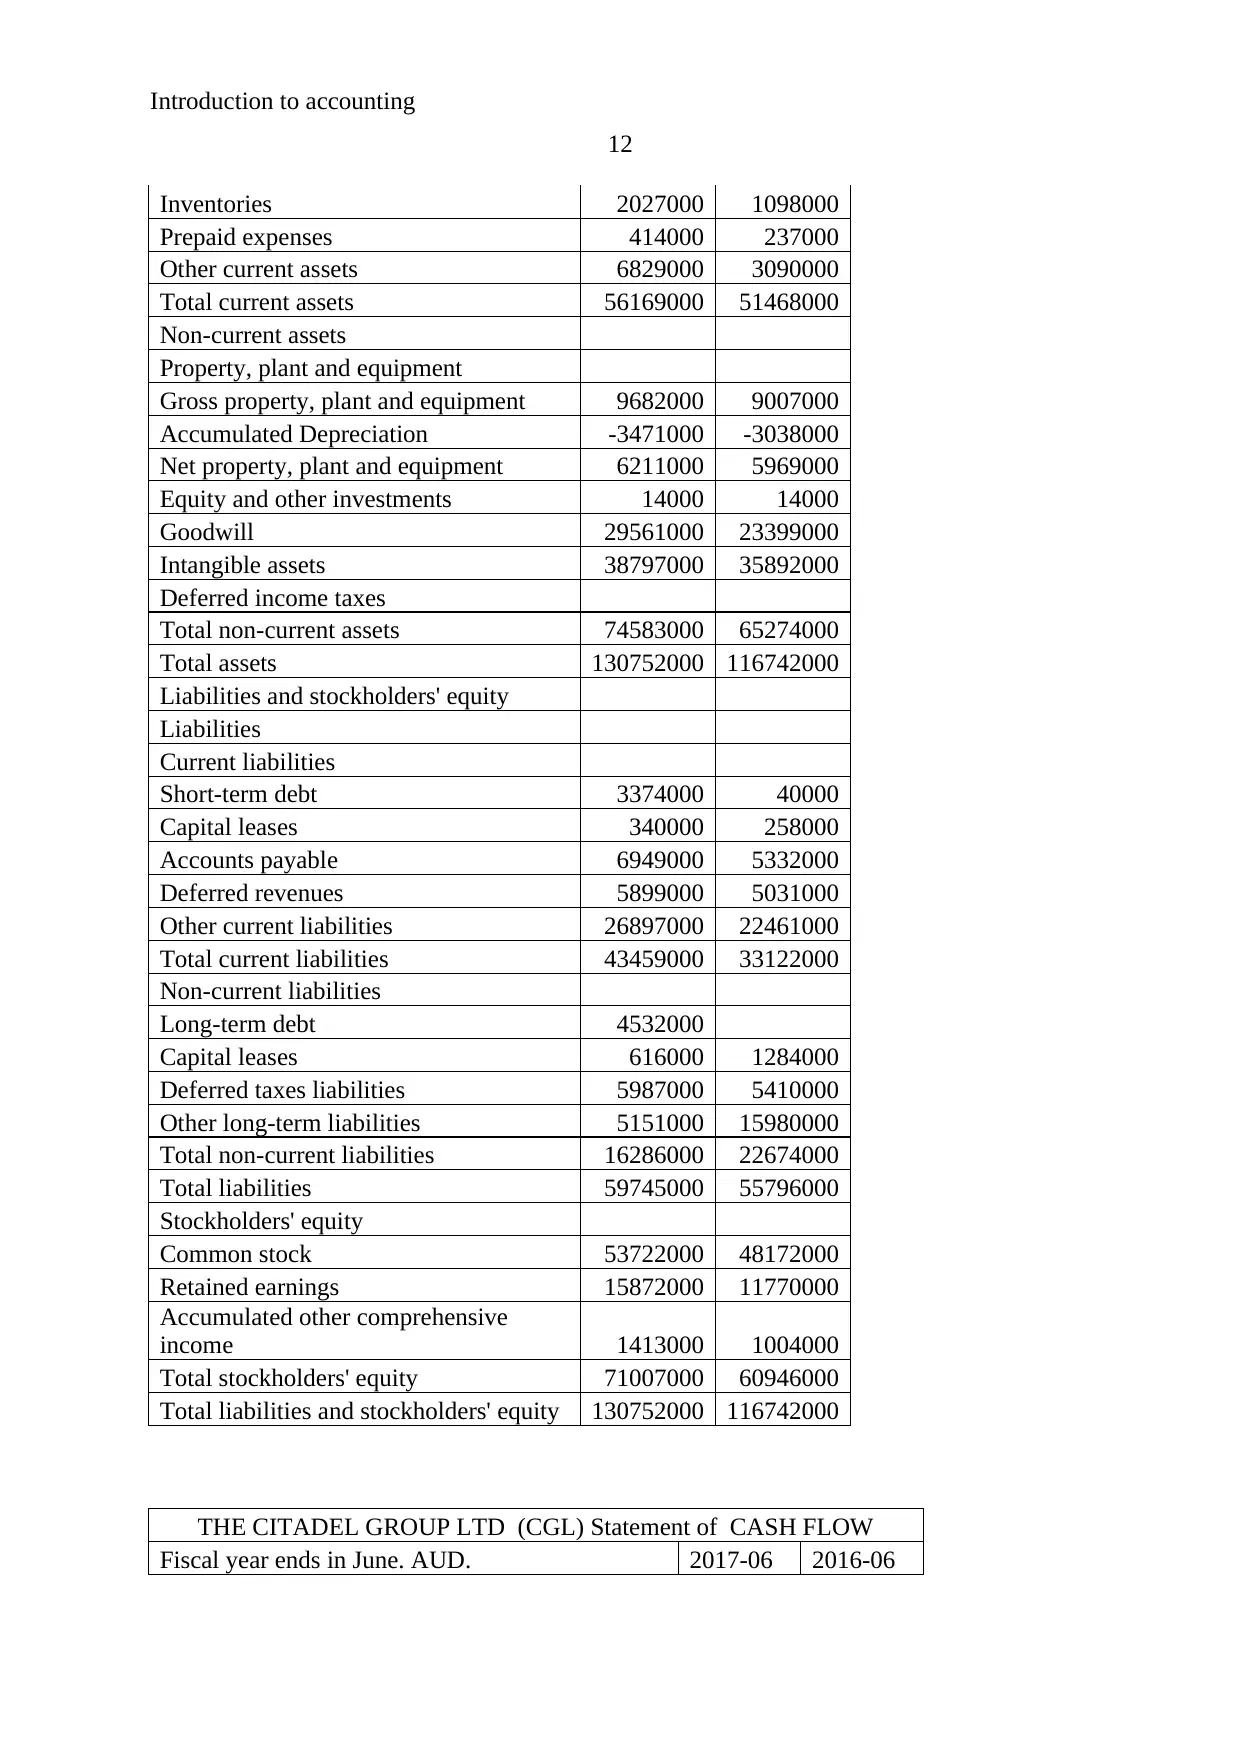
Inventories 2027000 1098000
Prepaid expenses 414000 237000
Other current assets 6829000 3090000
Total current assets 56169000 51468000
Non-current assets
Property, plant and equipment
Gross property, plant and equipment 9682000 9007000
Accumulated Depreciation -3471000 -3038000
Net property, plant and equipment 6211000 5969000
Equity and other investments 14000 14000
Goodwill 29561000 23399000
Intangible assets 38797000 35892000
Deferred income taxes
Total non-current assets 74583000 65274000
Total assets 130752000 116742000
Liabilities and stockholders' equity
Liabilities
Current liabilities
Short-term debt 3374000 40000
Capital leases 340000 258000
Accounts payable 6949000 5332000
Deferred revenues 5899000 5031000
Other current liabilities 26897000 22461000
Total current liabilities 43459000 33122000
Non-current liabilities
Long-term debt 4532000
Capital leases 616000 1284000
Deferred taxes liabilities 5987000 5410000
Other long-term liabilities 5151000 15980000
Total non-current liabilities 16286000 22674000
Total liabilities 59745000 55796000
Stockholders' equity
Common stock 53722000 48172000
Retained earnings 15872000 11770000
Accumulated other comprehensive
income 1413000 1004000
Total stockholders' equity 71007000 60946000
Total liabilities and stockholders' equity 130752000 116742000
THE CITADEL GROUP LTD (CGL) Statement of CASH FLOW
Fiscal year ends in June. AUD. 2017-06 2016-06
12
Inventories 2027000 1098000
Prepaid expenses 414000 237000
Other current assets 6829000 3090000
Total current assets 56169000 51468000
Non-current assets
Property, plant and equipment
Gross property, plant and equipment 9682000 9007000
Accumulated Depreciation -3471000 -3038000
Net property, plant and equipment 6211000 5969000
Equity and other investments 14000 14000
Goodwill 29561000 23399000
Intangible assets 38797000 35892000
Deferred income taxes
Total non-current assets 74583000 65274000
Total assets 130752000 116742000
Liabilities and stockholders' equity
Liabilities
Current liabilities
Short-term debt 3374000 40000
Capital leases 340000 258000
Accounts payable 6949000 5332000
Deferred revenues 5899000 5031000
Other current liabilities 26897000 22461000
Total current liabilities 43459000 33122000
Non-current liabilities
Long-term debt 4532000
Capital leases 616000 1284000
Deferred taxes liabilities 5987000 5410000
Other long-term liabilities 5151000 15980000
Total non-current liabilities 16286000 22674000
Total liabilities 59745000 55796000
Stockholders' equity
Common stock 53722000 48172000
Retained earnings 15872000 11770000
Accumulated other comprehensive
income 1413000 1004000
Total stockholders' equity 71007000 60946000
Total liabilities and stockholders' equity 130752000 116742000
THE CITADEL GROUP LTD (CGL) Statement of CASH FLOW
Fiscal year ends in June. AUD. 2017-06 2016-06
⊘ This is a preview!⊘
Do you want full access?
Subscribe today to unlock all pages.
Trusted by 1+ million students worldwide
1 out of 15
Related Documents


Your All-in-One AI-Powered Toolkit for Academic Success.
+13062052269
info@desklib.com
Available 24*7 on WhatsApp / Email
![[object Object]](/_next/static/media/star-bottom.7253800d.svg)
Unlock your academic potential
Copyright © 2020–2026 A2Z Services. All Rights Reserved. Developed and managed by ZUCOL.