Financial Analysis of Coca-Cola: Performance and Competitor Comparison

Verified

Added on  2022/08/08

|21
|3423
|17
Report
AI Summary
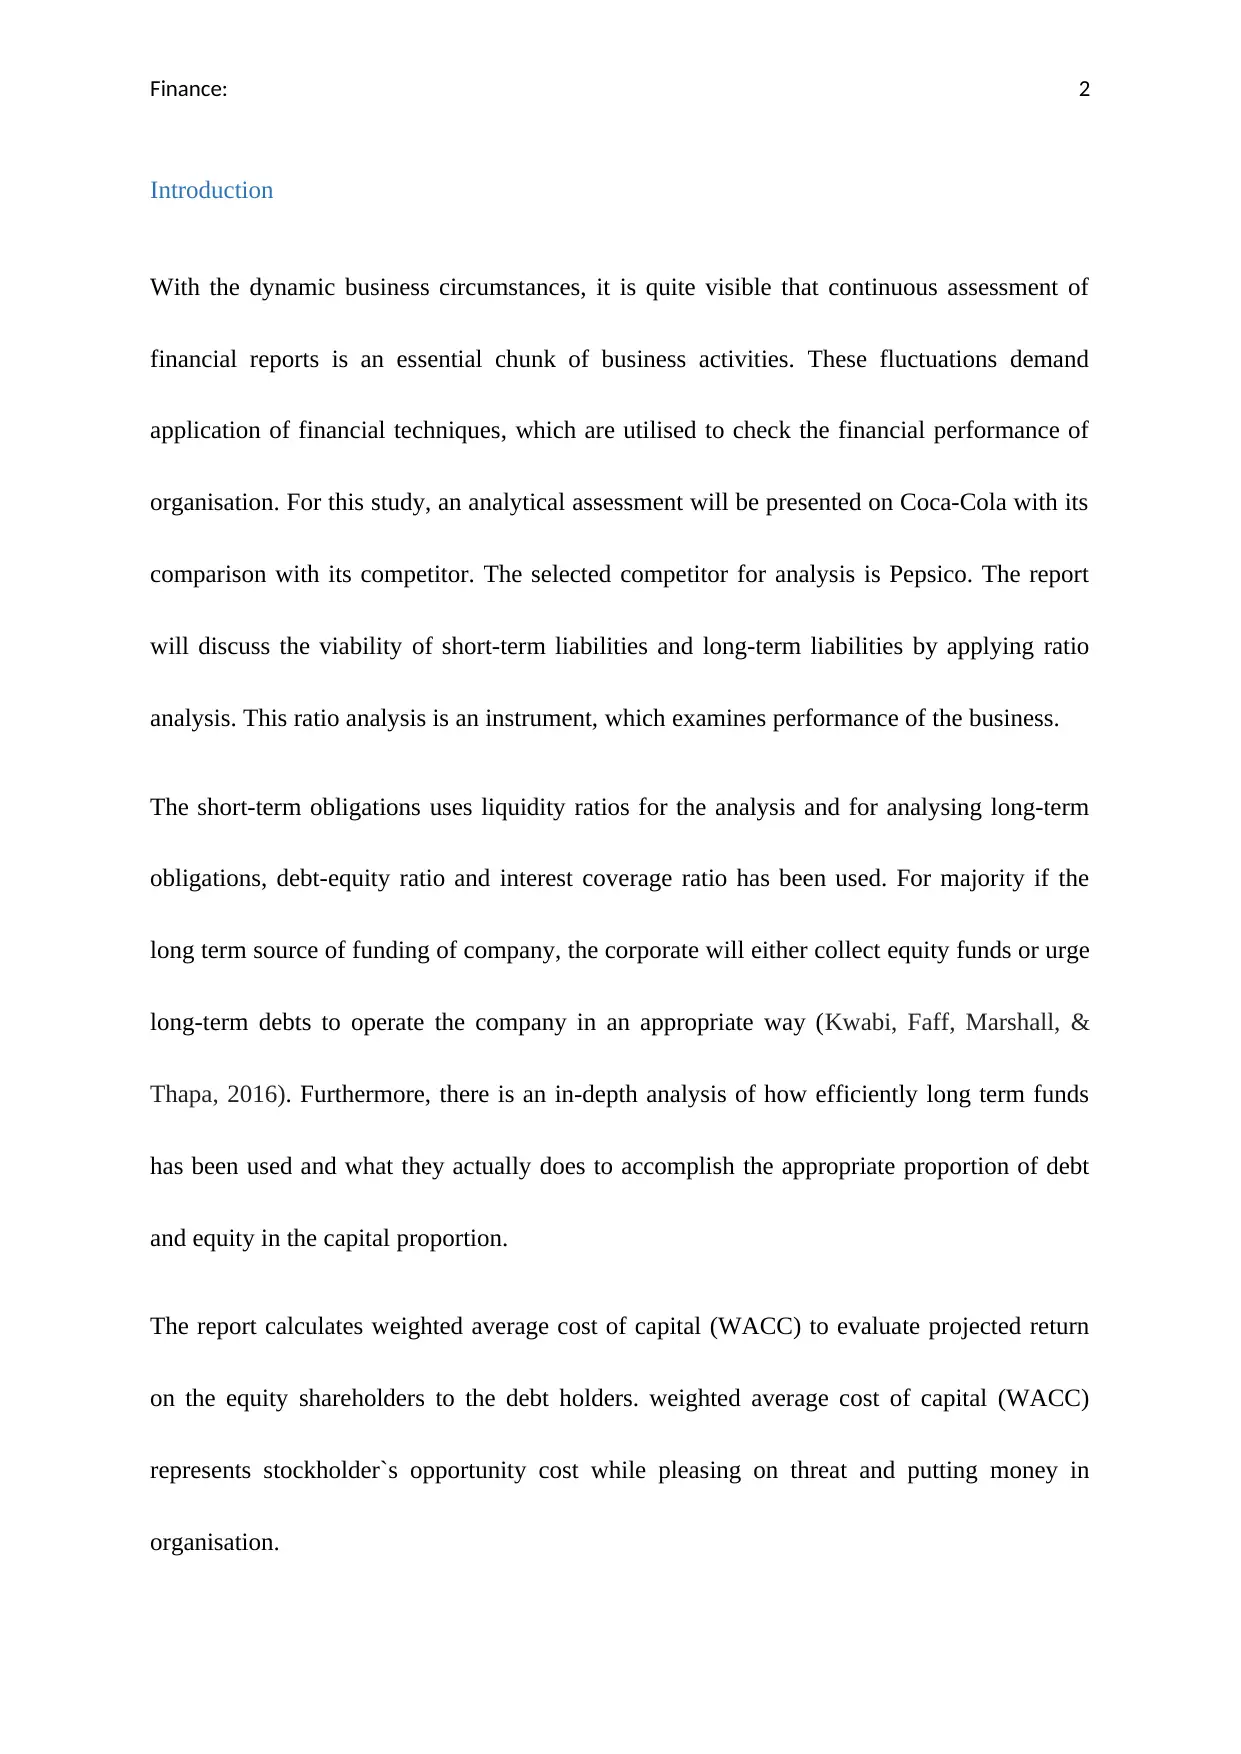
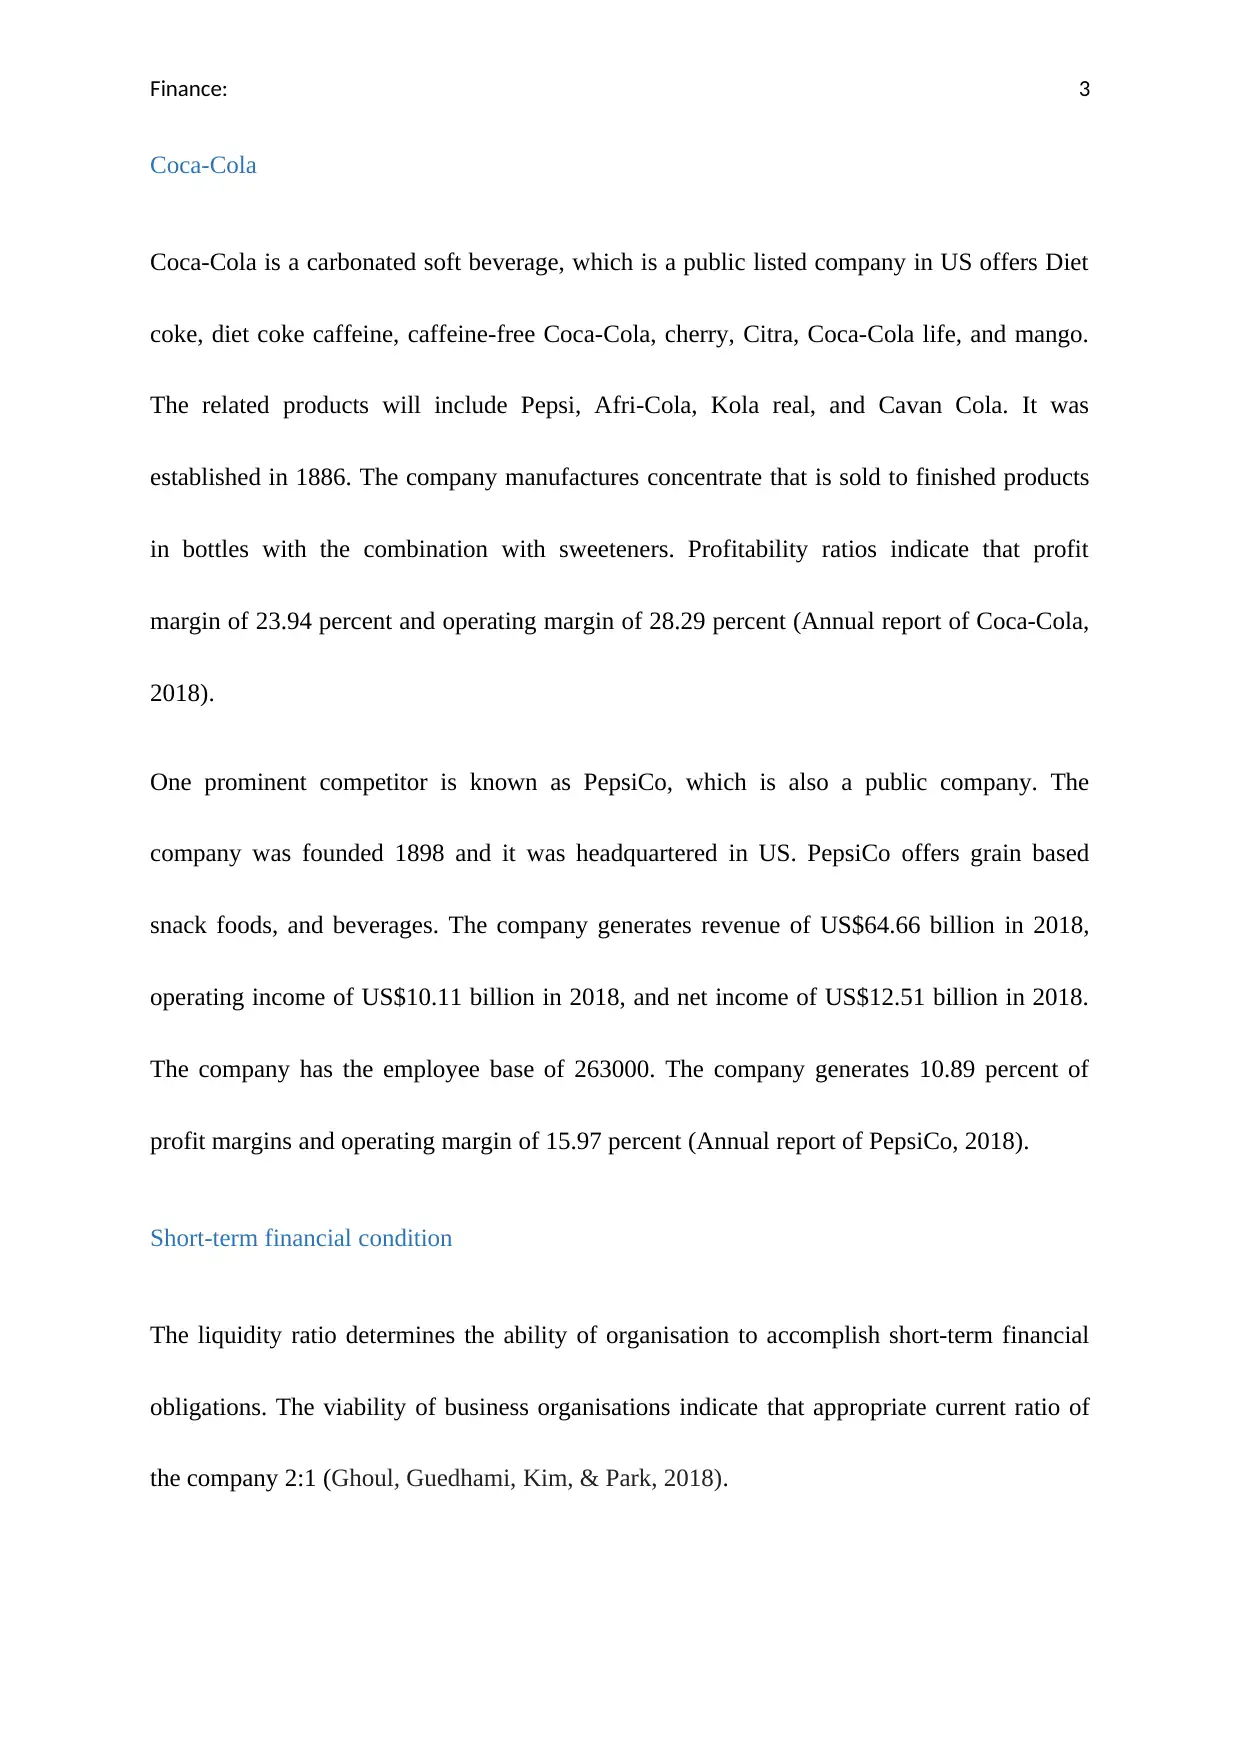
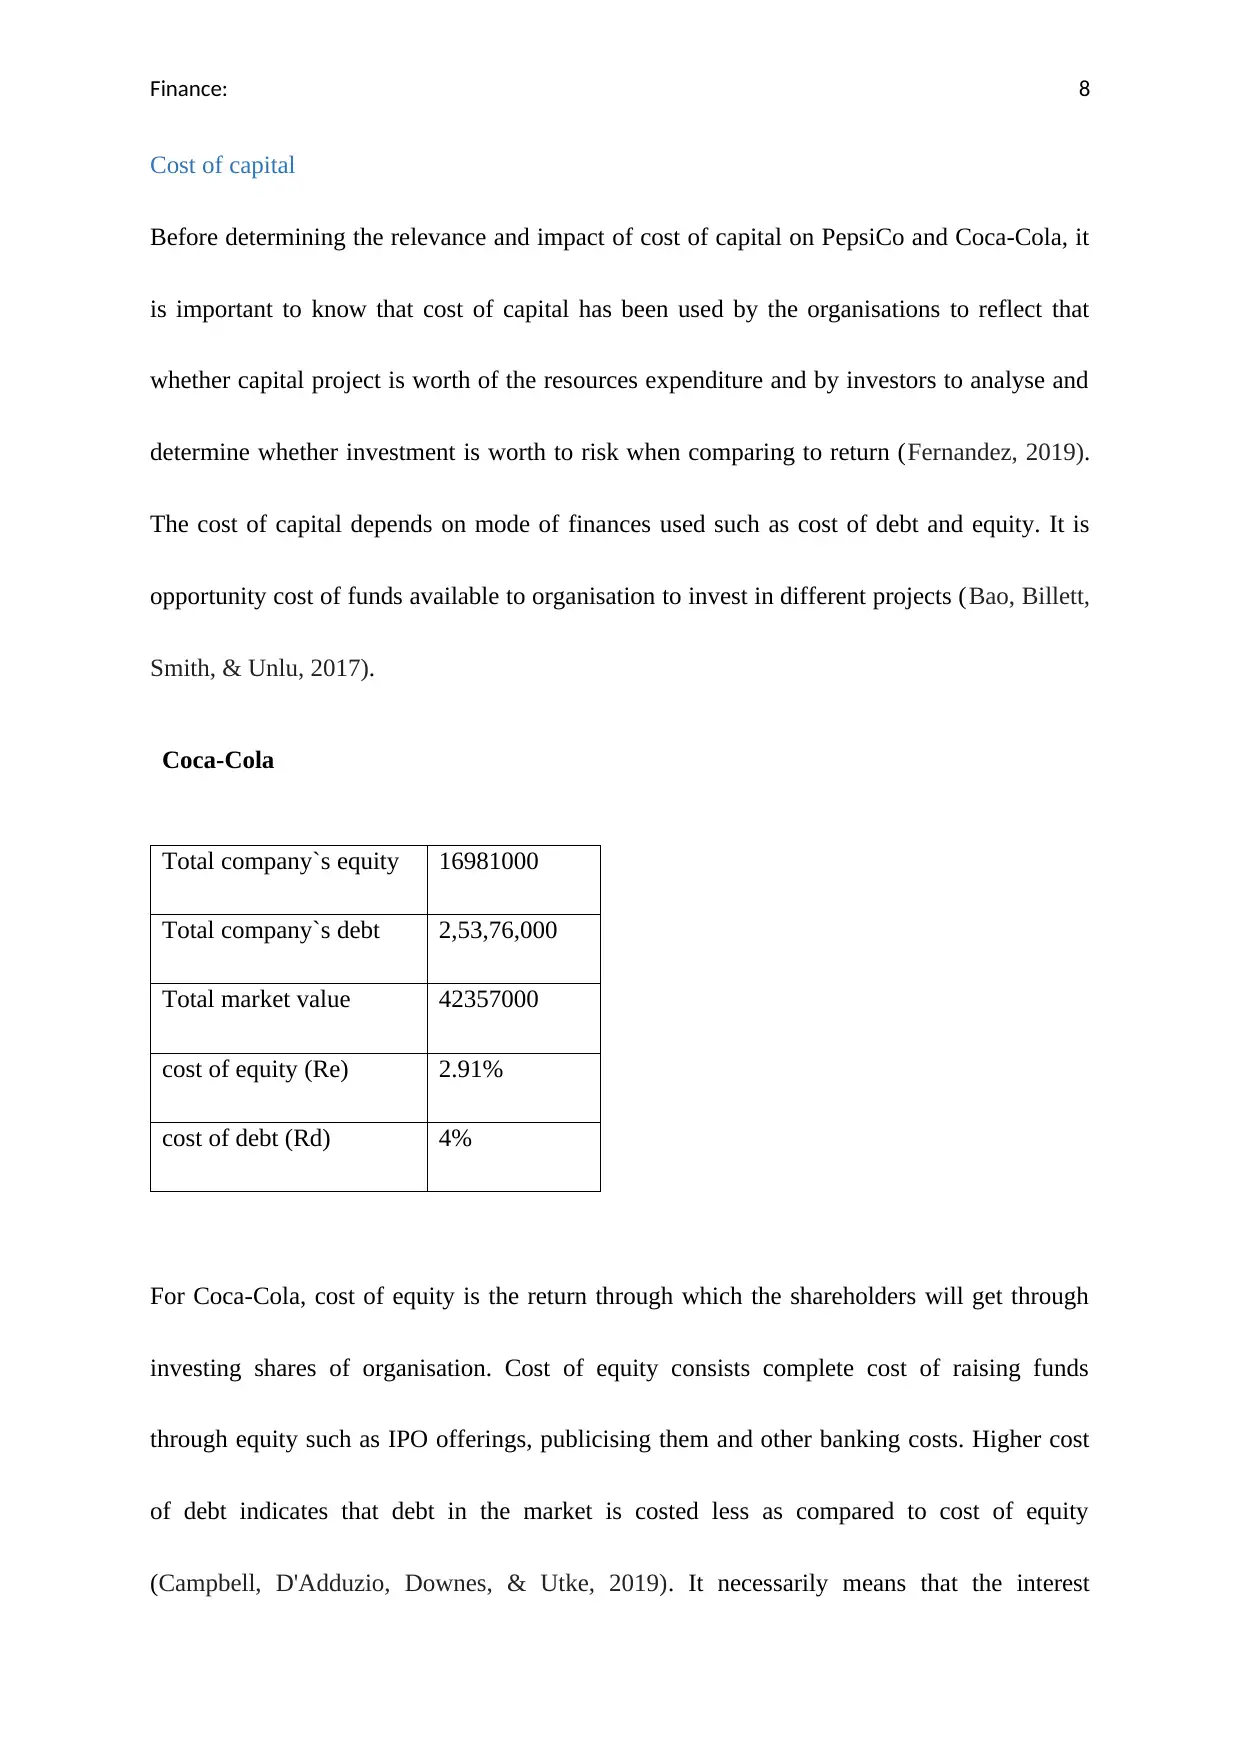
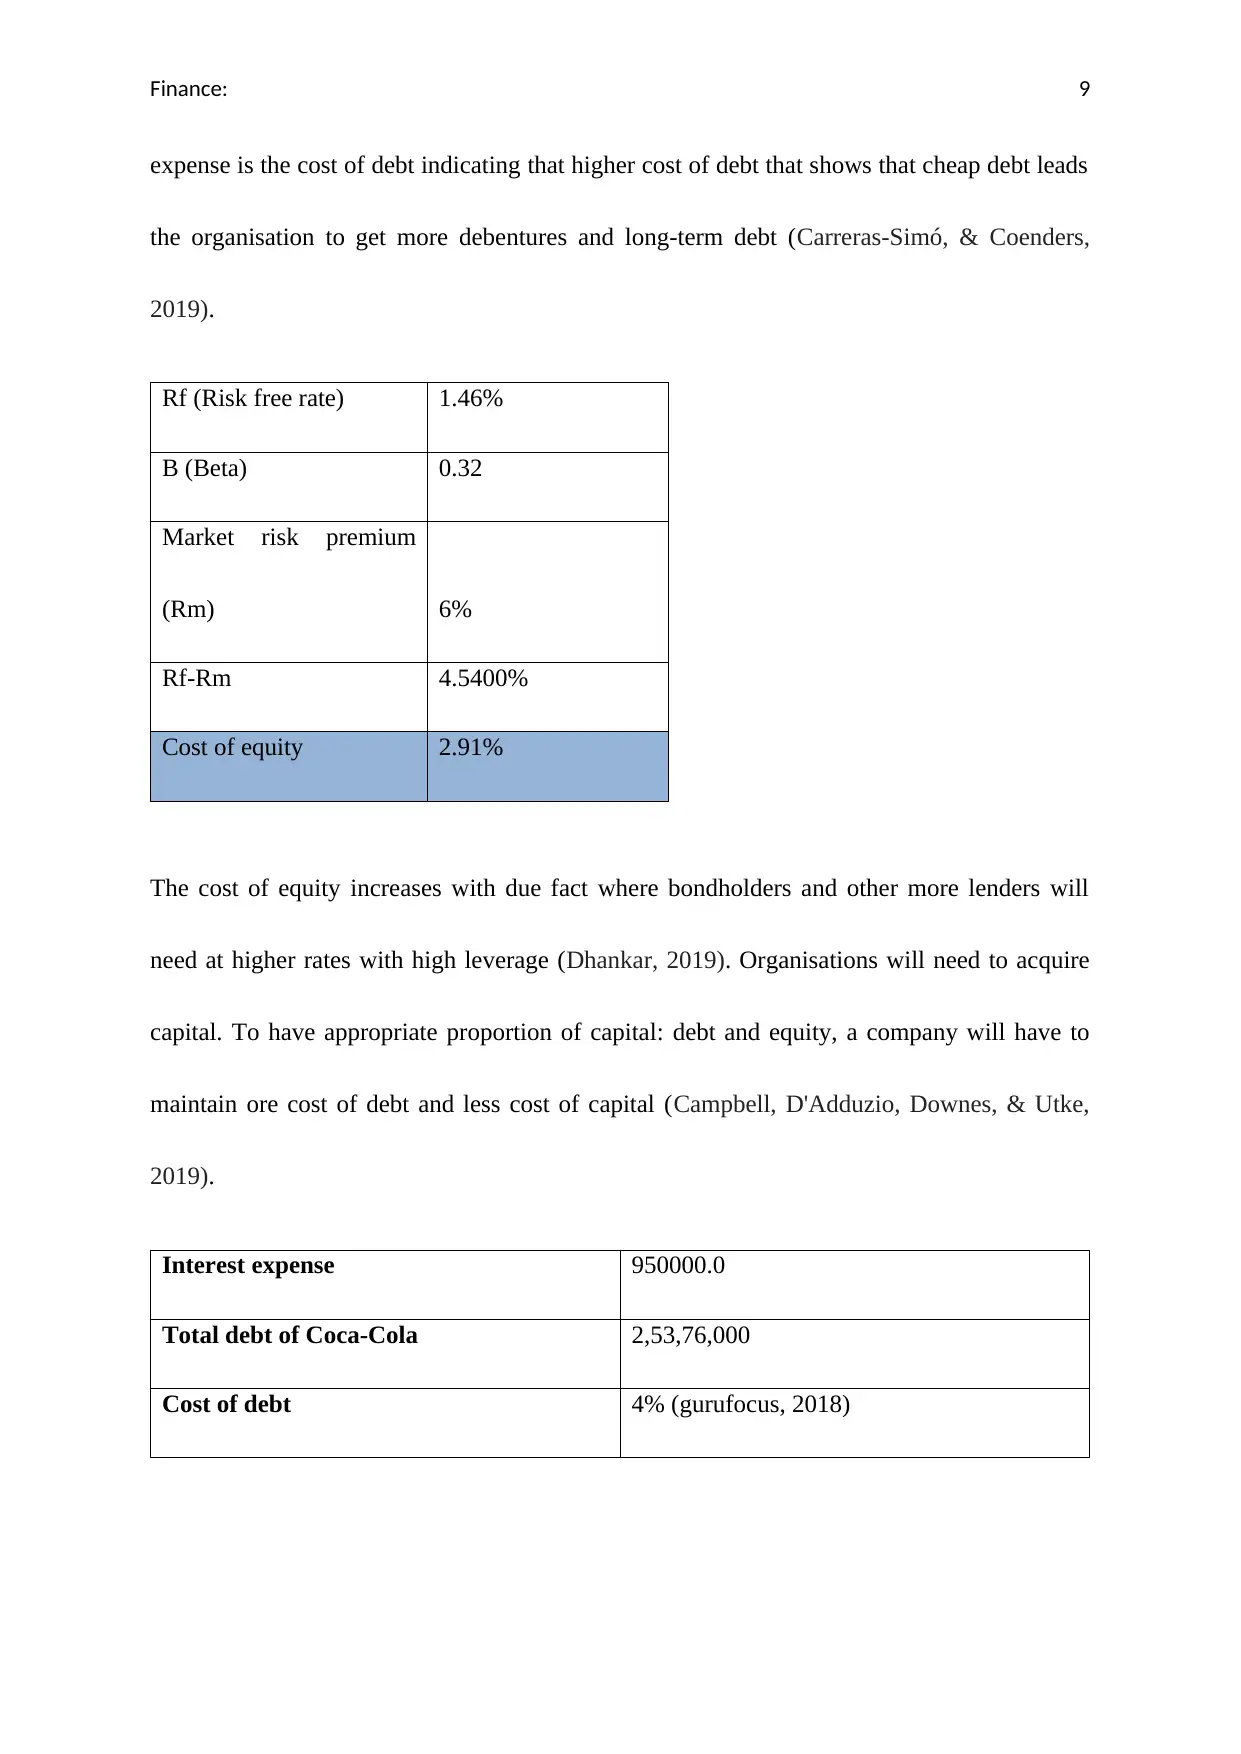
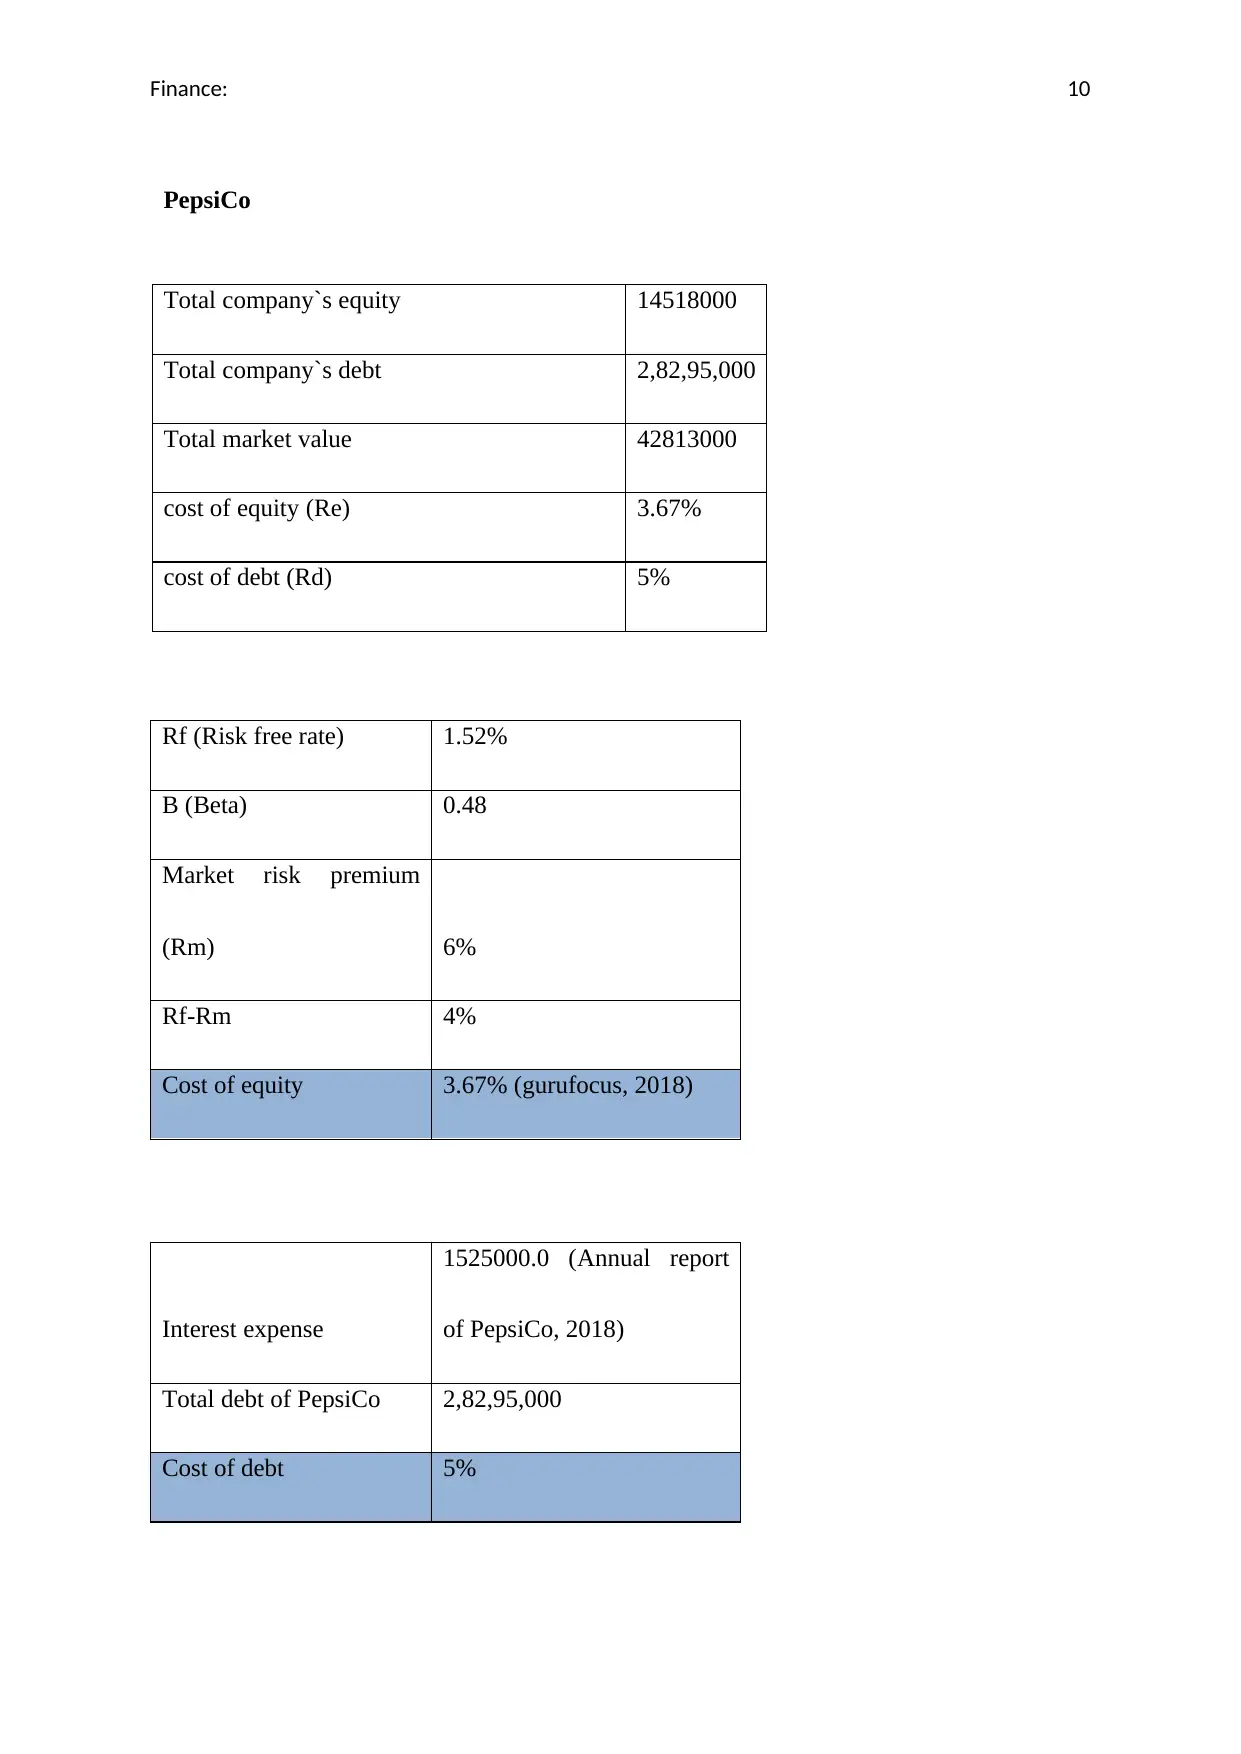
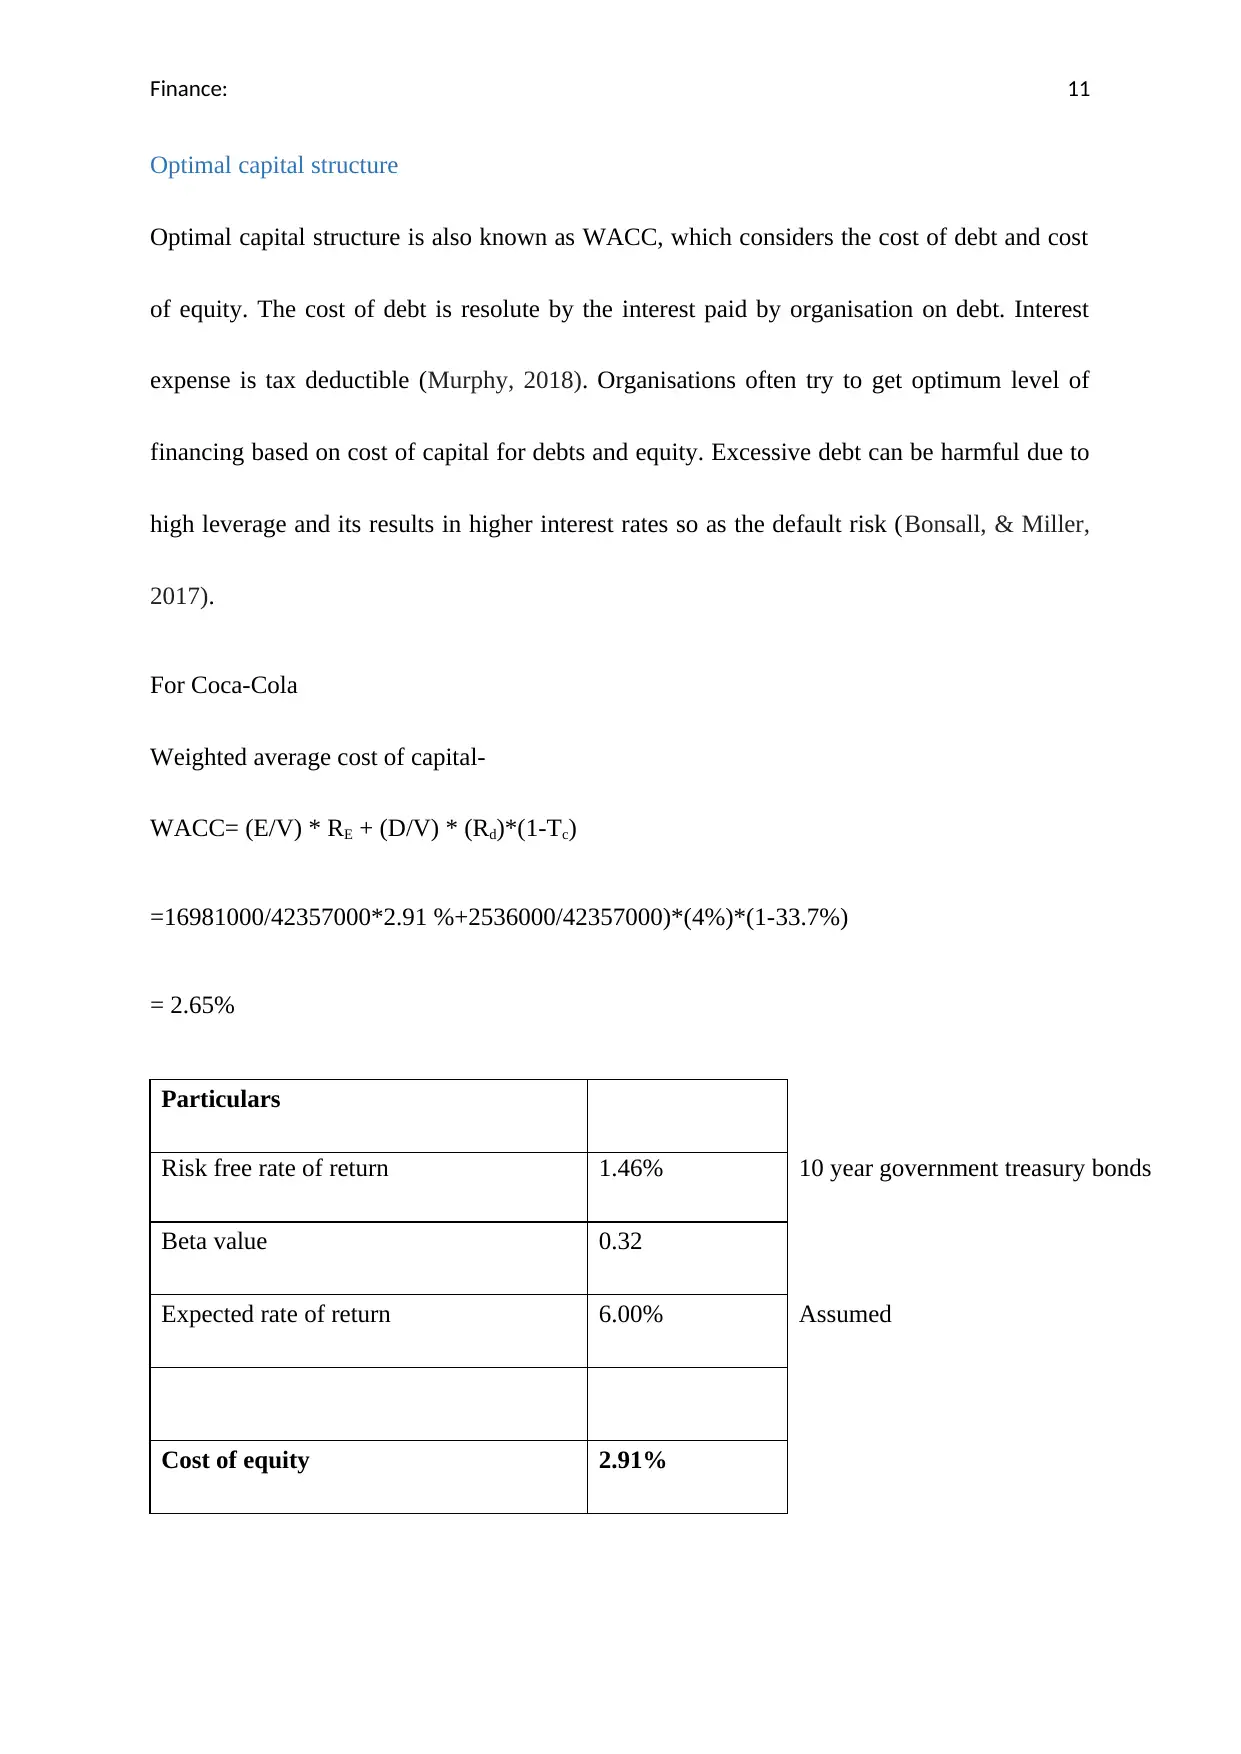
This report presents a detailed financial analysis of Coca-Cola, evaluating its performance and comparing it to its competitor, PepsiCo. The analysis begins with an introduction to the importance of financial statement analysis and the application of financial techniques. The report examines Coca-Cola's short-term and long-term financial conditions using ratio analysis, including liquidity ratios and solvency ratios. Furthermore, it delves into the calculation of the weighted average cost of capital (WACC) to evaluate projected returns for equity and debt holders. The report also assesses the present value of the company's operations. The findings indicate Coca-Cola's financial health, liquidity, and solvency, providing insights into its ability to meet short-term and long-term obligations. The report also includes a comparison of Coca-Cola and PepsiCo's WACC and present value. The conclusion summarizes the key findings and offers insights into the company's overall financial performance.
Document Page
FINANCE
tabler-icon-diamond-filled.svg

Paraphrase This Document

Need a fresh take? Get an instant paraphrase of this document with our AI Paraphraser
Document Page
Finance: 1
Contents
Introduction................................................................................................................................2
Coca-Cola...................................................................................................................................2
Short-term financial condition...................................................................................................3
Long-term financial condition....................................................................................................4
Cost of capital............................................................................................................................4
Optimal capital structure............................................................................................................7
Present value..............................................................................................................................9
Conclusion................................................................................................................................10
References................................................................................................................................11
Document Page
Finance: 2
Introduction
With the dynamic business circumstances, it is quite visible that continuous assessment of
financial reports is an essential chunk of business activities. These fluctuations demand
application of financial techniques, which are utilised to check the financial performance of
organisation. For this study, an analytical assessment will be presented on Coca-Cola with its
comparison with its competitor. The selected competitor for analysis is Pepsico. The report
will discuss the viability of short-term liabilities and long-term liabilities by applying ratio
analysis. This ratio analysis is an instrument, which examines performance of the business.
The short-term obligations uses liquidity ratios for the analysis and for analysing long-term
obligations, debt-equity ratio and interest coverage ratio has been used. For majority if the
long term source of funding of company, the corporate will either collect equity funds or urge
long-term debts to operate the company in an appropriate way (Kwabi, Faff, Marshall, &
Thapa, 2016). Furthermore, there is an in-depth analysis of how efficiently long term funds
has been used and what they actually does to accomplish the appropriate proportion of debt
and equity in the capital proportion.
The report calculates weighted average cost of capital (WACC) to evaluate projected return
on the equity shareholders to the debt holders. weighted average cost of capital (WACC)
represents stockholder`s opportunity cost while pleasing on threat and putting money in
organisation.
Document Page
Finance: 3
Coca-Cola
Coca-Cola is a carbonated soft beverage, which is a public listed company in US offers Diet
coke, diet coke caffeine, caffeine-free Coca-Cola, cherry, Citra, Coca-Cola life, and mango.
The related products will include Pepsi, Afri-Cola, Kola real, and Cavan Cola. It was
established in 1886. The company manufactures concentrate that is sold to finished products
in bottles with the combination with sweeteners. Profitability ratios indicate that profit
margin of 23.94 percent and operating margin of 28.29 percent (Annual report of Coca-Cola,
2018).
One prominent competitor is known as PepsiCo, which is also a public company. The
company was founded 1898 and it was headquartered in US. PepsiCo offers grain based
snack foods, and beverages. The company generates revenue of US$64.66 billion in 2018,
operating income of US$10.11 billion in 2018, and net income of US$12.51 billion in 2018.
The company has the employee base of 263000. The company generates 10.89 percent of
profit margins and operating margin of 15.97 percent (Annual report of PepsiCo, 2018).
Short-term financial condition
The liquidity ratio determines the ability of organisation to accomplish short-term financial
obligations. The viability of business organisations indicate that appropriate current ratio of
the company 2:1 (Ghoul, Guedhami, Kim, & Park, 2018).
tabler-icon-diamond-filled.svg

Paraphrase This Document

Need a fresh take? Get an instant paraphrase of this document with our AI Paraphraser
Document Page
Finance: 4
2017 2018
0.0
0.2
0.4
0.6
0.8
1.0
1.2
1.4
1.6
1.3
0.9
1.513
0.989
Coca-cola
PepsiCo
The current ratio shows the capability to set off current obligations. Greater is ratio then
better is the liquidity (Mari, & Marra, 2018). Current ratio of Coca-Cola determines that it is
1.3 in 2017 and .9 in 2018. On the other hand, current ratio of PepsiCo was determined at
1.51 in 2017 and .98 in 2018.
Coca-Cola does not meet its short-term financial obligations properly because it does not
accomplish 2:1, which is the standard ratio. This shows that there is a need to improve the
current ratio by increasing the current assets and paying off current obligations. The quick
ratio indicates capability of organisation to pay off the debts through the quick assets. Current
assets less inventory is known as quick asset (Lim, Wang, & Zeng, 2018). The ideal ratio for
the quick ratio is 1:1. During 2017, Coca-Cola generates a Quick ratio of 1.2 and in 2018, it
generates quick ratio of 0.8.
Document Page
Finance: 5
2017 2018
0.0
0.2
0.4
0.6
0.8
1.0
1.2
1.4
1.6
1.2
0.8
1.370
0.848
Coca-cola
PepsiCo
(Refer to excel file)
This shows that in 2017, the company has more than adequate resources to pay off liabilities
(Rodrigues, & Rodrigues, 2018). Then it suddenly reduced the quick ratio to 0.9:1. On the
other hand, the competitor “PepsiCo” generates 1.37 percent of quick assets to set off its
current responsibilities in 2017 and .84 in 2018, where it has less quick assets to pay off its
current accountabilities. In 2018, the quick ratio of the company has not been maintained
well, which needs company to accomplish current liabilities (Zore et al., 2018).
Long-term financial condition
Solvency ratios and the leverage ratios measure the capability of organisation to sustain the
operations and compare the debt level with equity and finally evaluate whether the business is
able to set off its long term requirements. The standard ratio for debt equity is 2:1, and on the
other hand, higher ratio indicate that organisation has been getting more finances as borrowed
fund. High-borrowed fund is subject to more potential risks (Ghoul, Guedhami, Kim, & Park,
Document Page
Finance: 6
2018). On the other hand, a low debt equity ratio indicate that organisation is not taking
advantage of increasing profits, which loans generates.
2017 2018
0.00
0.50
1.00
1.50
2.00
2.50
3.00
3.50
1.83
1.49
3.1
1.9
Coca-cola
PepsiCo
(Refer to excel file)
Coco-cola has the debt equity of 1.83 in 2017 and 1.49 of debt equity in 2018. On the other
hand, PepsiCo generates 3.1 in 2017 and 1.9 in 2018. Coca-Cola generates appropriate funds
to pay off its long term obligations. However, the proportion of Debt in total capital structure
is quite increased (Annual report of PepsiCo, 2018).
tabler-icon-diamond-filled.svg

Paraphrase This Document

Need a fresh take? Get an instant paraphrase of this document with our AI Paraphraser
Document Page
Finance: 7
2017 2018
0.00
1.00
2.00
3.00
4.00
5.00
6.00
7.00
8.00
9.00
10.00
9.02
8.10
9.3
7.0
Coca-cola
PepsiCo
(Refer to excel file)
The interest coverage ratio (ICR) shows the capability of the company to serve debt and its
business obligations such as its interest. The company should at least maintain ICR of two,
which is acceptable whereas, ICR of less than one cannot meet the current interest payment
obligations that is no the good financial state. The data shows that Coca-Cola generates an
ICR of 9.02 in 2017 and 8.1 times in 2018. On the other hand, PepsiCo generates an ICR of
9.3 times in 2017 and 7 times in 2018 (Carreras-Simó, & Coenders, 2019).
This indicates that both the companies are quite capable of meeting the interest expenses on
time. A financial data indicates that in both the years, the ratio is more than 5, which means
the companies are quite able to meet better financial health as Coca-Cola and PepsiCo is
more capable of meeting interest obligations (Annual report of Coca-Cola, 2018).
Document Page
Finance: 8
Cost of capital
Before determining the relevance and impact of cost of capital on PepsiCo and Coca-Cola, it
is important to know that cost of capital has been used by the organisations to reflect that
whether capital project is worth of the resources expenditure and by investors to analyse and
determine whether investment is worth to risk when comparing to return (Fernandez, 2019).
The cost of capital depends on mode of finances used such as cost of debt and equity. It is
opportunity cost of funds available to organisation to invest in different projects (Bao, Billett,
Smith, & Unlu, 2017).
Coca-Cola
Total company`s equity 16981000
Total company`s debt 2,53,76,000
Total market value 42357000
cost of equity (Re) 2.91%
cost of debt (Rd) 4%
For Coca-Cola, cost of equity is the return through which the shareholders will get through
investing shares of organisation. Cost of equity consists complete cost of raising funds
through equity such as IPO offerings, publicising them and other banking costs. Higher cost
of debt indicates that debt in the market is costed less as compared to cost of equity
(Campbell, D'Adduzio, Downes, & Utke, 2019). It necessarily means that the interest
Document Page
Finance: 9
expense is the cost of debt indicating that higher cost of debt that shows that cheap debt leads
the organisation to get more debentures and long-term debt (Carreras-Simó, & Coenders,
2019).
Rf (Risk free rate) 1.46%
B (Beta) 0.32
Market risk premium
(Rm) 6%
Rf-Rm 4.5400%
Cost of equity 2.91%
The cost of equity increases with due fact where bondholders and other more lenders will
need at higher rates with high leverage (Dhankar, 2019). Organisations will need to acquire
capital. To have appropriate proportion of capital: debt and equity, a company will have to
maintain ore cost of debt and less cost of capital (Campbell, D'Adduzio, Downes, & Utke,
2019).
Interest expense 950000.0
Total debt of Coca-Cola 2,53,76,000
Cost of debt 4% (gurufocus, 2018)
tabler-icon-diamond-filled.svg

Paraphrase This Document

Need a fresh take? Get an instant paraphrase of this document with our AI Paraphraser
Document Page
Finance: 10
PepsiCo
Total company`s equity 14518000
Total company`s debt 2,82,95,000
Total market value 42813000
cost of equity (Re) 3.67%
cost of debt (Rd) 5%
Rf (Risk free rate) 1.52%
B (Beta) 0.48
Market risk premium
(Rm) 6%
Rf-Rm 4%
Cost of equity 3.67% (gurufocus, 2018)
Interest expense
1525000.0 (Annual report
of PepsiCo, 2018)
Total debt of PepsiCo 2,82,95,000
Cost of debt 5%
Document Page
Finance: 11
Optimal capital structure
Optimal capital structure is also known as WACC, which considers the cost of debt and cost
of equity. The cost of debt is resolute by the interest paid by organisation on debt. Interest
expense is tax deductible (Murphy, 2018). Organisations often try to get optimum level of
financing based on cost of capital for debts and equity. Excessive debt can be harmful due to
high leverage and its results in higher interest rates so as the default risk (Bonsall, & Miller,
2017).
For Coca-Cola
Weighted average cost of capital-
WACC= (E/V) * RE + (D/V) * (Rd)*(1-Tc)
=16981000/42357000*2.91 %+2536000/42357000)*(4%)*(1-33.7%)
= 2.65%
Particulars
Risk free rate of return 1.46% 10 year government treasury bonds
Beta value 0.32
Expected rate of return 6.00% Assumed
Cost of equity 2.91%
chevron_up_icon
1 out of 21
circle_padding
hide_on_mobile
zoom_out_icon