Financial Statement Analysis: Coca-Cola, Pepsi, Dr. Pepper

Verified

Added on  2019/09/16

|1
|732
|390
Project
AI Summary
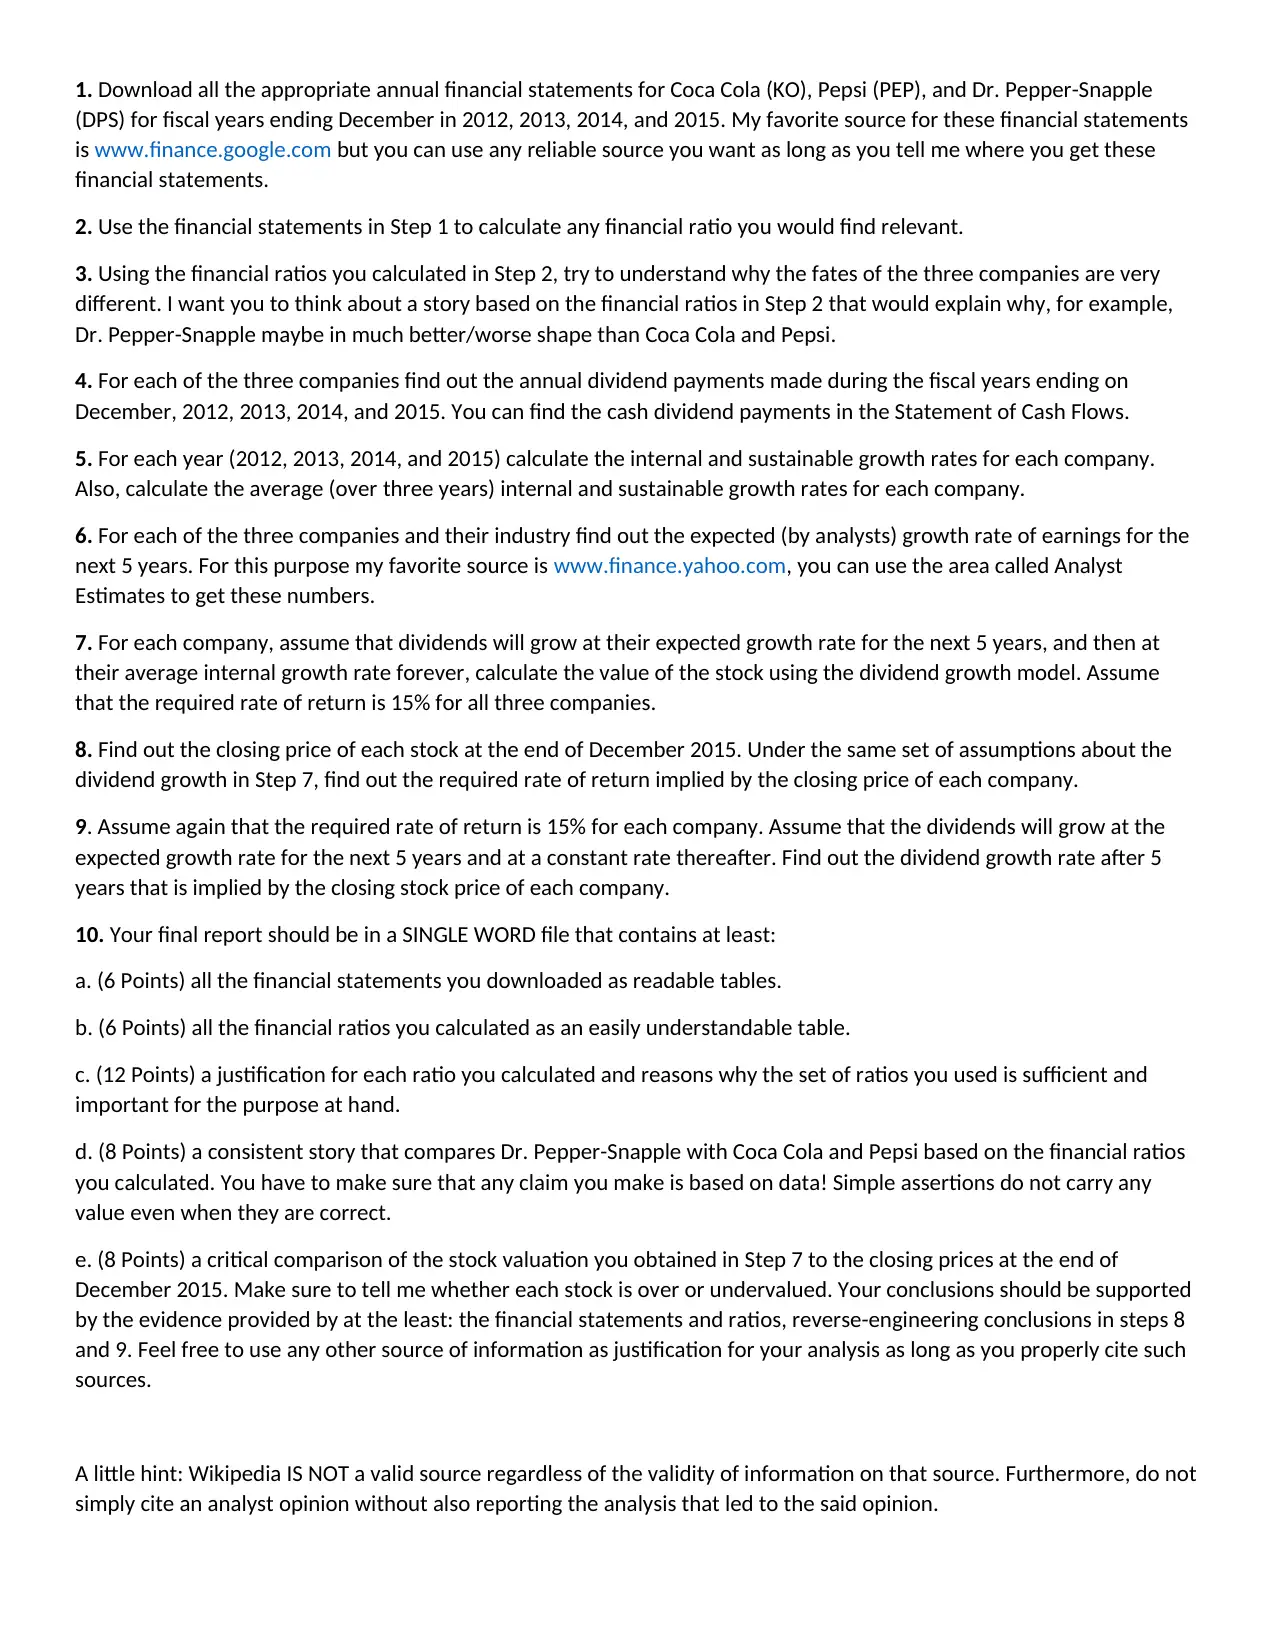
This project requires a comprehensive financial analysis of Coca-Cola (KO), Pepsi (PEP), and Dr. Pepper-Snapple (DPS) using their annual financial statements from 2012 to 2015. Students will download financial statements, calculate relevant financial ratios, and analyze the companies' performance. The project also involves calculating internal and sustainable growth rates, using the dividend growth model to value stocks, and comparing these valuations to actual market prices. The final report should include financial statements, ratio calculations, justifications, a comparative analysis, and a critical evaluation of stock valuations, all supported by data and analysis.
Document Page
1. Download all the appropriate annual financial statements for Coca Cola (KO), Pepsi (PEP), and Dr. Pepper-Snapple
(DPS) for fiscal years ending December in 2012, 2013, 2014, and 2015. My favorite source for these financial statements
is www.finance.google.com but you can use any reliable source you want as long as you tell me where you get these
financial statements.
2. Use the financial statements in Step 1 to calculate any financial ratio you would find relevant.
3. Using the financial ratios you calculated in Step 2, try to understand why the fates of the three companies are very
different. I want you to think about a story based on the financial ratios in Step 2 that would explain why, for example,
Dr. Pepper-Snapple maybe in much better/worse shape than Coca Cola and Pepsi.
4. For each of the three companies find out the annual dividend payments made during the fiscal years ending on
December, 2012, 2013, 2014, and 2015. You can find the cash dividend payments in the Statement of Cash Flows.
5. For each year (2012, 2013, 2014, and 2015) calculate the internal and sustainable growth rates for each company.
Also, calculate the average (over three years) internal and sustainable growth rates for each company.
6. For each of the three companies and their industry find out the expected (by analysts) growth rate of earnings for the
next 5 years. For this purpose my favorite source is www.finance.yahoo.com, you can use the area called Analyst
Estimates to get these numbers.
7. For each company, assume that dividends will grow at their expected growth rate for the next 5 years, and then at
their average internal growth rate forever, calculate the value of the stock using the dividend growth model. Assume
that the required rate of return is 15% for all three companies.
8. Find out the closing price of each stock at the end of December 2015. Under the same set of assumptions about the
dividend growth in Step 7, find out the required rate of return implied by the closing price of each company.
9. Assume again that the required rate of return is 15% for each company. Assume that the dividends will grow at the
expected growth rate for the next 5 years and at a constant rate thereafter. Find out the dividend growth rate after 5
years that is implied by the closing stock price of each company.
10. Your final report should be in a SINGLE WORD file that contains at least:
a. (6 Points) all the financial statements you downloaded as readable tables.
b. (6 Points) all the financial ratios you calculated as an easily understandable table.
c. (12 Points) a justification for each ratio you calculated and reasons why the set of ratios you used is sufficient and
important for the purpose at hand.
d. (8 Points) a consistent story that compares Dr. Pepper-Snapple with Coca Cola and Pepsi based on the financial ratios
you calculated. You have to make sure that any claim you make is based on data! Simple assertions do not carry any
value even when they are correct.
e. (8 Points) a critical comparison of the stock valuation you obtained in Step 7 to the closing prices at the end of
December 2015. Make sure to tell me whether each stock is over or undervalued. Your conclusions should be supported
by the evidence provided by at the least: the financial statements and ratios, reverse-engineering conclusions in steps 8
and 9. Feel free to use any other source of information as justification for your analysis as long as you properly cite such
sources.
A little hint: Wikipedia IS NOT a valid source regardless of the validity of information on that source. Furthermore, do not
simply cite an analyst opinion without also reporting the analysis that led to the said opinion.
tabler-icon-diamond-filled.svg

Paraphrase This Document

Need a fresh take? Get an instant paraphrase of this document with our AI Paraphraser
[object Object]