Financial Analysis and Decision Making Report (Module Finance)
VerifiedAdded on 2020/04/21
|17
|4907
|39
Report
AI Summary
This report provides a comprehensive financial analysis of two cases: Splinter Sports Equipment Manufacturing Limited and Cocoaland Holdings Berhad. The first case focuses on cost analysis, specifically addressing a loss-making production process (Round process) and recommends strategies to mitigate losses and improve the cost sheet. The second case involves a detailed financial analysis of Cocoaland Holdings Berhad, employing ratio analysis to assess liquidity, profitability, efficiency, and capital structure. The report aims to provide insights for better decision-making, including whether to discontinue a production process and how to evaluate a company's financial health. It also includes recasting of data and offers recommendations based on the financial analysis performed.
Running Head: Managerial Accounting
1
Project Head: Managerial Accounting
1
Project Head: Managerial Accounting
Paraphrase This Document
Need a fresh take? Get an instant paraphrase of this document with our AI Paraphraser
Managerial Accounting
2
Contents
Introduction.......................................................................................................................3
Que 1.................................................................................................................................3
Decision about Round process......................................................................................3
Recasting the above data..............................................................................................4
Que 2.................................................................................................................................5
Company overview...........................................................................................................5
Objective of the report......................................................................................................6
Financial statement analysis.............................................................................................6
Liquidity.......................................................................................................................7
Profitability...................................................................................................................8
Efficiency......................................................................................................................9
Capital structure..........................................................................................................10
Findings..........................................................................................................................11
Conclusion:.....................................................................................................................11
References.......................................................................................................................13
Appendix.........................................................................................................................15
Managerial Accounting
3
Introduction:
Accounting plays a crucial role in the life of an organization. It assists an organization
to make various decisions for the betterment of an organization. In this report 2 cases have
been studied, in first case, the splinter sports equipment manufacturing limited has been
analyzed and found that one of their production processes is occurring loss. The strategies
have been analyzed in this case to reduce the level of the losses in the organization and
further, the cost sheet has been managed in such a manner that best strategy could be planned
by the company.
In second case, Cocoaland Holdings Berhad has been analyzed and a financial
analysis study has been performed over the company to analyze and investigate the functions
and the activities of the company. More, it has been found that what are the drawbacks of the
company and how can the company overcome it. More, in both the cases, various tools and
techniques have been analyzed to make a proper report and through which a good decision
could be made.
In this report, costing analysis as well as financial accounting study has been done to
investigate both the cases and reach over a conclusion. Ratio analysis method has been taken
into teh context for the second report so that the financial data of the Cocoaland holdings
limited could be analyzed in a proper manner and the recommendation could be given to the
user of the report in a proper manner so that a best decision could be made.
Que 1)
Decision about Round process:
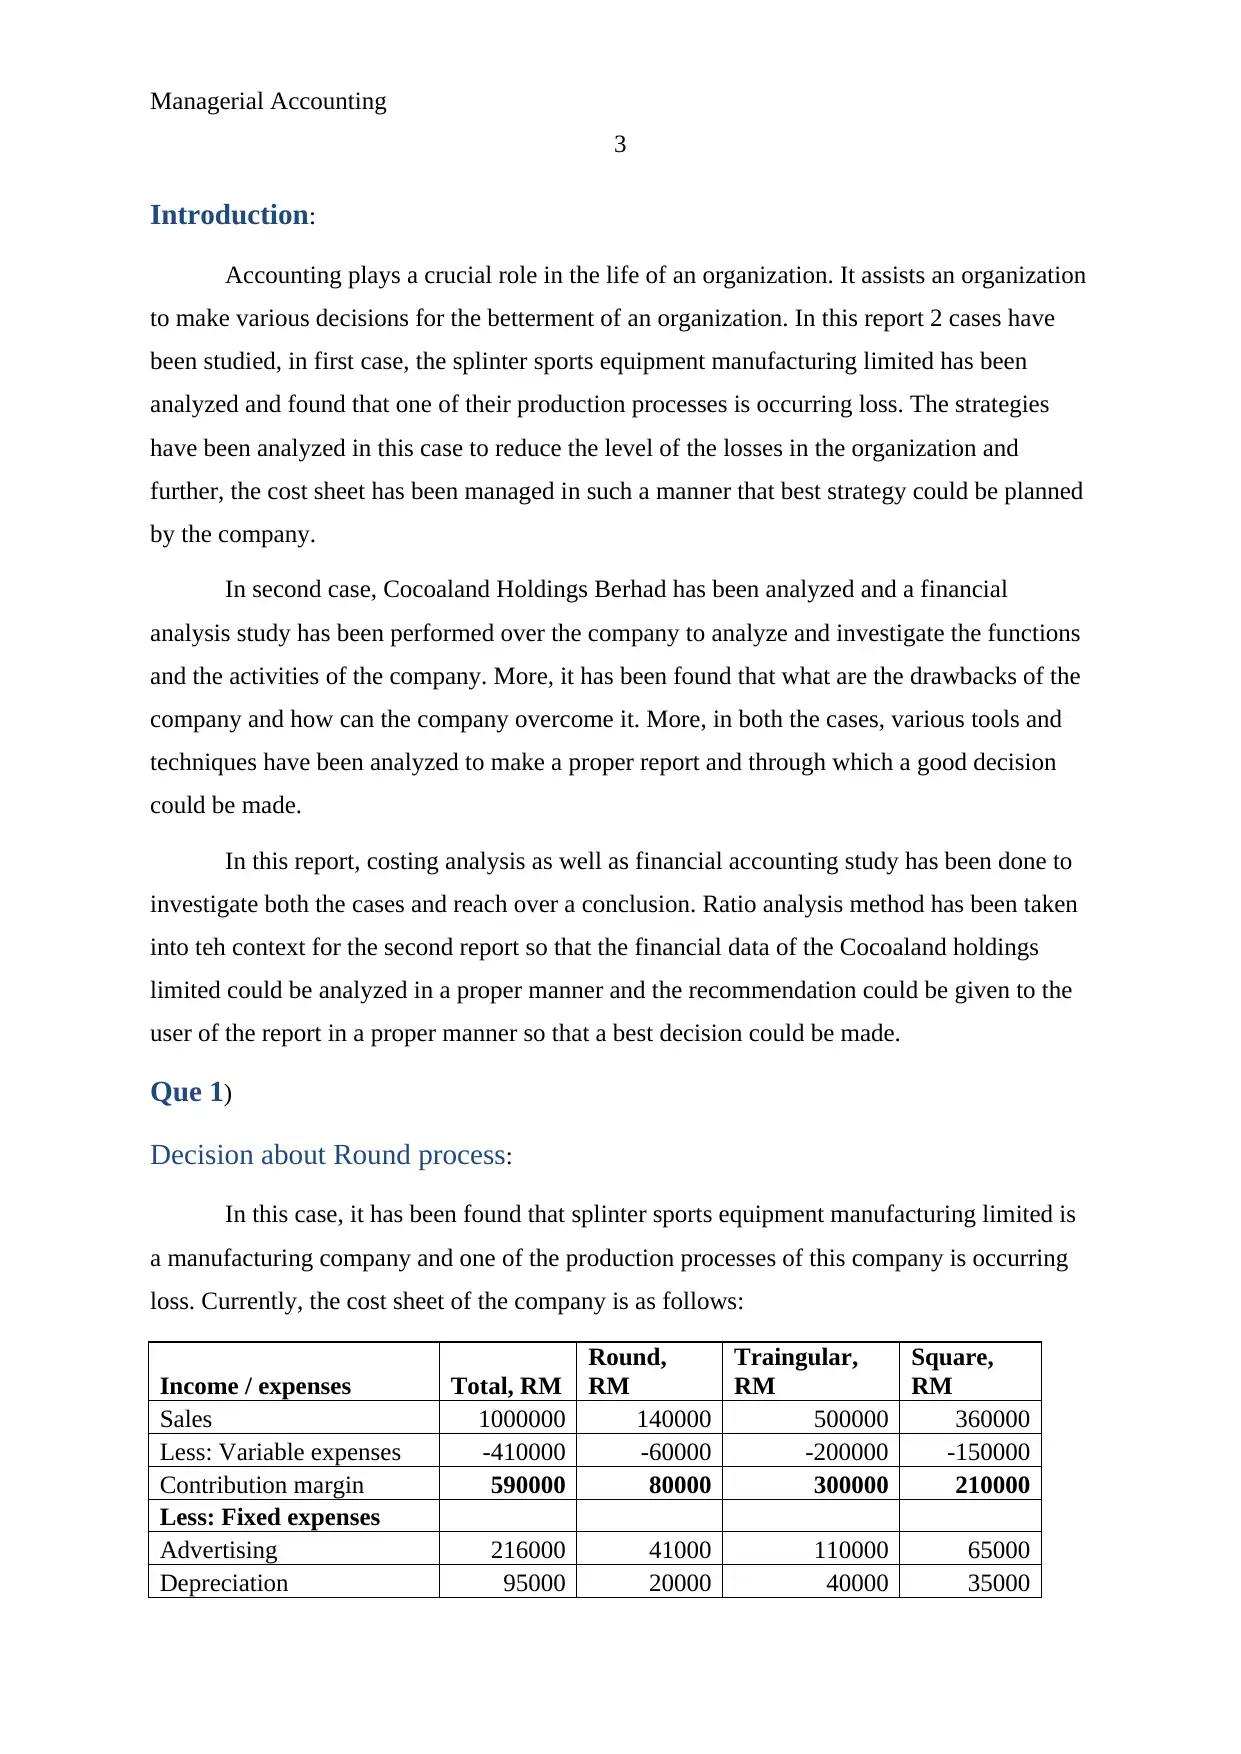
In this case, it has been found that splinter sports equipment manufacturing limited is
a manufacturing company and one of the production processes of this company is occurring
loss. Currently, the cost sheet of the company is as follows:
Income / expenses Total, RM
Round,
RM
Traingular,
RM
Square,
RM
Sales 1000000 140000 500000 360000
Less: Variable expenses -410000 -60000 -200000 -150000
Contribution margin 590000 80000 300000 210000
Less: Fixed expenses
Advertising 216000 41000 110000 65000
Depreciation 95000 20000 40000 35000
3
Introduction:
Accounting plays a crucial role in the life of an organization. It assists an organization
to make various decisions for the betterment of an organization. In this report 2 cases have
been studied, in first case, the splinter sports equipment manufacturing limited has been
analyzed and found that one of their production processes is occurring loss. The strategies
have been analyzed in this case to reduce the level of the losses in the organization and
further, the cost sheet has been managed in such a manner that best strategy could be planned
by the company.
In second case, Cocoaland Holdings Berhad has been analyzed and a financial
analysis study has been performed over the company to analyze and investigate the functions
and the activities of the company. More, it has been found that what are the drawbacks of the
company and how can the company overcome it. More, in both the cases, various tools and
techniques have been analyzed to make a proper report and through which a good decision
could be made.
In this report, costing analysis as well as financial accounting study has been done to
investigate both the cases and reach over a conclusion. Ratio analysis method has been taken
into teh context for the second report so that the financial data of the Cocoaland holdings
limited could be analyzed in a proper manner and the recommendation could be given to the
user of the report in a proper manner so that a best decision could be made.
Que 1)
Decision about Round process:
In this case, it has been found that splinter sports equipment manufacturing limited is
a manufacturing company and one of the production processes of this company is occurring
loss. Currently, the cost sheet of the company is as follows:
Income / expenses Total, RM
Round,
RM
Traingular,
RM
Square,
RM
Sales 1000000 140000 500000 360000
Less: Variable expenses -410000 -60000 -200000 -150000
Contribution margin 590000 80000 300000 210000
Less: Fixed expenses
Advertising 216000 41000 110000 65000
Depreciation 95000 20000 40000 35000
⊘ This is a preview!⊘
Do you want full access?
Subscribe today to unlock all pages.
Trusted by 1+ million students worldwide
Managerial Accounting
4
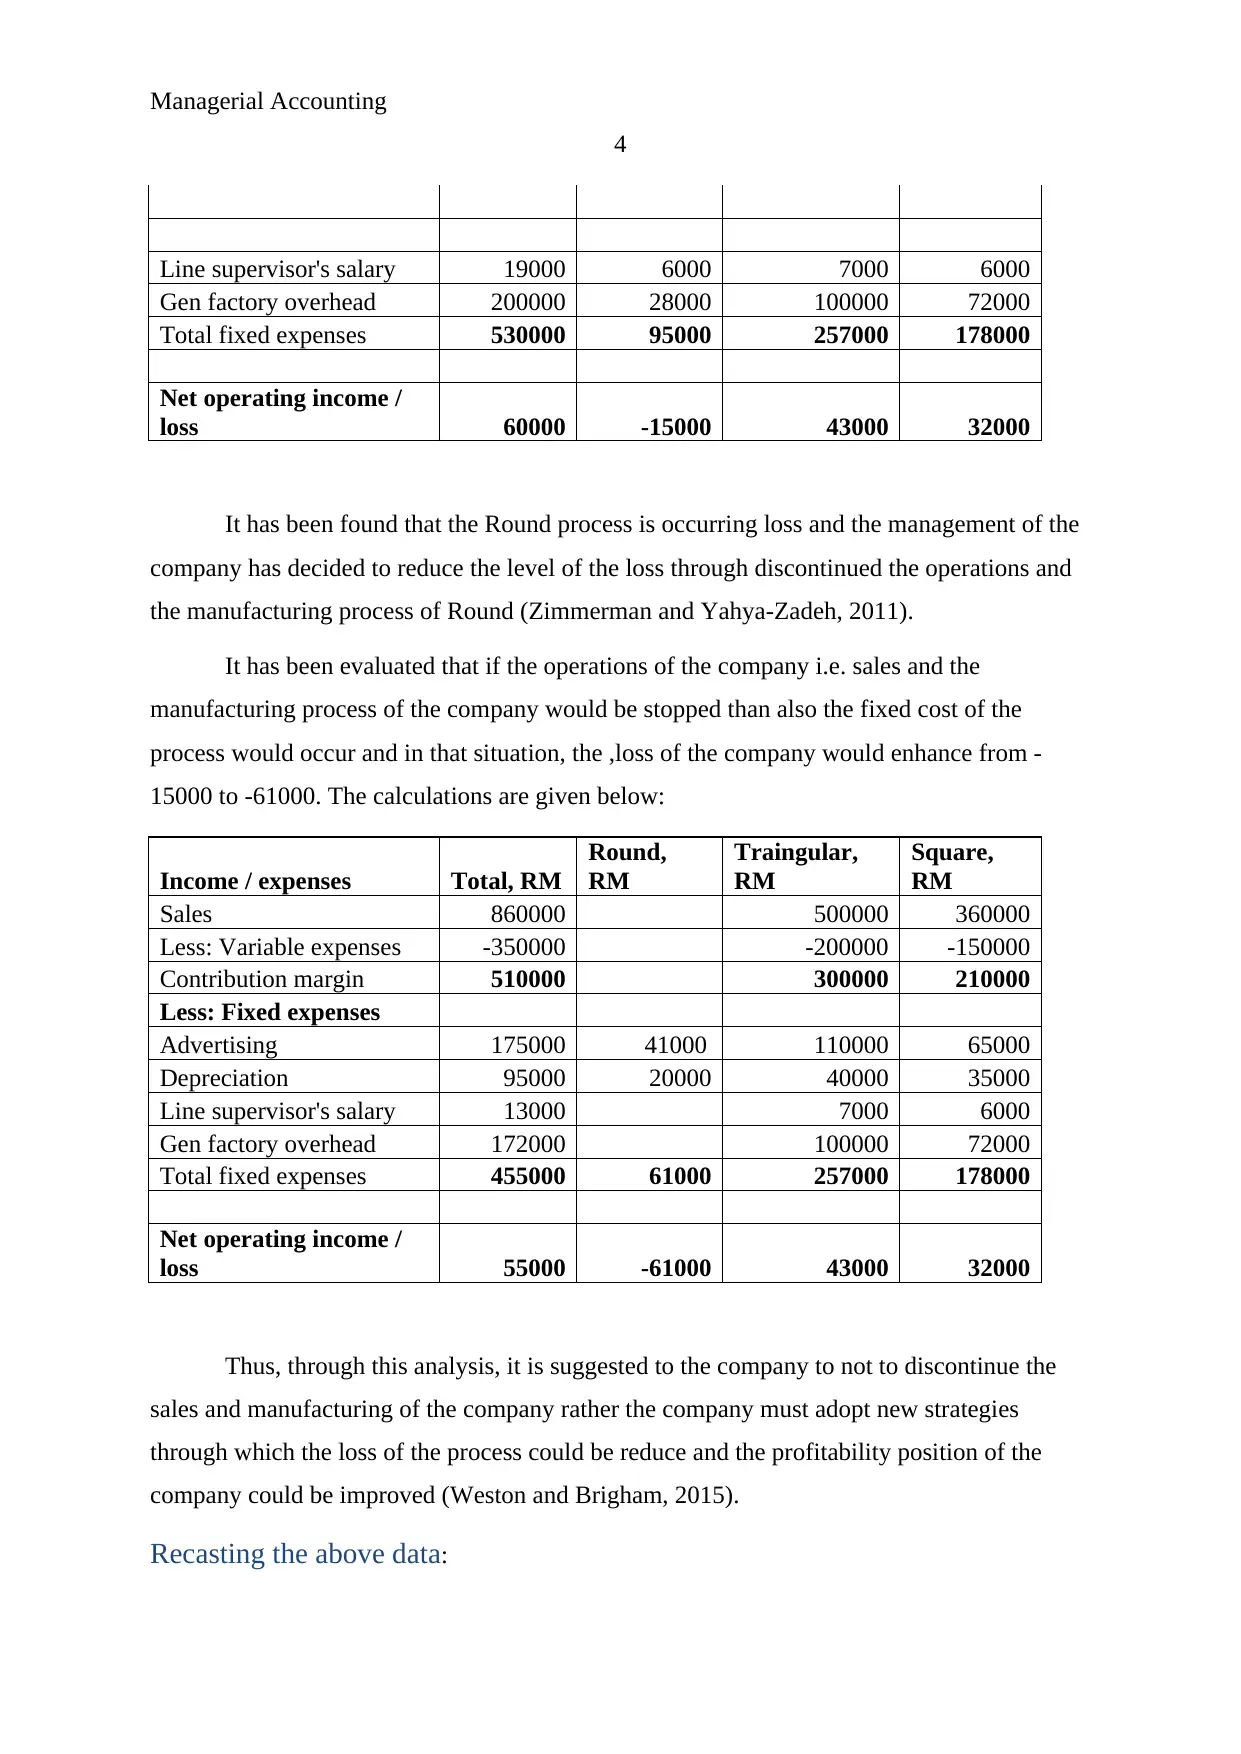
Line supervisor's salary 19000 6000 7000 6000
Gen factory overhead 200000 28000 100000 72000
Total fixed expenses 530000 95000 257000 178000
Net operating income /
loss 60000 -15000 43000 32000
It has been found that the Round process is occurring loss and the management of the
company has decided to reduce the level of the loss through discontinued the operations and
the manufacturing process of Round (Zimmerman and Yahya-Zadeh, 2011).
It has been evaluated that if the operations of the company i.e. sales and the
manufacturing process of the company would be stopped than also the fixed cost of the
process would occur and in that situation, the ,loss of the company would enhance from -
15000 to -61000. The calculations are given below:
Income / expenses Total, RM
Round,
RM
Traingular,
RM
Square,
RM
Sales 860000 500000 360000
Less: Variable expenses -350000 -200000 -150000
Contribution margin 510000 300000 210000
Less: Fixed expenses
Advertising 175000 41000 110000 65000
Depreciation 95000 20000 40000 35000
Line supervisor's salary 13000 7000 6000
Gen factory overhead 172000 100000 72000
Total fixed expenses 455000 61000 257000 178000
Net operating income /
loss 55000 -61000 43000 32000
Thus, through this analysis, it is suggested to the company to not to discontinue the
sales and manufacturing of the company rather the company must adopt new strategies
through which the loss of the process could be reduce and the profitability position of the
company could be improved (Weston and Brigham, 2015).
Recasting the above data:
4
Line supervisor's salary 19000 6000 7000 6000
Gen factory overhead 200000 28000 100000 72000
Total fixed expenses 530000 95000 257000 178000
Net operating income /
loss 60000 -15000 43000 32000
It has been found that the Round process is occurring loss and the management of the
company has decided to reduce the level of the loss through discontinued the operations and
the manufacturing process of Round (Zimmerman and Yahya-Zadeh, 2011).
It has been evaluated that if the operations of the company i.e. sales and the
manufacturing process of the company would be stopped than also the fixed cost of the
process would occur and in that situation, the ,loss of the company would enhance from -
15000 to -61000. The calculations are given below:
Income / expenses Total, RM
Round,
RM
Traingular,
RM
Square,
RM
Sales 860000 500000 360000
Less: Variable expenses -350000 -200000 -150000
Contribution margin 510000 300000 210000
Less: Fixed expenses
Advertising 175000 41000 110000 65000
Depreciation 95000 20000 40000 35000
Line supervisor's salary 13000 7000 6000
Gen factory overhead 172000 100000 72000
Total fixed expenses 455000 61000 257000 178000
Net operating income /
loss 55000 -61000 43000 32000
Thus, through this analysis, it is suggested to the company to not to discontinue the
sales and manufacturing of the company rather the company must adopt new strategies
through which the loss of the process could be reduce and the profitability position of the
company could be improved (Weston and Brigham, 2015).
Recasting the above data:
Paraphrase This Document
Need a fresh take? Get an instant paraphrase of this document with our AI Paraphraser
Managerial Accounting
5
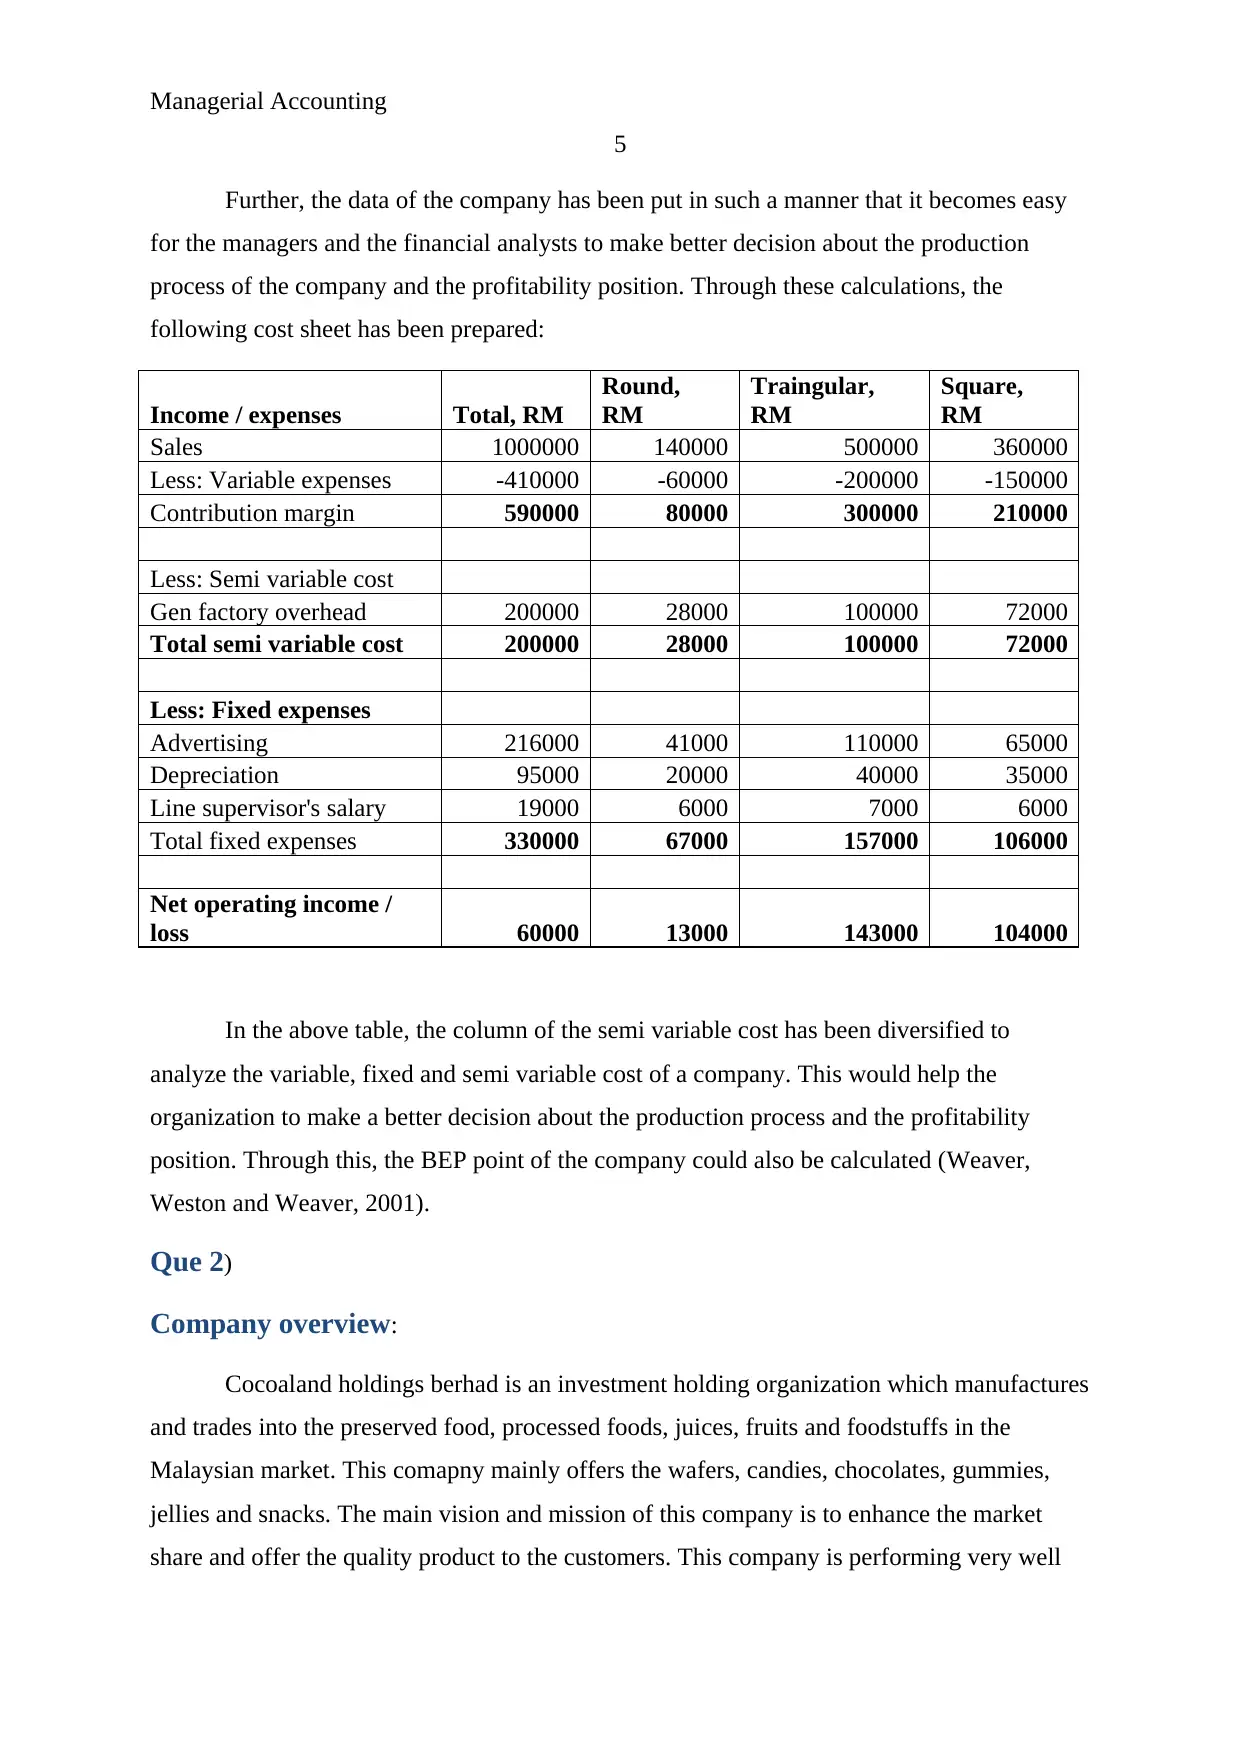
Further, the data of the company has been put in such a manner that it becomes easy
for the managers and the financial analysts to make better decision about the production
process of the company and the profitability position. Through these calculations, the
following cost sheet has been prepared:
Income / expenses Total, RM
Round,
RM
Traingular,
RM
Square,
RM
Sales 1000000 140000 500000 360000
Less: Variable expenses -410000 -60000 -200000 -150000
Contribution margin 590000 80000 300000 210000
Less: Semi variable cost
Gen factory overhead 200000 28000 100000 72000
Total semi variable cost 200000 28000 100000 72000
Less: Fixed expenses
Advertising 216000 41000 110000 65000
Depreciation 95000 20000 40000 35000
Line supervisor's salary 19000 6000 7000 6000
Total fixed expenses 330000 67000 157000 106000
Net operating income /
loss 60000 13000 143000 104000
In the above table, the column of the semi variable cost has been diversified to
analyze the variable, fixed and semi variable cost of a company. This would help the
organization to make a better decision about the production process and the profitability
position. Through this, the BEP point of the company could also be calculated (Weaver,
Weston and Weaver, 2001).
Que 2)
Company overview:
Cocoaland holdings berhad is an investment holding organization which manufactures
and trades into the preserved food, processed foods, juices, fruits and foodstuffs in the
Malaysian market. This comapny mainly offers the wafers, candies, chocolates, gummies,
jellies and snacks. The main vision and mission of this company is to enhance the market
share and offer the quality product to the customers. This company is performing very well
5
Further, the data of the company has been put in such a manner that it becomes easy
for the managers and the financial analysts to make better decision about the production
process of the company and the profitability position. Through these calculations, the
following cost sheet has been prepared:
Income / expenses Total, RM
Round,
RM
Traingular,
RM
Square,
RM
Sales 1000000 140000 500000 360000
Less: Variable expenses -410000 -60000 -200000 -150000
Contribution margin 590000 80000 300000 210000
Less: Semi variable cost
Gen factory overhead 200000 28000 100000 72000
Total semi variable cost 200000 28000 100000 72000
Less: Fixed expenses
Advertising 216000 41000 110000 65000
Depreciation 95000 20000 40000 35000
Line supervisor's salary 19000 6000 7000 6000
Total fixed expenses 330000 67000 157000 106000
Net operating income /
loss 60000 13000 143000 104000
In the above table, the column of the semi variable cost has been diversified to
analyze the variable, fixed and semi variable cost of a company. This would help the
organization to make a better decision about the production process and the profitability
position. Through this, the BEP point of the company could also be calculated (Weaver,
Weston and Weaver, 2001).
Que 2)
Company overview:
Cocoaland holdings berhad is an investment holding organization which manufactures
and trades into the preserved food, processed foods, juices, fruits and foodstuffs in the
Malaysian market. This comapny mainly offers the wafers, candies, chocolates, gummies,
jellies and snacks. The main vision and mission of this company is to enhance the market
share and offer the quality product to the customers. This company is performing very well
Managerial Accounting
6
into Malaysian market and also trying to diversify its market into various new markets
(Home, 2017).
Through the mission statement of the company, it has been found that the main
mission of the company is to grab the international market as well and offer the food to the
international client. The vision of the company is to offer the best of the CSR policies to
manage and maintain the performance and the position of the company (Morningstar, 2017).
The main vision and mission of this company is to offer the quality product to the customers
and enhance the market share. This company is performing very well into Malaysian market
and trying to diversify its market into various new markets.
Objective of the report:
The main objective behind this report is to manage and maintain the performance and
the better position of a company in terms of the finance. Mainly this report has been prepared
to analyze the position of the company so that a better decision could be prepared for the
investors of the company to invest more into the company or not. The main objective of this
report is to analyze the position of the company in terms of the liquid position, solvency
position, profitability position and capital structure of the company.
Financial statement analysis:
Financial statement analysis is a process in which the financial statement of a
company i.e. profit and loss account, balance sheet and the cash flow statement of a company
is analyzed and the performance of a company is analyzed. Financial statement analysis is a
study which is done over a company by its financial manager, financial analyst and the
investors of the company to make decisions about the company (Hillier, Grinblatt and
Titman, 2011).
Financial manager uses this technique to identify the position and the performance of
the company so that the changes could be done into the company to make the financial
position of the company strong whereas Financial analyst and the investors use this technique
to identify the profitability and the performance of the company so that the investment and
divestment decision could be made to enhance the worth of the amount (Higgins, 2012).
In this report, financial statement analysis has been done over COCOALAND
HOLDINGS BERHAD to identify the performance, profitability and the position of the
⊘ This is a preview!⊘
Do you want full access?
Subscribe today to unlock all pages.
Trusted by 1+ million students worldwide
Managerial Accounting
7
company. In this report, the ratio analysis study has been performed over the financial data of
the company of last 2 years to analyze and identify the changes into the company and also for
identifying the current profitability, liquidity, solvency and the capital structure position. The
study of ratio analysis of the COCOALAND HOLDINGS BERHAD is as follows:
Liquidity:
Liquidity position is the type of ratio analysis which depict about the position of the
debt position of the company. Liquidity position depicts that whether it is easy or tough for
the company to pay the entire short term debts. This analysis helps the company to manage
the position in which the entire debt obligation of the company could be managed. Liquidity
ratios of a company could be analyzed through analyzing the current ratio position and the
quick ratio position (Glajnaric, 2016).
Current ratio is a simple calculation which estimates that whether the organization
would be able to pay all the debts which would be due in one year from assets which is also
expected to turn into cash in a year. Further, the quick ratio of a company is a simple
calculation which estimates that whether the organization would be able to pay all the debts
which would be due in one year from assets except the stock and raw material which is could
not be turned into cash in a year.
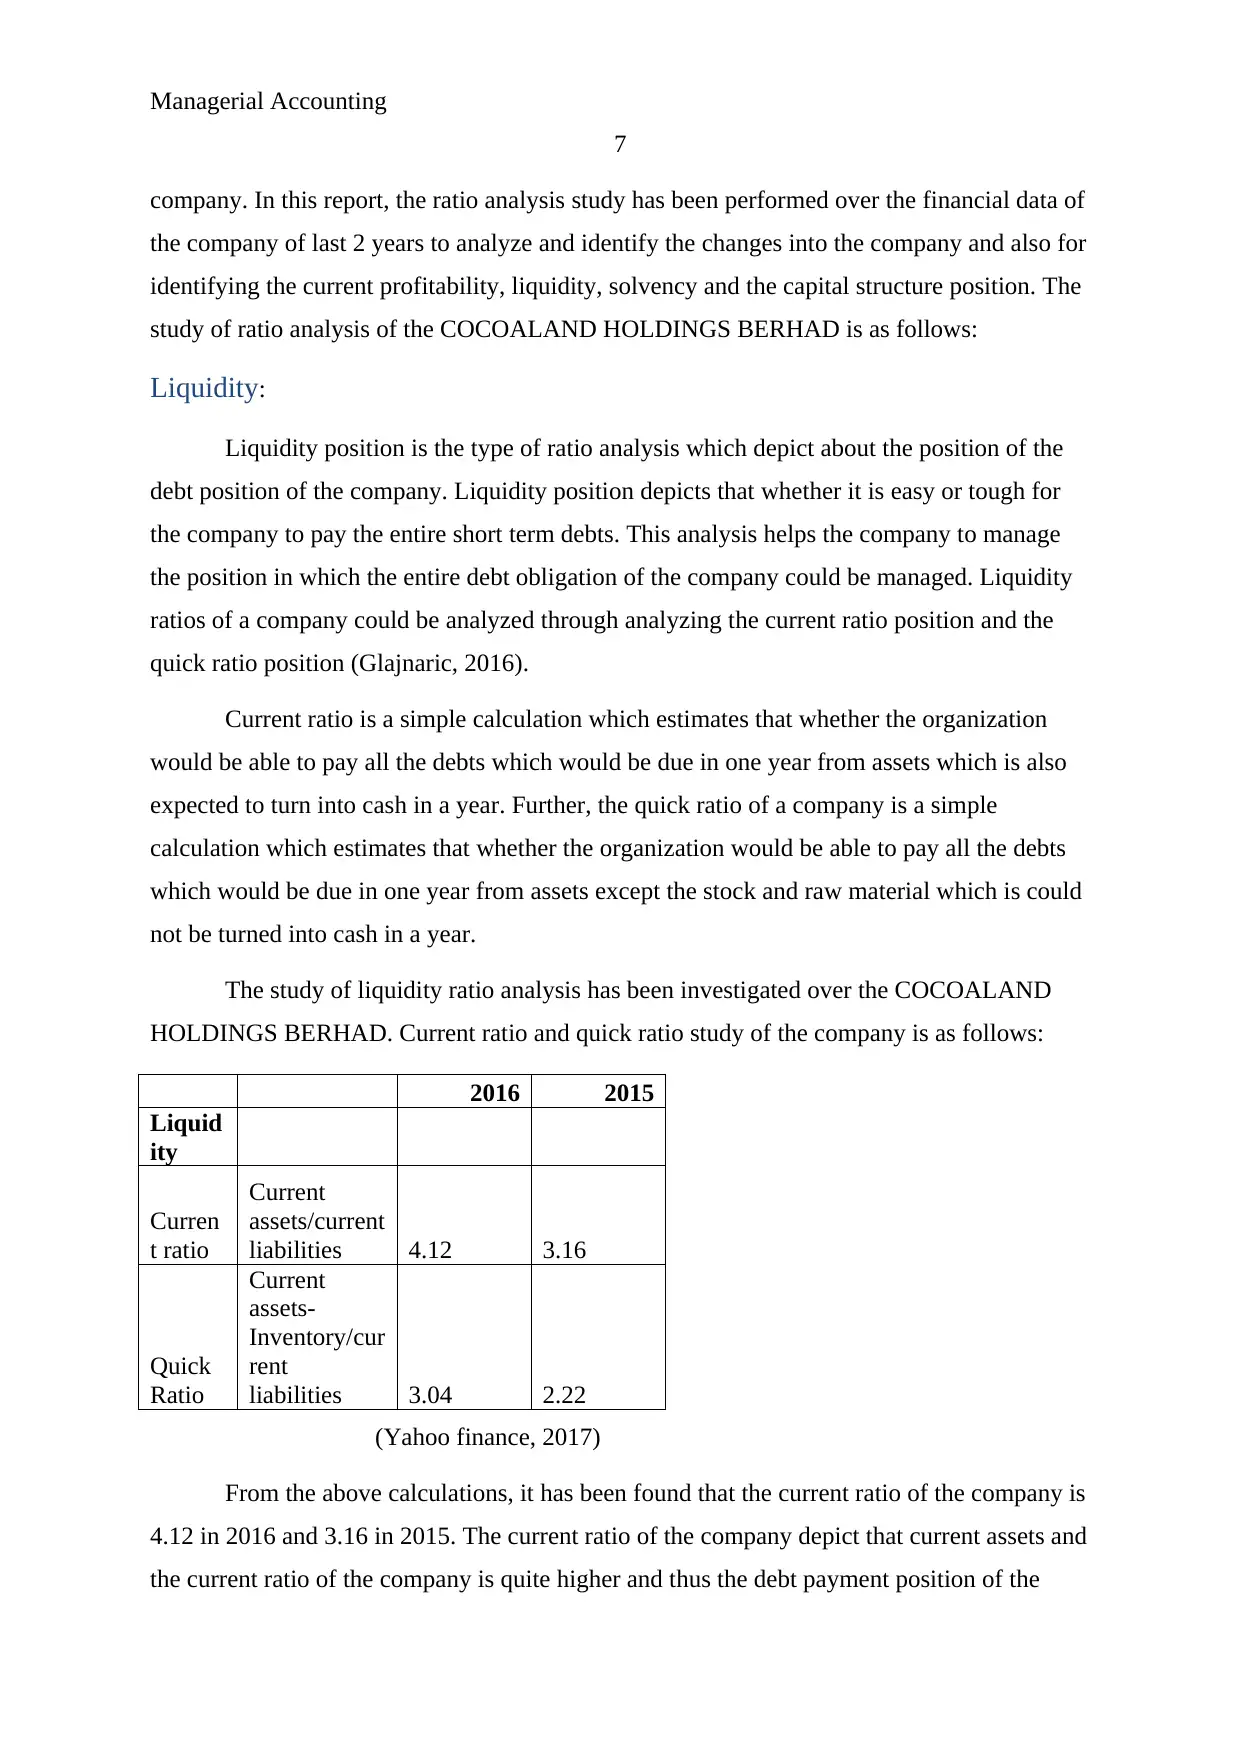
The study of liquidity ratio analysis has been investigated over the COCOALAND
HOLDINGS BERHAD. Current ratio and quick ratio study of the company is as follows:
2016 2015
Liquid
ity
Curren
t ratio
Current
assets/current
liabilities 4.12 3.16
Quick
Ratio
Current
assets-
Inventory/cur
rent
liabilities 3.04 2.22
(Yahoo finance, 2017)
From the above calculations, it has been found that the current ratio of the company is
4.12 in 2016 and 3.16 in 2015. The current ratio of the company depict that current assets and
the current ratio of the company is quite higher and thus the debt payment position of the
7
company. In this report, the ratio analysis study has been performed over the financial data of
the company of last 2 years to analyze and identify the changes into the company and also for
identifying the current profitability, liquidity, solvency and the capital structure position. The
study of ratio analysis of the COCOALAND HOLDINGS BERHAD is as follows:
Liquidity:
Liquidity position is the type of ratio analysis which depict about the position of the
debt position of the company. Liquidity position depicts that whether it is easy or tough for
the company to pay the entire short term debts. This analysis helps the company to manage
the position in which the entire debt obligation of the company could be managed. Liquidity
ratios of a company could be analyzed through analyzing the current ratio position and the
quick ratio position (Glajnaric, 2016).
Current ratio is a simple calculation which estimates that whether the organization
would be able to pay all the debts which would be due in one year from assets which is also
expected to turn into cash in a year. Further, the quick ratio of a company is a simple
calculation which estimates that whether the organization would be able to pay all the debts
which would be due in one year from assets except the stock and raw material which is could
not be turned into cash in a year.
The study of liquidity ratio analysis has been investigated over the COCOALAND
HOLDINGS BERHAD. Current ratio and quick ratio study of the company is as follows:
2016 2015
Liquid
ity
Curren
t ratio
Current
assets/current
liabilities 4.12 3.16
Quick
Ratio
Current
assets-
Inventory/cur
rent
liabilities 3.04 2.22
(Yahoo finance, 2017)
From the above calculations, it has been found that the current ratio of the company is
4.12 in 2016 and 3.16 in 2015. The current ratio of the company depict that current assets and
the current ratio of the company is quite higher and thus the debt payment position of the
Paraphrase This Document
Need a fresh take? Get an instant paraphrase of this document with our AI Paraphraser
Managerial Accounting
8
company is quite good but at the same time the required assets is quite higher and due to
which the cost of the company has became very higher. The ideal ratio of the organization
must be 1.75:1. The company is required to manage the level of the current assets and the
current liabilities to manage the risk and the cost of the company (Elmuti and Kathawala,
2001).
From the above calculations, it has been found that the quick ratio of the company is
3.04 in 2016 and 2.22 in 2015. The quick ratio of the company depict that quick assets and
the quick ratio of the company is quite higher and thus the debt payment position of the
company is quite good but at the same time the required assets is quite higher and due to
which the cost of the company has became very higher (Gitman and Zutter, 2012). The ideal
ratio of the organization must be 1.33:1. The company is required to manage the level of the
quick assets and the current liabilities to manage the risk and the cost of the company.
Profitability:
Profitability position is the type of ratio analysis which depict about the position of
the profit of the company. Profitability position depicts about the position of the profits of the
company. This analysis helps the company to manage the position in which the entire profits
of the company are managed. Profitability ratios of a company could be analyzed through
analyzing the gross profit, net profit, sales, and equity position of a company.
Net margin ratio is a simple calculation which estimates about the total profit of the
company in context of the sales. Further, the net profit margin ratio of a company is a simple
calculation which estimates that what is the total profit of the company in terms of the total
equity of the company (Malaysia stock biz, 2017).
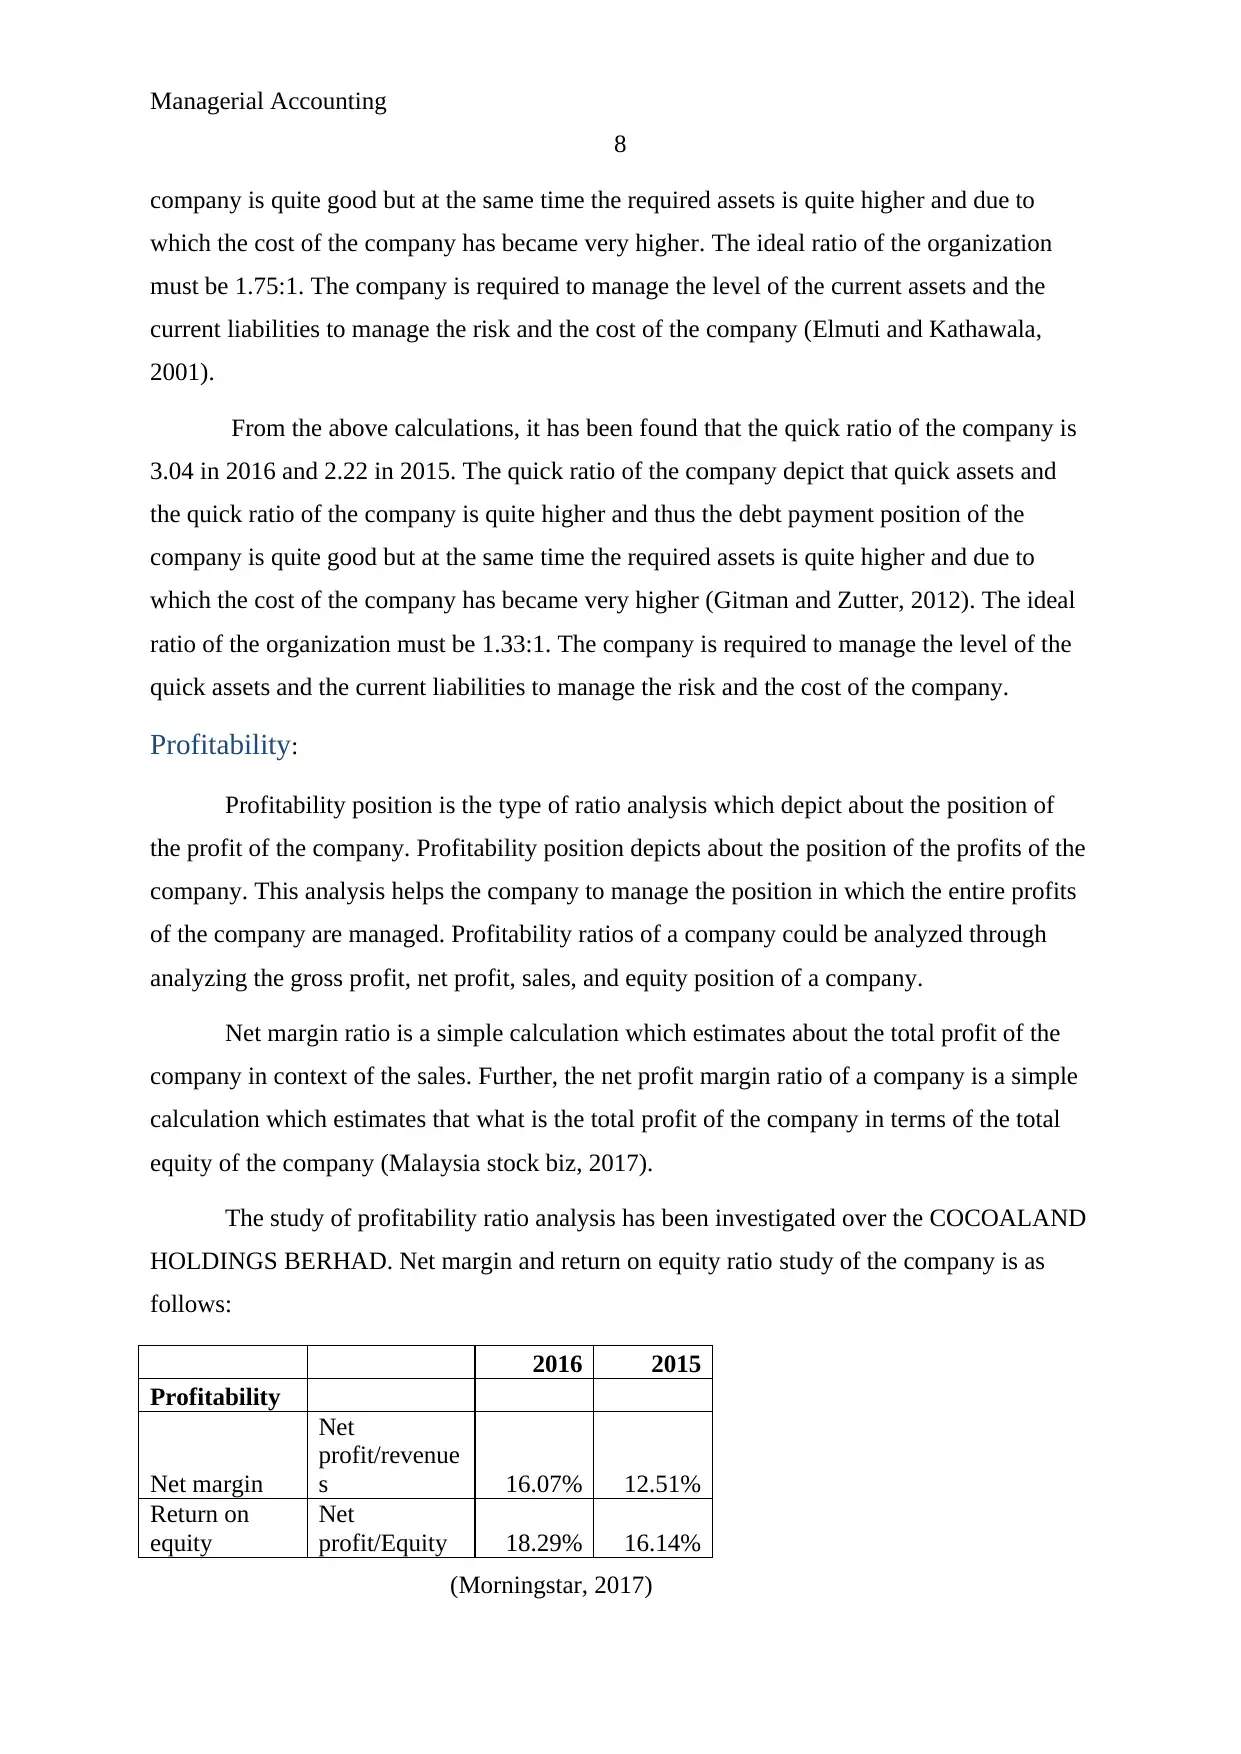
The study of profitability ratio analysis has been investigated over the COCOALAND
HOLDINGS BERHAD. Net margin and return on equity ratio study of the company is as
follows:
2016 2015
Profitability
Net margin
Net
profit/revenue
s 16.07% 12.51%
Return on
equity
Net
profit/Equity 18.29% 16.14%
(Morningstar, 2017)
8
company is quite good but at the same time the required assets is quite higher and due to
which the cost of the company has became very higher. The ideal ratio of the organization
must be 1.75:1. The company is required to manage the level of the current assets and the
current liabilities to manage the risk and the cost of the company (Elmuti and Kathawala,
2001).
From the above calculations, it has been found that the quick ratio of the company is
3.04 in 2016 and 2.22 in 2015. The quick ratio of the company depict that quick assets and
the quick ratio of the company is quite higher and thus the debt payment position of the
company is quite good but at the same time the required assets is quite higher and due to
which the cost of the company has became very higher (Gitman and Zutter, 2012). The ideal
ratio of the organization must be 1.33:1. The company is required to manage the level of the
quick assets and the current liabilities to manage the risk and the cost of the company.
Profitability:
Profitability position is the type of ratio analysis which depict about the position of
the profit of the company. Profitability position depicts about the position of the profits of the
company. This analysis helps the company to manage the position in which the entire profits
of the company are managed. Profitability ratios of a company could be analyzed through
analyzing the gross profit, net profit, sales, and equity position of a company.
Net margin ratio is a simple calculation which estimates about the total profit of the
company in context of the sales. Further, the net profit margin ratio of a company is a simple
calculation which estimates that what is the total profit of the company in terms of the total
equity of the company (Malaysia stock biz, 2017).
The study of profitability ratio analysis has been investigated over the COCOALAND
HOLDINGS BERHAD. Net margin and return on equity ratio study of the company is as
follows:
2016 2015
Profitability
Net margin
Net
profit/revenue
s 16.07% 12.51%
Return on
equity
Net
profit/Equity 18.29% 16.14%
(Morningstar, 2017)
Managerial Accounting
9
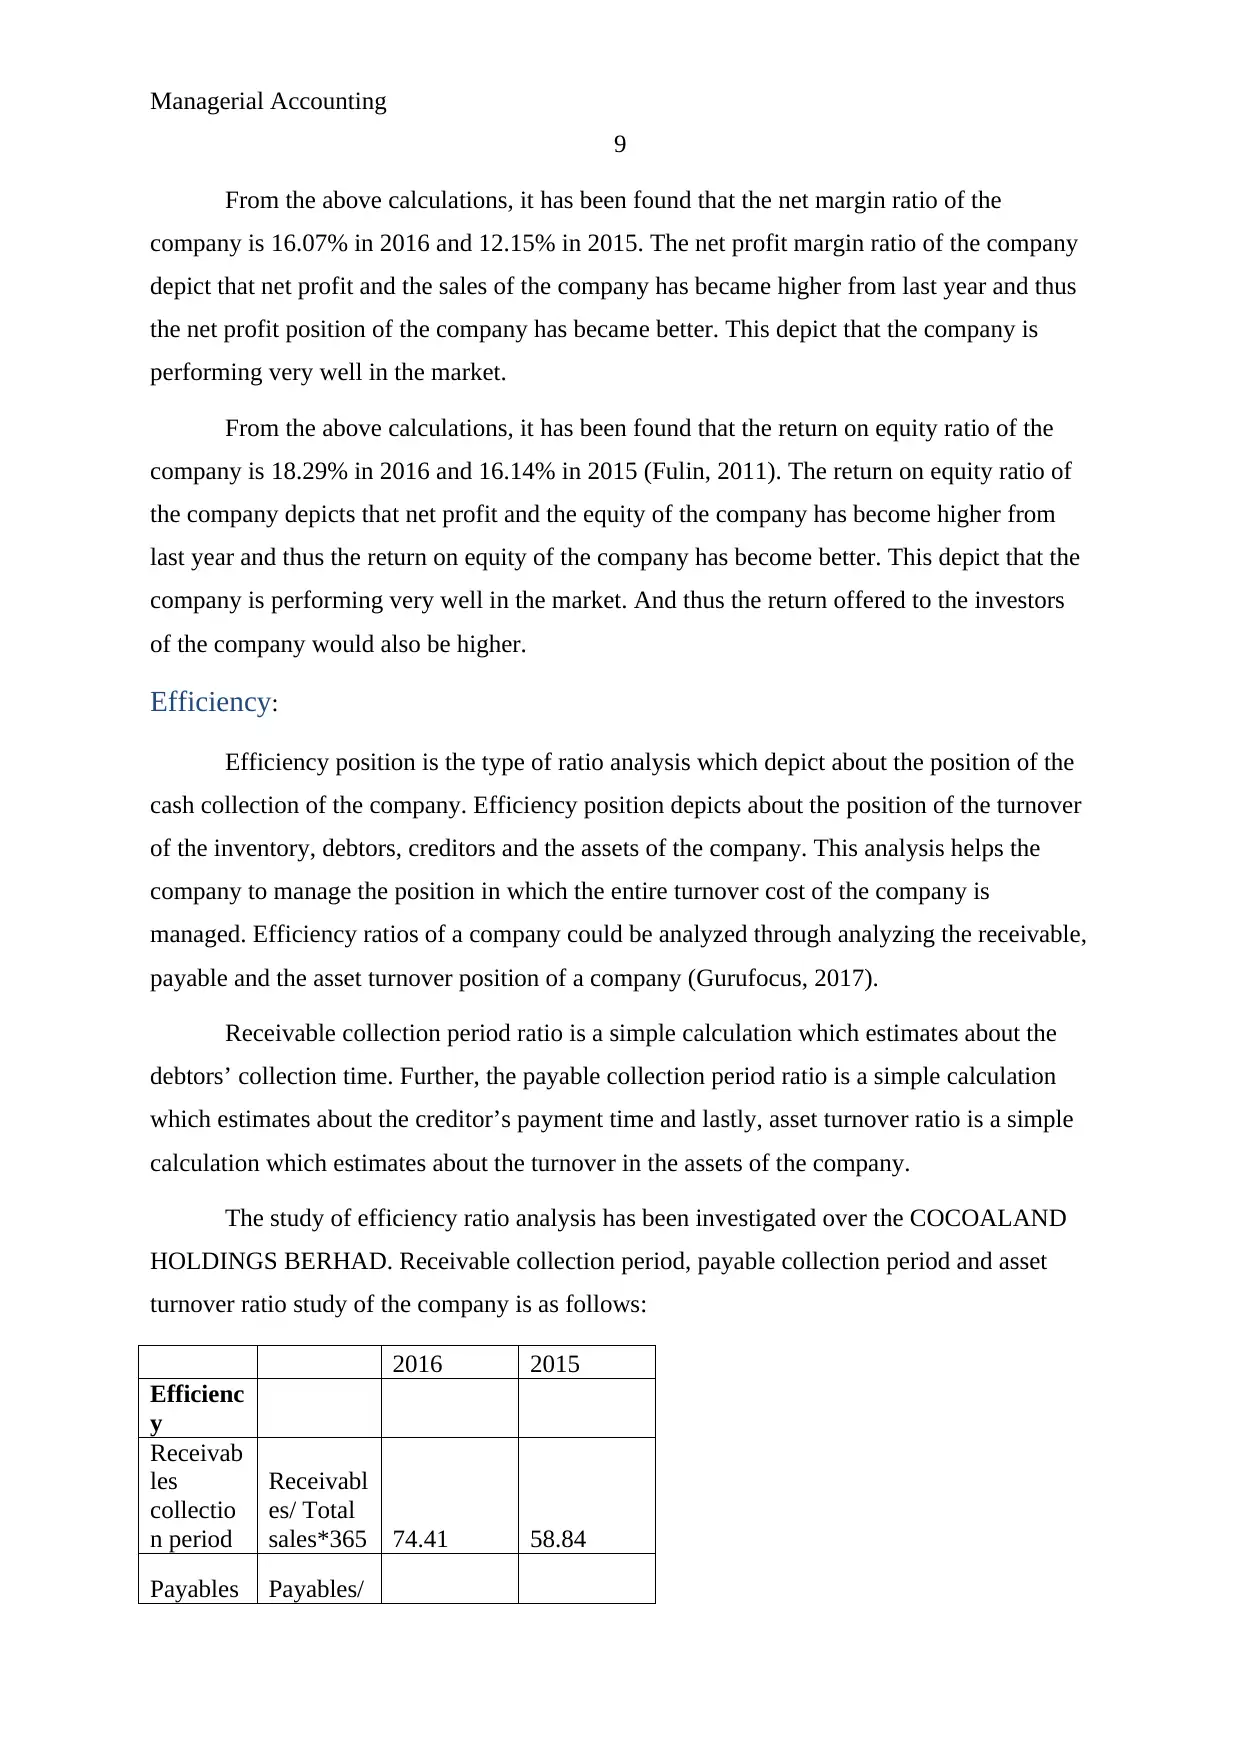
From the above calculations, it has been found that the net margin ratio of the
company is 16.07% in 2016 and 12.15% in 2015. The net profit margin ratio of the company
depict that net profit and the sales of the company has became higher from last year and thus
the net profit position of the company has became better. This depict that the company is
performing very well in the market.
From the above calculations, it has been found that the return on equity ratio of the
company is 18.29% in 2016 and 16.14% in 2015 (Fulin, 2011). The return on equity ratio of
the company depicts that net profit and the equity of the company has become higher from
last year and thus the return on equity of the company has become better. This depict that the
company is performing very well in the market. And thus the return offered to the investors
of the company would also be higher.
Efficiency:
Efficiency position is the type of ratio analysis which depict about the position of the
cash collection of the company. Efficiency position depicts about the position of the turnover
of the inventory, debtors, creditors and the assets of the company. This analysis helps the
company to manage the position in which the entire turnover cost of the company is
managed. Efficiency ratios of a company could be analyzed through analyzing the receivable,
payable and the asset turnover position of a company (Gurufocus, 2017).
Receivable collection period ratio is a simple calculation which estimates about the
debtors’ collection time. Further, the payable collection period ratio is a simple calculation
which estimates about the creditor’s payment time and lastly, asset turnover ratio is a simple
calculation which estimates about the turnover in the assets of the company.
The study of efficiency ratio analysis has been investigated over the COCOALAND
HOLDINGS BERHAD. Receivable collection period, payable collection period and asset
turnover ratio study of the company is as follows:
2016 2015
Efficienc
y
Receivab
les
collectio
n period
Receivabl
es/ Total
sales*365 74.41 58.84
Payables Payables/
9
From the above calculations, it has been found that the net margin ratio of the
company is 16.07% in 2016 and 12.15% in 2015. The net profit margin ratio of the company
depict that net profit and the sales of the company has became higher from last year and thus
the net profit position of the company has became better. This depict that the company is
performing very well in the market.
From the above calculations, it has been found that the return on equity ratio of the
company is 18.29% in 2016 and 16.14% in 2015 (Fulin, 2011). The return on equity ratio of
the company depicts that net profit and the equity of the company has become higher from
last year and thus the return on equity of the company has become better. This depict that the
company is performing very well in the market. And thus the return offered to the investors
of the company would also be higher.
Efficiency:
Efficiency position is the type of ratio analysis which depict about the position of the
cash collection of the company. Efficiency position depicts about the position of the turnover
of the inventory, debtors, creditors and the assets of the company. This analysis helps the
company to manage the position in which the entire turnover cost of the company is
managed. Efficiency ratios of a company could be analyzed through analyzing the receivable,
payable and the asset turnover position of a company (Gurufocus, 2017).
Receivable collection period ratio is a simple calculation which estimates about the
debtors’ collection time. Further, the payable collection period ratio is a simple calculation
which estimates about the creditor’s payment time and lastly, asset turnover ratio is a simple
calculation which estimates about the turnover in the assets of the company.
The study of efficiency ratio analysis has been investigated over the COCOALAND
HOLDINGS BERHAD. Receivable collection period, payable collection period and asset
turnover ratio study of the company is as follows:
2016 2015
Efficienc
y
Receivab
les
collectio
n period
Receivabl
es/ Total
sales*365 74.41 58.84
Payables Payables/
⊘ This is a preview!⊘
Do you want full access?
Subscribe today to unlock all pages.
Trusted by 1+ million students worldwide
Managerial Accounting
10
collectio
n period
Cost of
sales*365 54.46 48.94
Asset
turnover
ratio
Total
sales/
Total
assets 0.94 1.04
(Malaysia Stock biz, 2017)
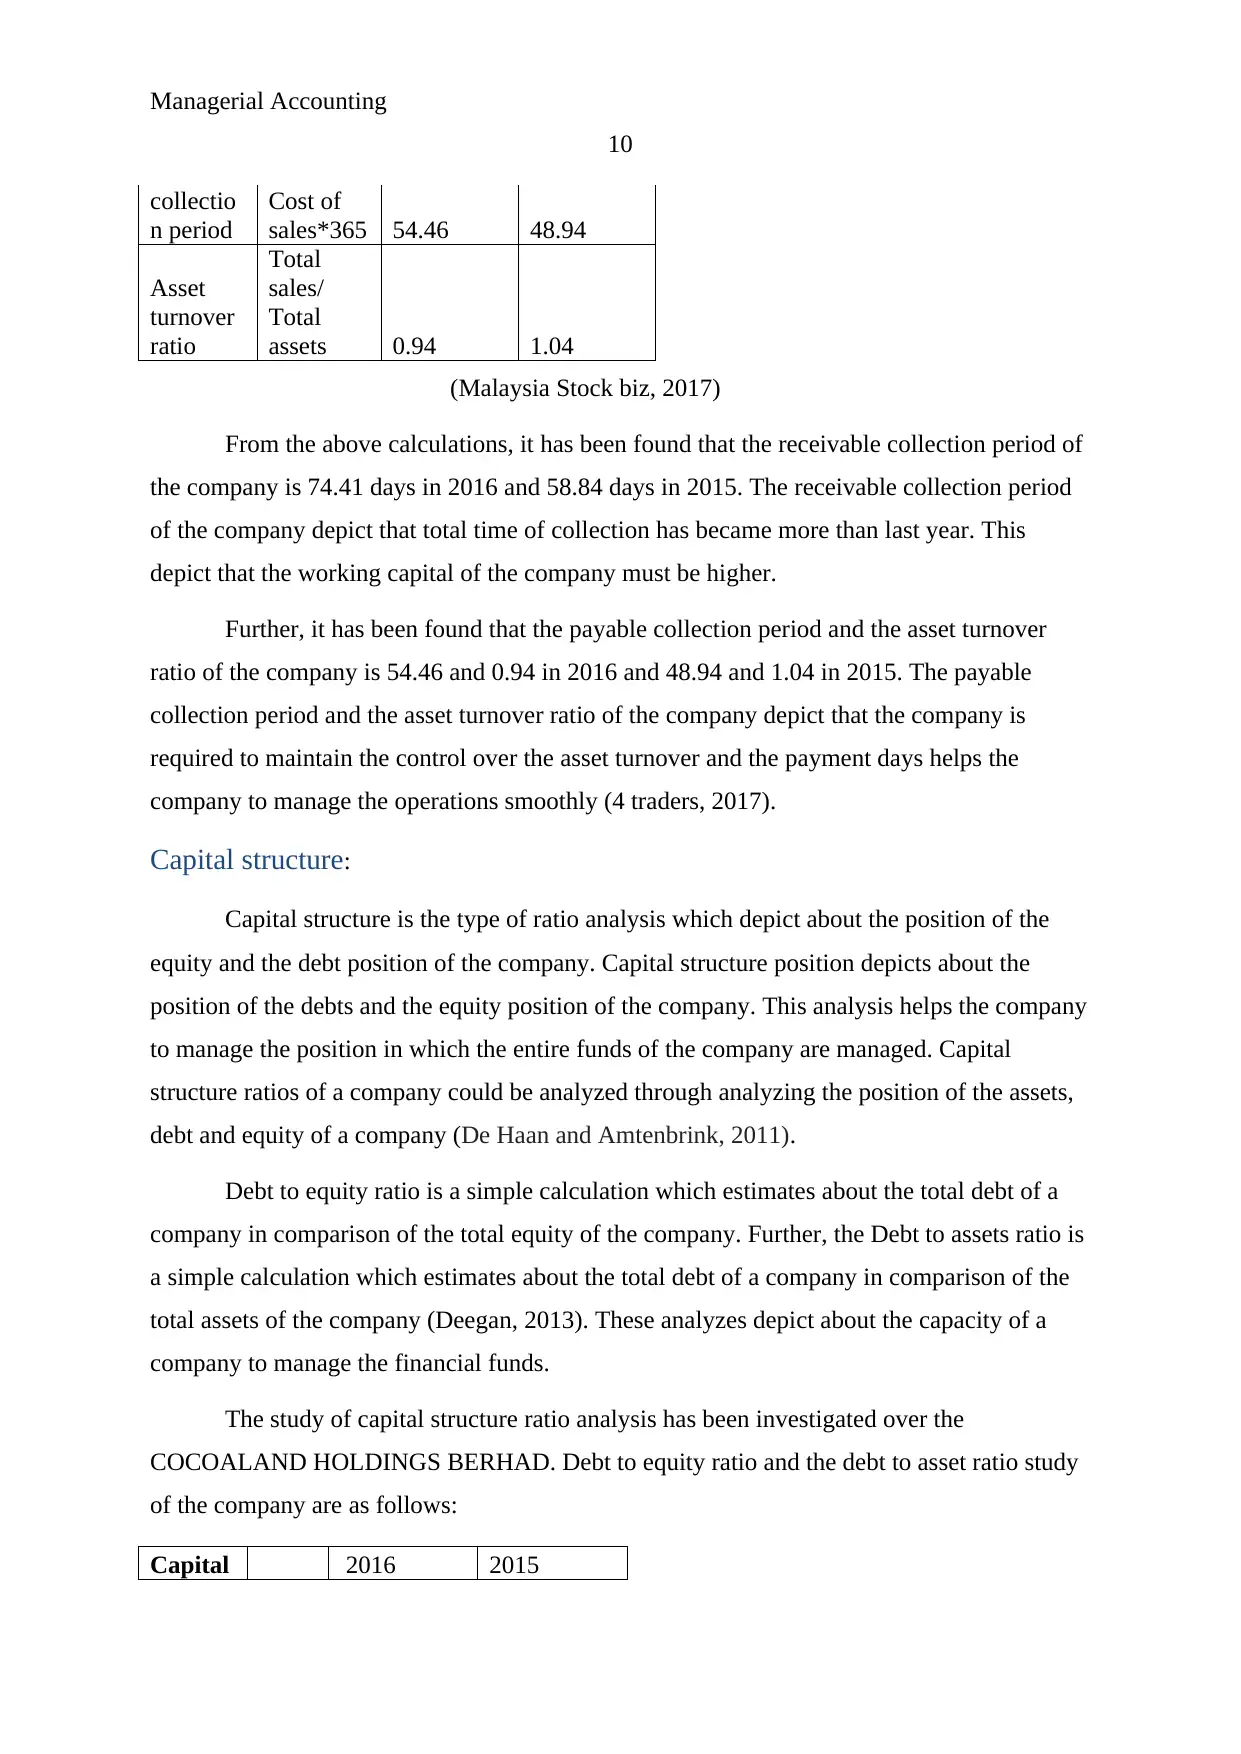
From the above calculations, it has been found that the receivable collection period of
the company is 74.41 days in 2016 and 58.84 days in 2015. The receivable collection period
of the company depict that total time of collection has became more than last year. This
depict that the working capital of the company must be higher.
Further, it has been found that the payable collection period and the asset turnover
ratio of the company is 54.46 and 0.94 in 2016 and 48.94 and 1.04 in 2015. The payable
collection period and the asset turnover ratio of the company depict that the company is
required to maintain the control over the asset turnover and the payment days helps the
company to manage the operations smoothly (4 traders, 2017).
Capital structure:
Capital structure is the type of ratio analysis which depict about the position of the
equity and the debt position of the company. Capital structure position depicts about the
position of the debts and the equity position of the company. This analysis helps the company
to manage the position in which the entire funds of the company are managed. Capital
structure ratios of a company could be analyzed through analyzing the position of the assets,
debt and equity of a company (De Haan and Amtenbrink, 2011).
Debt to equity ratio is a simple calculation which estimates about the total debt of a
company in comparison of the total equity of the company. Further, the Debt to assets ratio is
a simple calculation which estimates about the total debt of a company in comparison of the
total assets of the company (Deegan, 2013). These analyzes depict about the capacity of a
company to manage the financial funds.
The study of capital structure ratio analysis has been investigated over the
COCOALAND HOLDINGS BERHAD. Debt to equity ratio and the debt to asset ratio study
of the company are as follows:
Capital 2016 2015
10
collectio
n period
Cost of
sales*365 54.46 48.94
Asset
turnover
ratio
Total
sales/
Total
assets 0.94 1.04
(Malaysia Stock biz, 2017)
From the above calculations, it has been found that the receivable collection period of
the company is 74.41 days in 2016 and 58.84 days in 2015. The receivable collection period
of the company depict that total time of collection has became more than last year. This
depict that the working capital of the company must be higher.
Further, it has been found that the payable collection period and the asset turnover
ratio of the company is 54.46 and 0.94 in 2016 and 48.94 and 1.04 in 2015. The payable
collection period and the asset turnover ratio of the company depict that the company is
required to maintain the control over the asset turnover and the payment days helps the
company to manage the operations smoothly (4 traders, 2017).
Capital structure:
Capital structure is the type of ratio analysis which depict about the position of the
equity and the debt position of the company. Capital structure position depicts about the
position of the debts and the equity position of the company. This analysis helps the company
to manage the position in which the entire funds of the company are managed. Capital
structure ratios of a company could be analyzed through analyzing the position of the assets,
debt and equity of a company (De Haan and Amtenbrink, 2011).
Debt to equity ratio is a simple calculation which estimates about the total debt of a
company in comparison of the total equity of the company. Further, the Debt to assets ratio is
a simple calculation which estimates about the total debt of a company in comparison of the
total assets of the company (Deegan, 2013). These analyzes depict about the capacity of a
company to manage the financial funds.
The study of capital structure ratio analysis has been investigated over the
COCOALAND HOLDINGS BERHAD. Debt to equity ratio and the debt to asset ratio study
of the company are as follows:
Capital 2016 2015
Paraphrase This Document
Need a fresh take? Get an instant paraphrase of this document with our AI Paraphraser
Managerial Accounting
11
structu
re ratio
Debt to
Equity
Ratio
Debt/
Equit
y 0.21 0.24
Debt to
assets
Debt/
Total
asset
s 0.17 0.19
(FT, 2017)
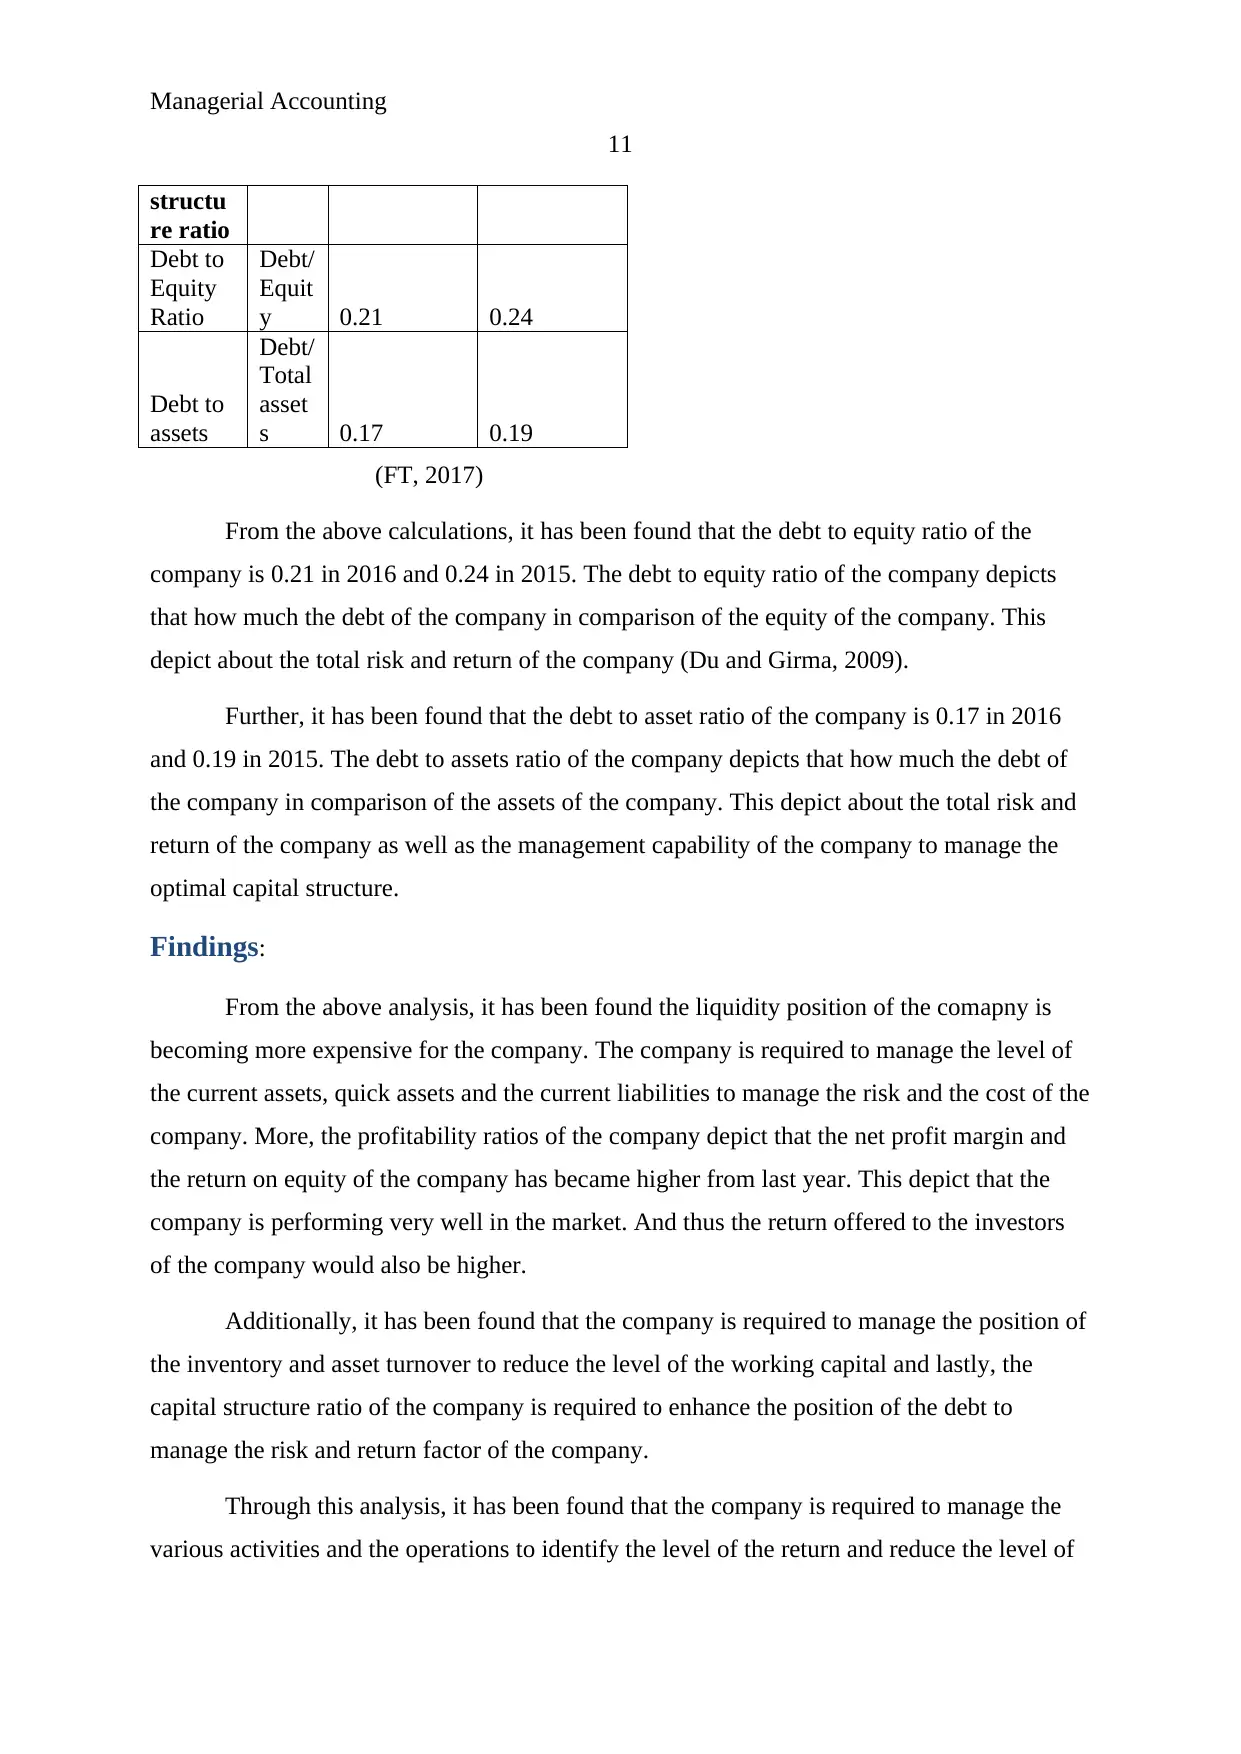
From the above calculations, it has been found that the debt to equity ratio of the
company is 0.21 in 2016 and 0.24 in 2015. The debt to equity ratio of the company depicts
that how much the debt of the company in comparison of the equity of the company. This
depict about the total risk and return of the company (Du and Girma, 2009).
Further, it has been found that the debt to asset ratio of the company is 0.17 in 2016
and 0.19 in 2015. The debt to assets ratio of the company depicts that how much the debt of
the company in comparison of the assets of the company. This depict about the total risk and
return of the company as well as the management capability of the company to manage the
optimal capital structure.
Findings:
From the above analysis, it has been found the liquidity position of the comapny is
becoming more expensive for the company. The company is required to manage the level of
the current assets, quick assets and the current liabilities to manage the risk and the cost of the
company. More, the profitability ratios of the company depict that the net profit margin and
the return on equity of the company has became higher from last year. This depict that the
company is performing very well in the market. And thus the return offered to the investors
of the company would also be higher.
Additionally, it has been found that the company is required to manage the position of
the inventory and asset turnover to reduce the level of the working capital and lastly, the
capital structure ratio of the company is required to enhance the position of the debt to
manage the risk and return factor of the company.
Through this analysis, it has been found that the company is required to manage the
various activities and the operations to identify the level of the return and reduce the level of
11
structu
re ratio
Debt to
Equity
Ratio
Debt/
Equit
y 0.21 0.24
Debt to
assets
Debt/
Total
asset
s 0.17 0.19
(FT, 2017)
From the above calculations, it has been found that the debt to equity ratio of the
company is 0.21 in 2016 and 0.24 in 2015. The debt to equity ratio of the company depicts
that how much the debt of the company in comparison of the equity of the company. This
depict about the total risk and return of the company (Du and Girma, 2009).
Further, it has been found that the debt to asset ratio of the company is 0.17 in 2016
and 0.19 in 2015. The debt to assets ratio of the company depicts that how much the debt of
the company in comparison of the assets of the company. This depict about the total risk and
return of the company as well as the management capability of the company to manage the
optimal capital structure.
Findings:
From the above analysis, it has been found the liquidity position of the comapny is
becoming more expensive for the company. The company is required to manage the level of
the current assets, quick assets and the current liabilities to manage the risk and the cost of the
company. More, the profitability ratios of the company depict that the net profit margin and
the return on equity of the company has became higher from last year. This depict that the
company is performing very well in the market. And thus the return offered to the investors
of the company would also be higher.
Additionally, it has been found that the company is required to manage the position of
the inventory and asset turnover to reduce the level of the working capital and lastly, the
capital structure ratio of the company is required to enhance the position of the debt to
manage the risk and return factor of the company.
Through this analysis, it has been found that the company is required to manage the
various activities and the operations to identify the level of the return and reduce the level of
Managerial Accounting
12
the risk. The current position of the company depict that the investors would get higher return
from the company and thus it is a good option for the investors to invest the amount in the
COCOALAND HOLDINGS BERHAD for long term as well as short term.
Conclusion:
To conclude, the liquidity position of the comapny is becoming worst day by day for
the company as well as the investors of the company. The company is required to manage the
level of the current assets, quick assets and the current liabilities to manage the risk and the
cost of the company. The profitability ratios, liquidity ratios, solvent ratios, efficiency ratios
and the capital structure ratios of the company are depicting about the different position of
the company.
Profitability ratios are depicting about the good performance of the company and
depicting that the performance and position of the company are in the favour the investors
and would offer high return to the company. Further, the efficiency ratios are depicting about
the good performance of the working capital management and depicting that the performance
and position of the company are in the favour the investors and would offer high return to the
company. Lastly, the capital structure ratios are depicting about the debt and equity position
of the company and also depict that the comapny must make a control over the performance
and the position of the company.
Through this analysis, it has been found that the company is required to manage the
various activities and the operations to identify the level of the return and reduce the level of
the risk. The current position of the company depict that the investors would get higher return
from the company and thus it is a good option for the investors to invest the amount in the
COCOALAND HOLDINGS BERHAD for long term as well as short term.
⊘ This is a preview!⊘
Do you want full access?
Subscribe today to unlock all pages.
Trusted by 1+ million students worldwide
1 out of 17
Related Documents


Your All-in-One AI-Powered Toolkit for Academic Success.
+13062052269
info@desklib.com
Available 24*7 on WhatsApp / Email
![[object Object]](/_next/static/media/star-bottom.7253800d.svg)
Unlock your academic potential
Copyright © 2020–2026 A2Z Services. All Rights Reserved. Developed and managed by ZUCOL.