Financial Analysis of Coles Group Supermarket: 2018 Performance Review
VerifiedAdded on 2022/11/13
|14
|2829
|355
Report
AI Summary
This report provides a comprehensive financial analysis of Coles Group, a major supermarket chain in Australia, focusing on its performance in 2018. The analysis includes the computation and comparison of key financial ratios such as current ratio, inventory turnover, return on equity, and debt-to-equity ratio, comparing the performance of 2018 with that of 2017. The report also examines share price movements, presenting them graphically, and computes the cost of equity using the Gordon Growth Model. Furthermore, the capital structure of the business is analyzed, highlighting the company's preference for equity over debt. The report concludes with recommendations based on the financial analysis, providing insights into the company's liquidity, profitability, solvency, and efficiency, as well as its market performance and capital structure.
Running head: FINANCE FOR BUSINESS
Finance for Business
Name of the Student:
Name of the University
Author’s Notes
Finance for Business
Name of the Student:
Name of the University
Author’s Notes
Paraphrase This Document
Need a fresh take? Get an instant paraphrase of this document with our AI Paraphraser
1
FINANCE FOR BUSINESS
Abstract
The main purpose of the assessment is to analyse the business performance of Coles Group
which operates a chain of supermarkets. The assessment would be analysing the financial
performance of the business by making comparisons with key financial ratios of the business.
The assessment also includes analysis of share price movements and graphical representation of
the share price movements of the business. The capital structure which is used by the business
would also be analysed along with computation of key financial ratios of the business.
2
FINANCE FOR BUSINESS
Table of Contents
Introduction......................................................................................................................................3
Financial Analysis of Coles Supermarket........................................................................................3
Description of the Business.........................................................................................................3
Computation of Key Financial Ratios.........................................................................................4
Graphical Representation of Share Price Movements.................................................................8
Computation of Cost of Equity....................................................................................................9
Capital Structure of the Business...............................................................................................10
Weighted Average Cost of Capital............................................................................................10
Conclusion.....................................................................................................................................11
Recommendation...........................................................................................................................11
Reference.......................................................................................................................................13
⊘ This is a preview!⊘
Do you want full access?
Subscribe today to unlock all pages.
Trusted by 1+ million students worldwide
3
FINANCE FOR BUSINESS
Introduction
The main purpose of the assessment is to analyse the performance of Coles Group which
operates as a chain of supermarkets in Australia. The analysis would be focusing on the financial
analysis of the business which would be based on the financial statement of the business for the
year 2018. In order to analyse the financial performance of the business, key financial ratios are
to be computed for a period of two years in order to make comparison between the performance
of the business between previous year and current year. The assessment would also be showing
the movements in share price of the business for the years and effectively present the same in
graph. The cost of equity of the business would be showing in the computations and the same
can also be used for computing the overall costs of capital for the business (Coles.com.au. 2019).
Moreover, the assessment would be including computation of Weighted Average Costs of The
Capital of the business. On the basis of WACC of the business, the level of risks which the
business faces and also the level of returns which is anticipated by the shareholders of the
company can be clearly estimated.
Financial Analysis of Coles Supermarket
Description of the Business
Coles Group operates a supermarket chain which operates in Australia and has its head
office in Melbourne. The company was initially established in 1914 and in current scenario owns
more stores in the country and employ more than 1,00,000 employees in the business. As per the
current market estimates, Coles Group is regarded as the second largest market which is
operating in Australia after Woolworths ltd. The business of Coles along with Woolworth
accounts for 80% of the supermarket retail business operating in the country. The core activities
Paraphrase This Document
Need a fresh take? Get an instant paraphrase of this document with our AI Paraphraser
4
FINANCE FOR BUSINESS
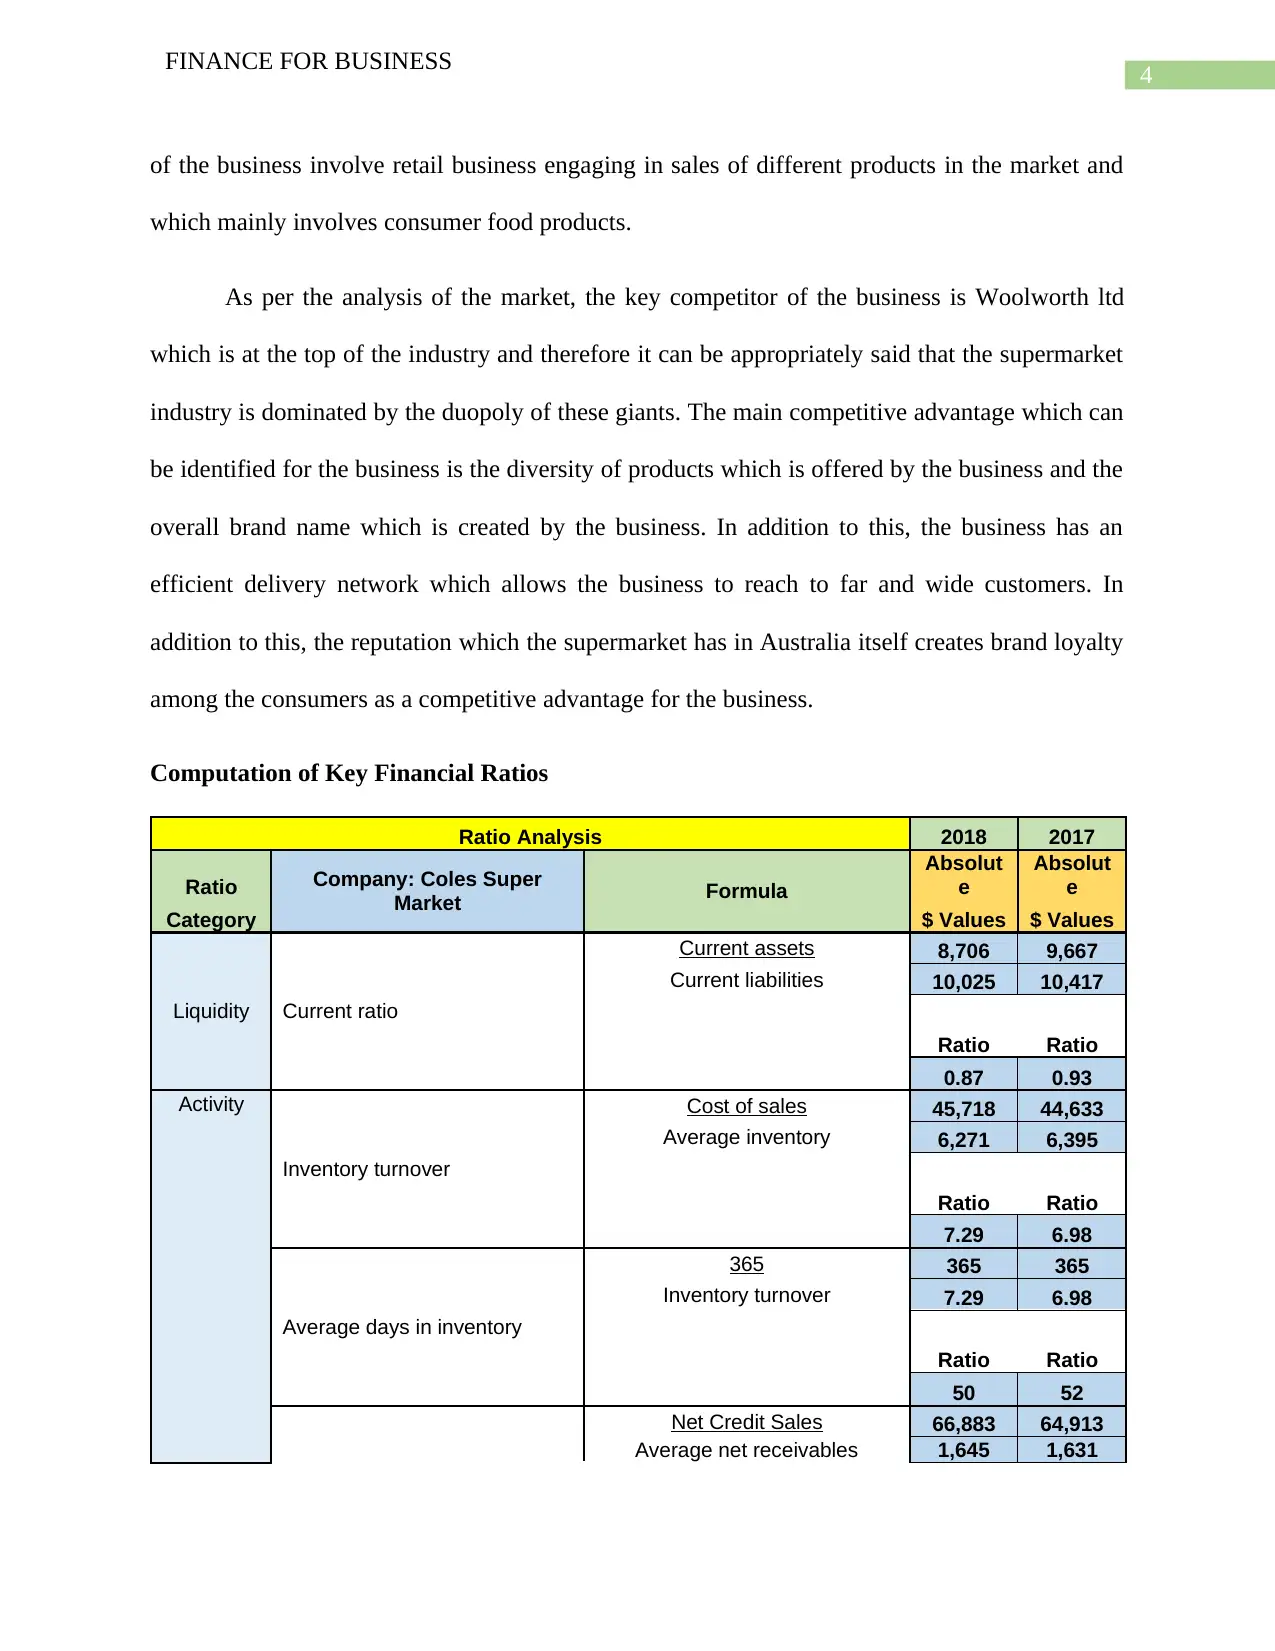
of the business involve retail business engaging in sales of different products in the market and
which mainly involves consumer food products.
As per the analysis of the market, the key competitor of the business is Woolworth ltd
which is at the top of the industry and therefore it can be appropriately said that the supermarket
industry is dominated by the duopoly of these giants. The main competitive advantage which can
be identified for the business is the diversity of products which is offered by the business and the
overall brand name which is created by the business. In addition to this, the business has an
efficient delivery network which allows the business to reach to far and wide customers. In
addition to this, the reputation which the supermarket has in Australia itself creates brand loyalty
among the consumers as a competitive advantage for the business.
Computation of Key Financial Ratios
Ratio Analysis 2018 2017
Ratio Company: Coles Super
Market Formula
Absolut
e
Absolut
e
Category $ Values $ Values
Liquidity Current ratio
Current assets 8,706 9,667
Current liabilities 10,025 10,417
Ratio Ratio
0.87 0.93
Activity
Inventory turnover
Cost of sales 45,718 44,633
Average inventory 6,271 6,395
Ratio Ratio
7.29 6.98
Average days in inventory
365 365 365
Inventory turnover 7.29 6.98
Ratio Ratio
50 52
Net Credit Sales 66,883 64,913
Average net receivables 1,645 1,631
FINANCE FOR BUSINESS
of the business involve retail business engaging in sales of different products in the market and
which mainly involves consumer food products.
As per the analysis of the market, the key competitor of the business is Woolworth ltd
which is at the top of the industry and therefore it can be appropriately said that the supermarket
industry is dominated by the duopoly of these giants. The main competitive advantage which can
be identified for the business is the diversity of products which is offered by the business and the
overall brand name which is created by the business. In addition to this, the business has an
efficient delivery network which allows the business to reach to far and wide customers. In
addition to this, the reputation which the supermarket has in Australia itself creates brand loyalty
among the consumers as a competitive advantage for the business.
Computation of Key Financial Ratios
Ratio Analysis 2018 2017
Ratio Company: Coles Super
Market Formula
Absolut
e
Absolut
e
Category $ Values $ Values
Liquidity Current ratio
Current assets 8,706 9,667
Current liabilities 10,025 10,417
Ratio Ratio
0.87 0.93
Activity
Inventory turnover
Cost of sales 45,718 44,633
Average inventory 6,271 6,395
Ratio Ratio
7.29 6.98
Average days in inventory
365 365 365
Inventory turnover 7.29 6.98
Ratio Ratio
50 52
Net Credit Sales 66,883 64,913
Average net receivables 1,645 1,631
5
FINANCE FOR BUSINESS
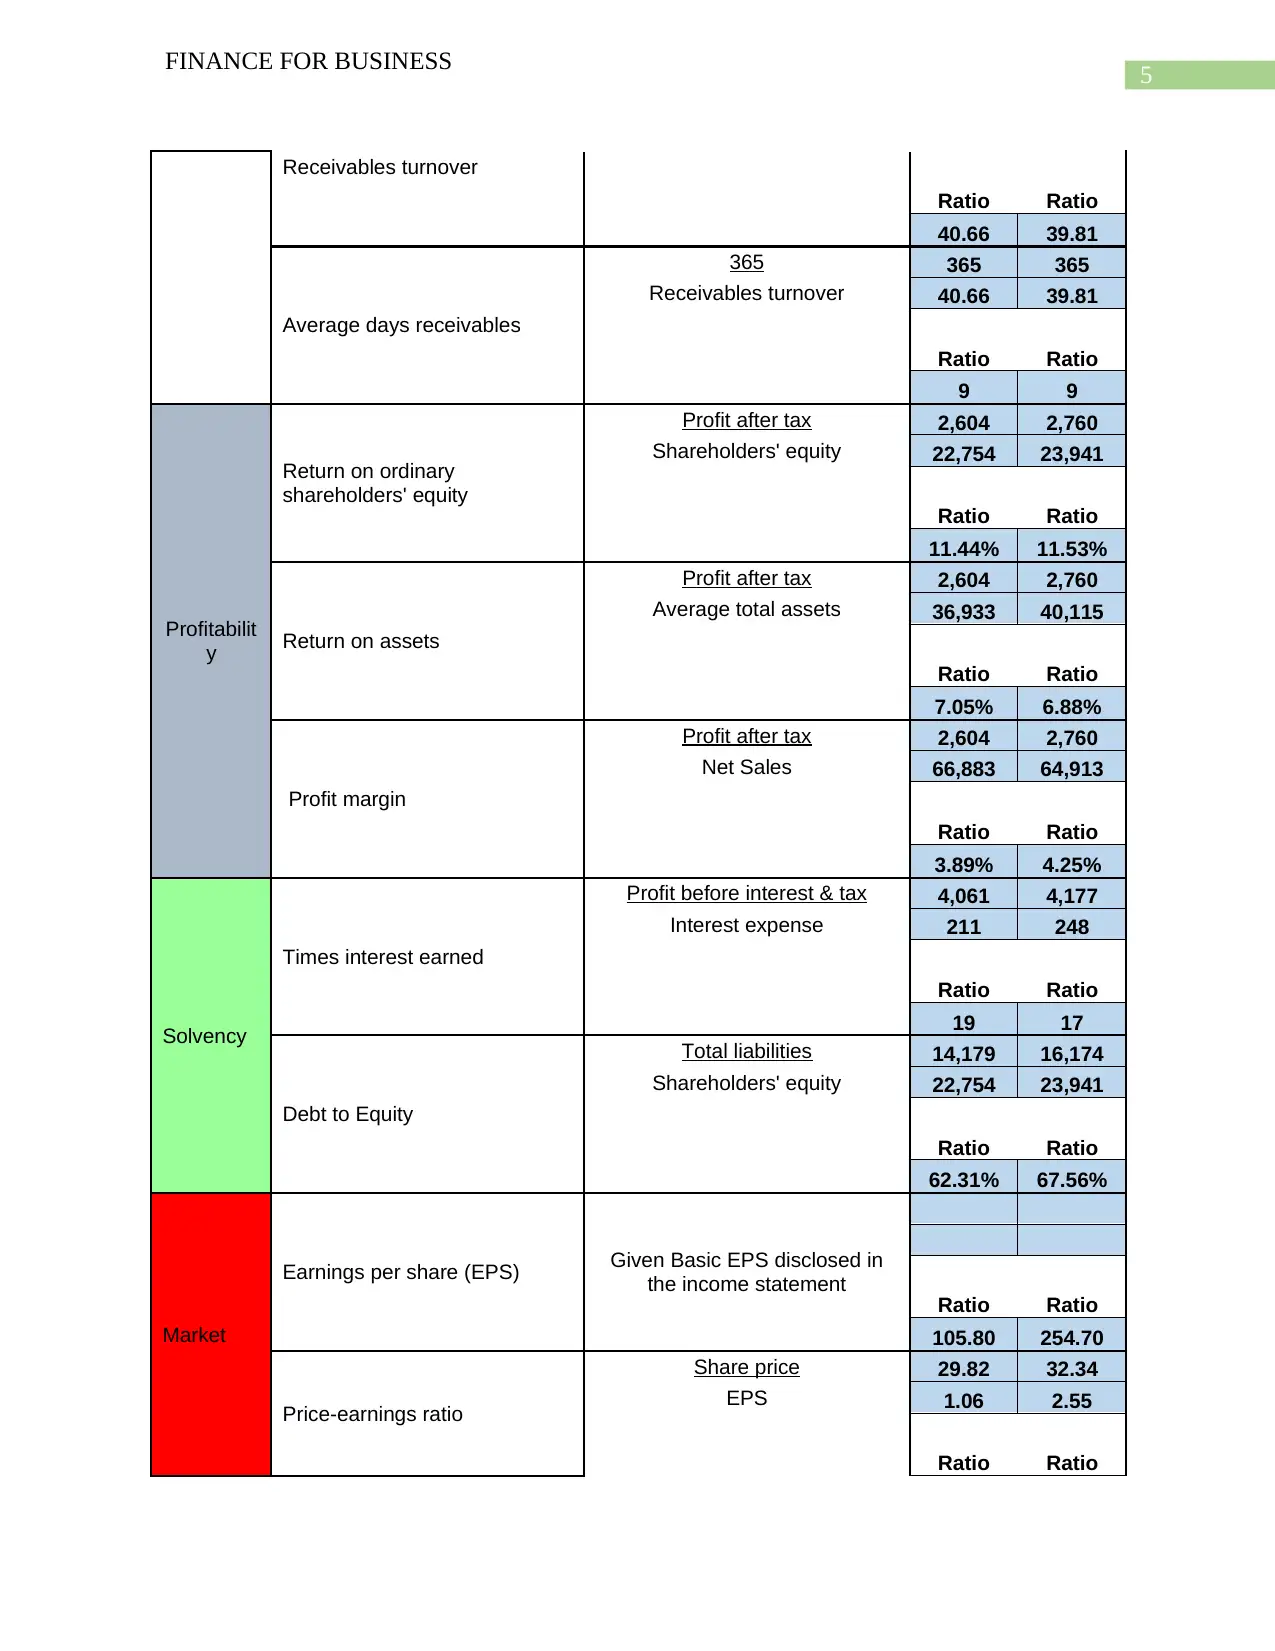
Receivables turnover
Ratio Ratio
40.66 39.81
Average days receivables
365 365 365
Receivables turnover 40.66 39.81
Ratio Ratio
9 9
Profitabilit
y
Return on ordinary
shareholders' equity
Profit after tax 2,604 2,760
Shareholders' equity 22,754 23,941
Ratio Ratio
11.44% 11.53%
Return on assets
Profit after tax 2,604 2,760
Average total assets 36,933 40,115
Ratio Ratio
7.05% 6.88%
Profit margin
Profit after tax 2,604 2,760
Net Sales 66,883 64,913
Ratio Ratio
3.89% 4.25%
Solvency
Times interest earned
Profit before interest & tax 4,061 4,177
Interest expense 211 248
Ratio Ratio
19 17
Debt to Equity
Total liabilities 14,179 16,174
Shareholders' equity 22,754 23,941
Ratio Ratio
62.31% 67.56%
Market
Earnings per share (EPS) Given Basic EPS disclosed in
the income statement
Ratio Ratio
105.80 254.70
Price-earnings ratio
Share price 29.82 32.34
EPS 1.06 2.55
Ratio Ratio
FINANCE FOR BUSINESS
Receivables turnover
Ratio Ratio
40.66 39.81
Average days receivables
365 365 365
Receivables turnover 40.66 39.81
Ratio Ratio
9 9
Profitabilit
y
Return on ordinary
shareholders' equity
Profit after tax 2,604 2,760
Shareholders' equity 22,754 23,941
Ratio Ratio
11.44% 11.53%
Return on assets
Profit after tax 2,604 2,760
Average total assets 36,933 40,115
Ratio Ratio
7.05% 6.88%
Profit margin
Profit after tax 2,604 2,760
Net Sales 66,883 64,913
Ratio Ratio
3.89% 4.25%
Solvency
Times interest earned
Profit before interest & tax 4,061 4,177
Interest expense 211 248
Ratio Ratio
19 17
Debt to Equity
Total liabilities 14,179 16,174
Shareholders' equity 22,754 23,941
Ratio Ratio
62.31% 67.56%
Market
Earnings per share (EPS) Given Basic EPS disclosed in
the income statement
Ratio Ratio
105.80 254.70
Price-earnings ratio
Share price 29.82 32.34
EPS 1.06 2.55
Ratio Ratio
⊘ This is a preview!⊘
Do you want full access?
Subscribe today to unlock all pages.
Trusted by 1+ million students worldwide
6
FINANCE FOR BUSINESS
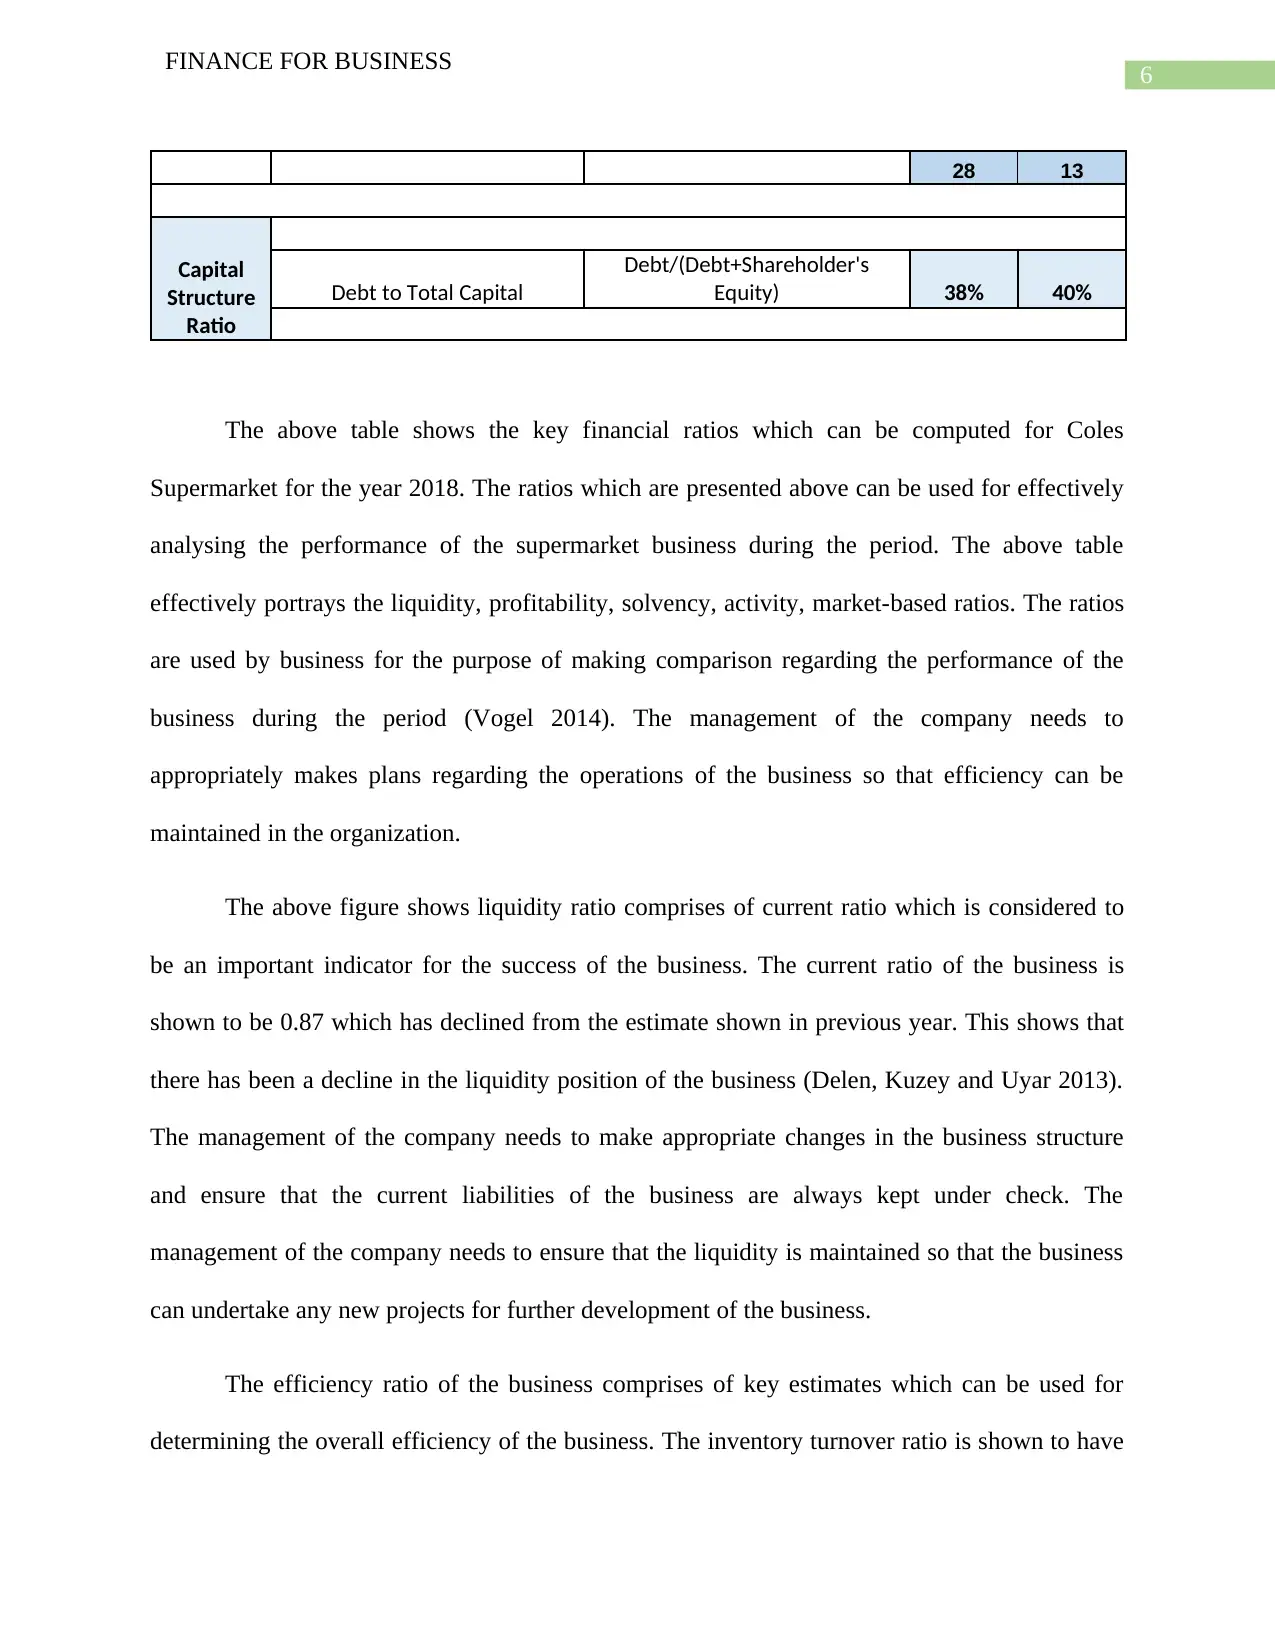
28 13
Capital
Structure
Ratio
Debt to Total Capital
Debt/(Debt+Shareholder's
Equity) 38% 40%
The above table shows the key financial ratios which can be computed for Coles
Supermarket for the year 2018. The ratios which are presented above can be used for effectively
analysing the performance of the supermarket business during the period. The above table
effectively portrays the liquidity, profitability, solvency, activity, market-based ratios. The ratios
are used by business for the purpose of making comparison regarding the performance of the
business during the period (Vogel 2014). The management of the company needs to
appropriately makes plans regarding the operations of the business so that efficiency can be
maintained in the organization.
The above figure shows liquidity ratio comprises of current ratio which is considered to
be an important indicator for the success of the business. The current ratio of the business is
shown to be 0.87 which has declined from the estimate shown in previous year. This shows that
there has been a decline in the liquidity position of the business (Delen, Kuzey and Uyar 2013).
The management of the company needs to make appropriate changes in the business structure
and ensure that the current liabilities of the business are always kept under check. The
management of the company needs to ensure that the liquidity is maintained so that the business
can undertake any new projects for further development of the business.
The efficiency ratio of the business comprises of key estimates which can be used for
determining the overall efficiency of the business. The inventory turnover ratio is shown to have
FINANCE FOR BUSINESS
28 13
Capital
Structure
Ratio
Debt to Total Capital
Debt/(Debt+Shareholder's
Equity) 38% 40%
The above table shows the key financial ratios which can be computed for Coles
Supermarket for the year 2018. The ratios which are presented above can be used for effectively
analysing the performance of the supermarket business during the period. The above table
effectively portrays the liquidity, profitability, solvency, activity, market-based ratios. The ratios
are used by business for the purpose of making comparison regarding the performance of the
business during the period (Vogel 2014). The management of the company needs to
appropriately makes plans regarding the operations of the business so that efficiency can be
maintained in the organization.
The above figure shows liquidity ratio comprises of current ratio which is considered to
be an important indicator for the success of the business. The current ratio of the business is
shown to be 0.87 which has declined from the estimate shown in previous year. This shows that
there has been a decline in the liquidity position of the business (Delen, Kuzey and Uyar 2013).
The management of the company needs to make appropriate changes in the business structure
and ensure that the current liabilities of the business are always kept under check. The
management of the company needs to ensure that the liquidity is maintained so that the business
can undertake any new projects for further development of the business.
The efficiency ratio of the business comprises of key estimates which can be used for
determining the overall efficiency of the business. The inventory turnover ratio is shown to have
Paraphrase This Document
Need a fresh take? Get an instant paraphrase of this document with our AI Paraphraser
7
FINANCE FOR BUSINESS
improved during the period which can be regarded as a positive sign for the business. The
averages days in inventory has also reduced which is a clear sign that the management has made
changes in the inventory management policies of the business. The receivable turnover ratio
shows significant improvements which is positive sign for the business (Babalola and Abiola
2013). This indicate that the management of the company is effectively able to collects the funds
which is receivables from debtors in a short period. In an overall estimation, it can be said that
the management of the company has significantly improved the efficiency of the business by
introducing new policies in the business.
The profitability ratios of a business are considered to be an important estimate for the
business and the same is also considered by investors while taking major investment decisions
for the business. Th return on equity estimate for the year 2018 is shown to be 11.44% which has
reduced from last year estimate which shows that in the current year the earnings of the business
is slightly lower. The return on assets of the business is considered to be one of the indicators of
the success of the business (Easton and Sommers 2018). The return on asset estimate is shown to
have improved during 2018 which suggest that the management of the company is effectively
utilizing the assets of the business for making more profits for the business. The net profit
margin of the business shows a decline which is matter of concern and the management of the
company needs to take appropriate steps so that the net profits enhance in future. The fall in the
net profits of the business is due to the increase in the costs of the business which has affected
the overall revenue which is generated by the business. The management of the company needs
to take appropriate steps so that the profitability of the business can be maintained.
The solvency ratios of the business are showing appropriate results and most notably it
shows that the debt equity ratio has reduced in comparison to previous year which signifies that
8
FINANCE FOR BUSINESS
the management of the company has made repayments of loan (Post and Byron 2015). The step
to reduce the loans of the business might be for reducing the risks which is faced by the business.
The earning per share of the business is shown to have reduced which need to be considered and
improved by the management of the company in future periods.
Graphical Representation of Share Price Movements
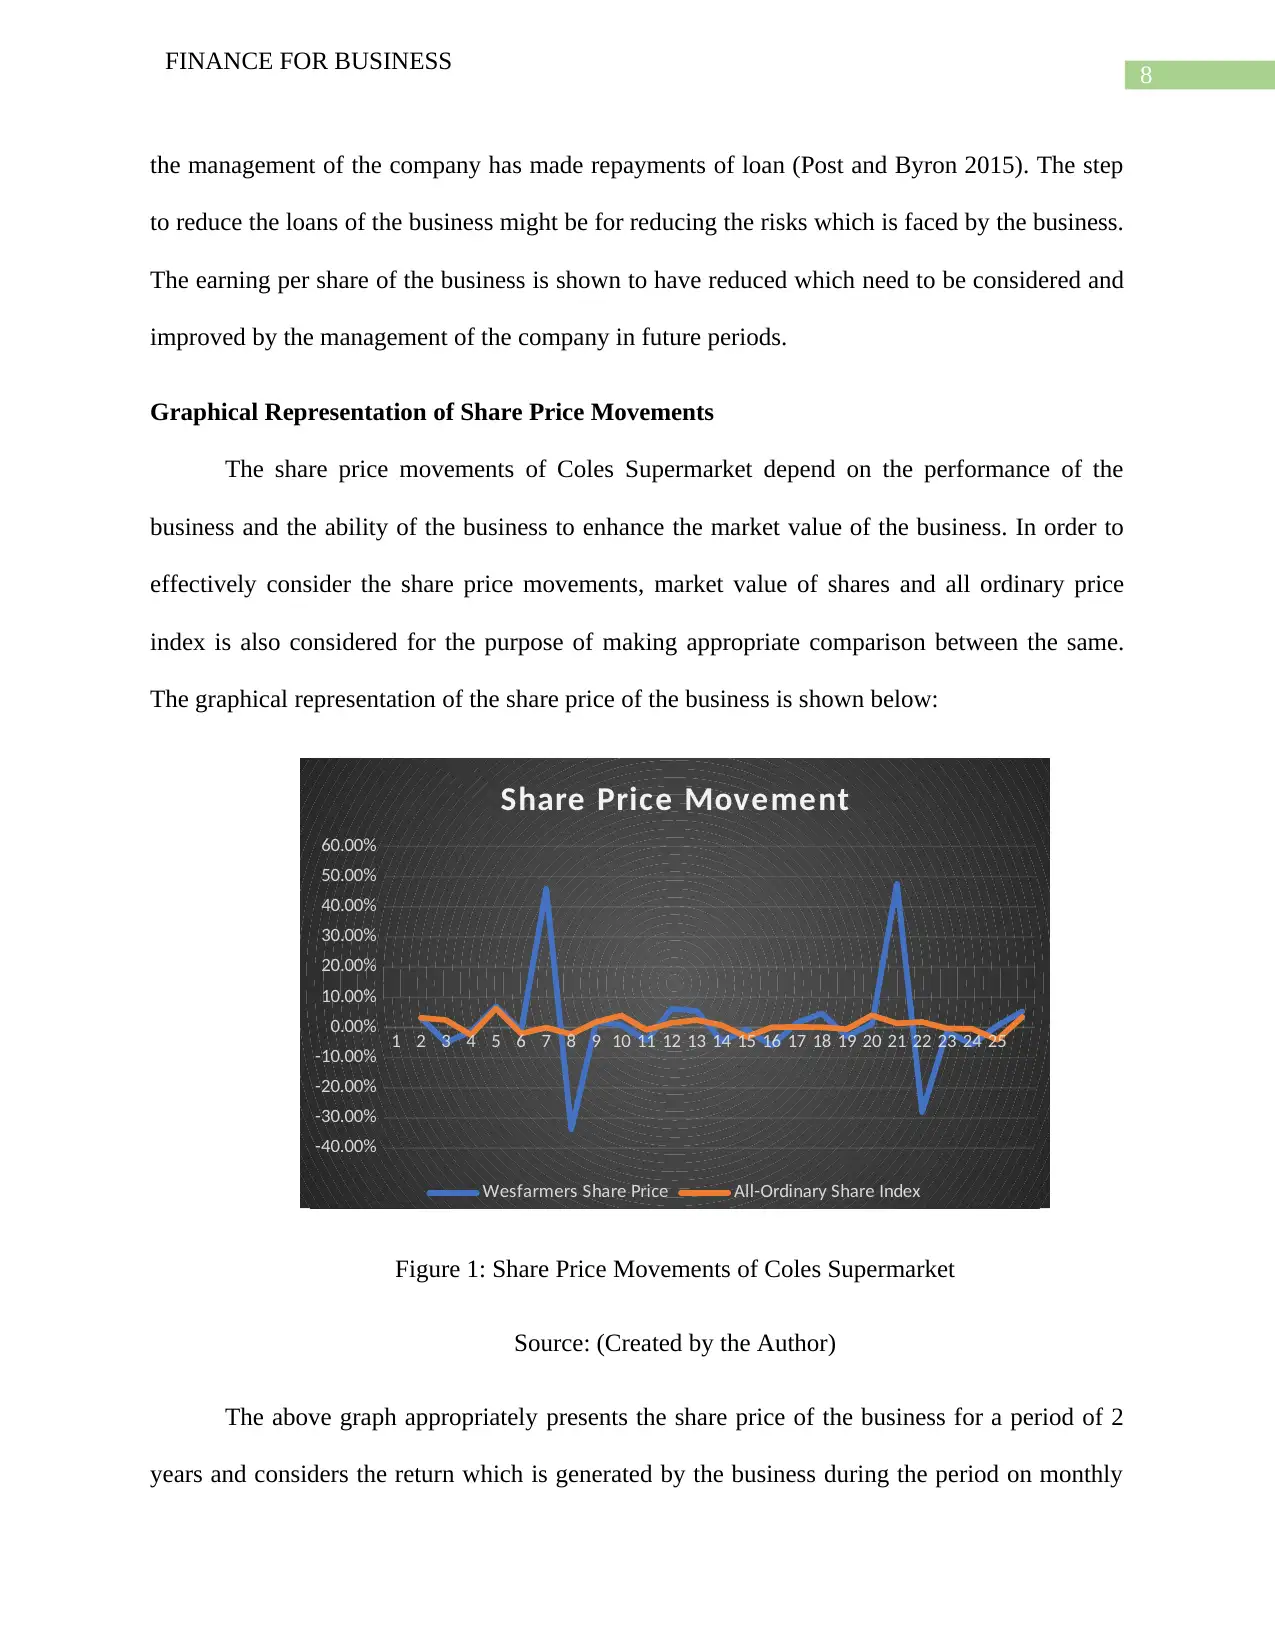
The share price movements of Coles Supermarket depend on the performance of the
business and the ability of the business to enhance the market value of the business. In order to
effectively consider the share price movements, market value of shares and all ordinary price
index is also considered for the purpose of making appropriate comparison between the same.
The graphical representation of the share price of the business is shown below:
1 2 3 4 5 6 7 8 9 10 11 12 13 14 15 16 17 18 19 20 21 22 23 24 25
-40.00%
-30.00%
-20.00%
-10.00%
0.00%
10.00%
20.00%
30.00%
40.00%
50.00%
60.00%
Share Price Movement
Wesfarmers Share Price All-Ordinary Share Index
Figure 1: Share Price Movements of Coles Supermarket
Source: (Created by the Author)
The above graph appropriately presents the share price of the business for a period of 2
years and considers the return which is generated by the business during the period on monthly
FINANCE FOR BUSINESS
the management of the company has made repayments of loan (Post and Byron 2015). The step
to reduce the loans of the business might be for reducing the risks which is faced by the business.
The earning per share of the business is shown to have reduced which need to be considered and
improved by the management of the company in future periods.
Graphical Representation of Share Price Movements
The share price movements of Coles Supermarket depend on the performance of the
business and the ability of the business to enhance the market value of the business. In order to
effectively consider the share price movements, market value of shares and all ordinary price
index is also considered for the purpose of making appropriate comparison between the same.
The graphical representation of the share price of the business is shown below:
1 2 3 4 5 6 7 8 9 10 11 12 13 14 15 16 17 18 19 20 21 22 23 24 25
-40.00%
-30.00%
-20.00%
-10.00%
0.00%
10.00%
20.00%
30.00%
40.00%
50.00%
60.00%
Share Price Movement
Wesfarmers Share Price All-Ordinary Share Index
Figure 1: Share Price Movements of Coles Supermarket
Source: (Created by the Author)
The above graph appropriately presents the share price of the business for a period of 2
years and considers the return which is generated by the business during the period on monthly
⊘ This is a preview!⊘
Do you want full access?
Subscribe today to unlock all pages.
Trusted by 1+ million students worldwide
9
FINANCE FOR BUSINESS
basis. The above graph shows that there is significant fluctuation in the share prices of the
business and as per current scenario the share price is on the rising trend judging by the growth
which is being experienced in the market (Rehman 2013). On the basis of the analysis which is
shown above, the prices of the company are less volatile and the same is shown to be positively
correlated with the all ordinary index which is shown in the above graph.
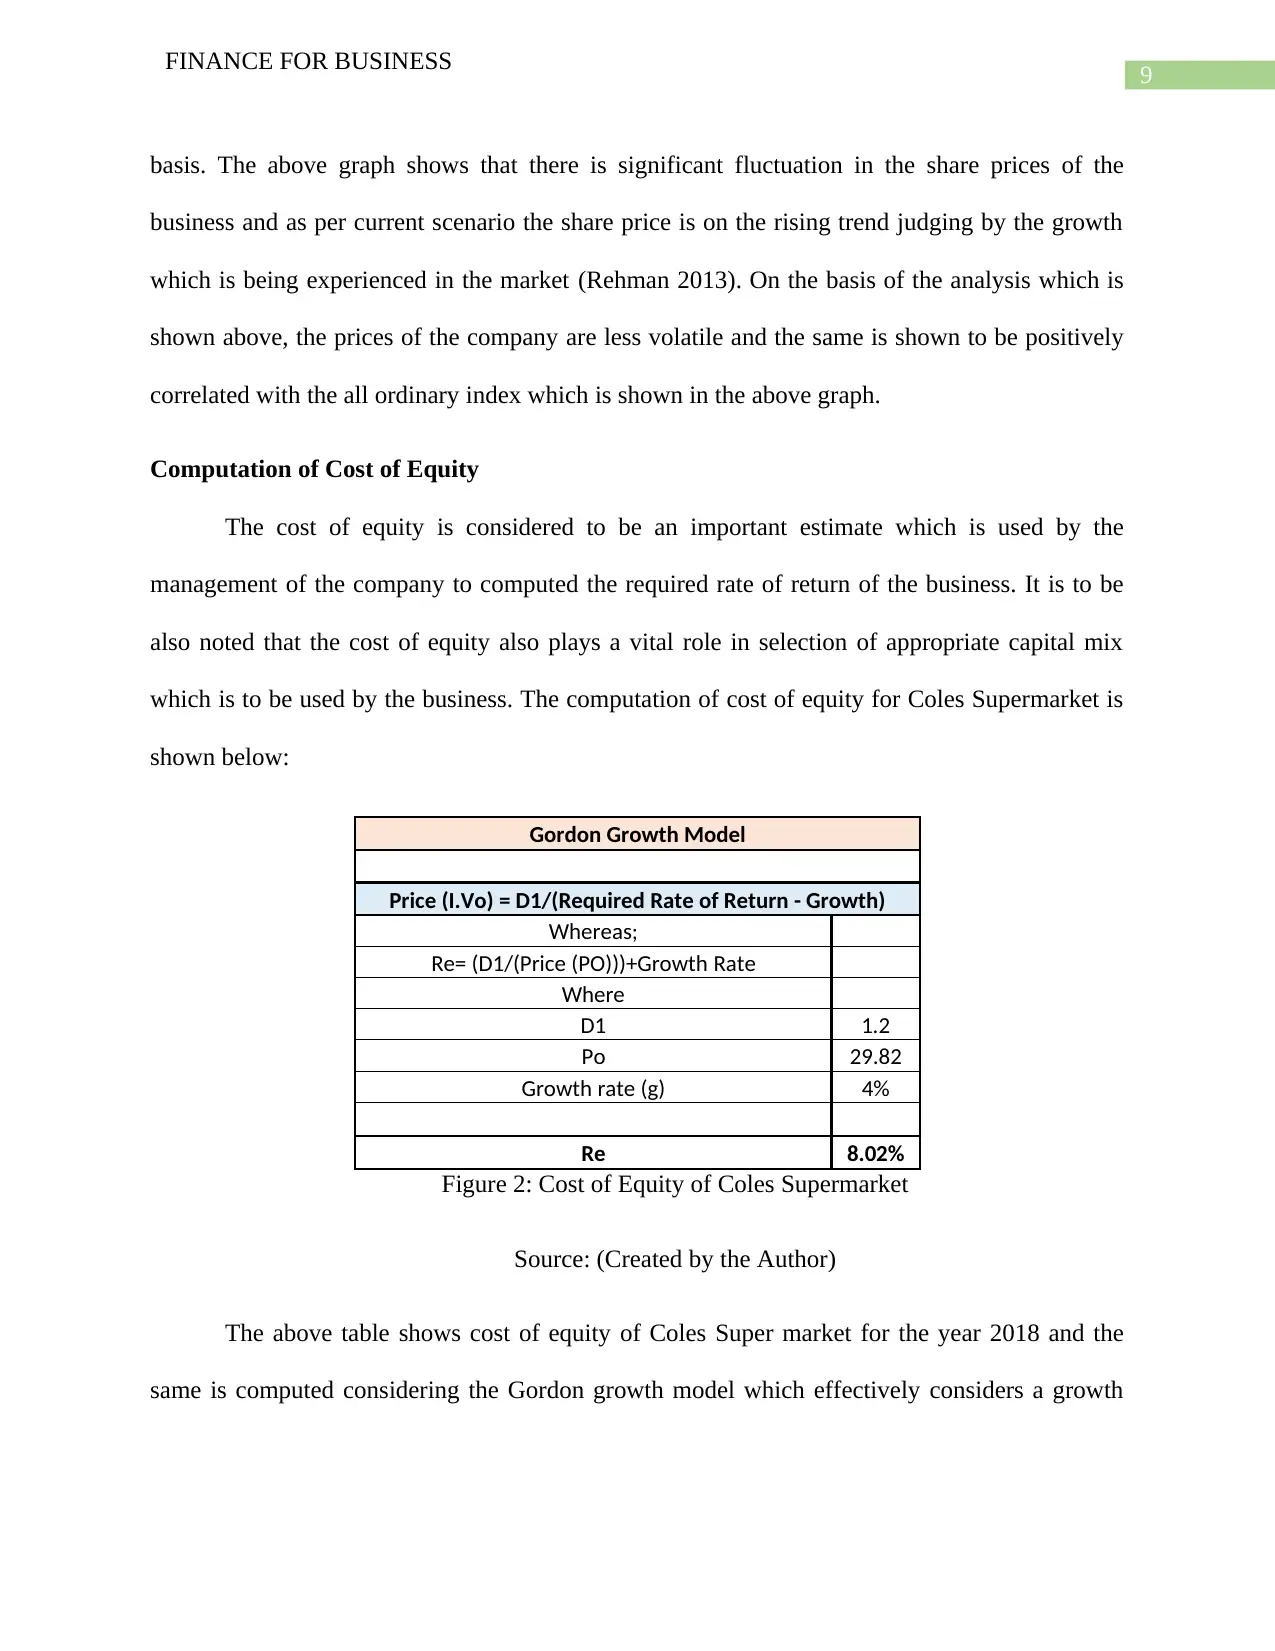
Computation of Cost of Equity
The cost of equity is considered to be an important estimate which is used by the
management of the company to computed the required rate of return of the business. It is to be
also noted that the cost of equity also plays a vital role in selection of appropriate capital mix
which is to be used by the business. The computation of cost of equity for Coles Supermarket is
shown below:
Gordon Growth Model
Price (I.Vo) = D1/(Required Rate of Return - Growth)
Whereas;
Re= (D1/(Price (PO)))+Growth Rate
Where
D1 1.2
Po 29.82
Growth rate (g) 4%
Re 8.02%
Figure 2: Cost of Equity of Coles Supermarket
Source: (Created by the Author)
The above table shows cost of equity of Coles Super market for the year 2018 and the
same is computed considering the Gordon growth model which effectively considers a growth
FINANCE FOR BUSINESS
basis. The above graph shows that there is significant fluctuation in the share prices of the
business and as per current scenario the share price is on the rising trend judging by the growth
which is being experienced in the market (Rehman 2013). On the basis of the analysis which is
shown above, the prices of the company are less volatile and the same is shown to be positively
correlated with the all ordinary index which is shown in the above graph.
Computation of Cost of Equity
The cost of equity is considered to be an important estimate which is used by the
management of the company to computed the required rate of return of the business. It is to be
also noted that the cost of equity also plays a vital role in selection of appropriate capital mix
which is to be used by the business. The computation of cost of equity for Coles Supermarket is
shown below:
Gordon Growth Model
Price (I.Vo) = D1/(Required Rate of Return - Growth)
Whereas;
Re= (D1/(Price (PO)))+Growth Rate
Where
D1 1.2
Po 29.82
Growth rate (g) 4%
Re 8.02%
Figure 2: Cost of Equity of Coles Supermarket
Source: (Created by the Author)
The above table shows cost of equity of Coles Super market for the year 2018 and the
same is computed considering the Gordon growth model which effectively considers a growth
Paraphrase This Document
Need a fresh take? Get an instant paraphrase of this document with our AI Paraphraser
10
FINANCE FOR BUSINESS
rate of 4% for the business. The cost of equity is shown to be 8.02% which is considering the
share price at the year of 2018.
Capital Structure of the Business
The analysis of the business which is considered is Coles Supermarket which provides a
variety of products to the business. The capital structure decisions of the supermarket is
considered to be important as the same helps the business in generating revenues and meeting
financial requirements of new projects. As per the annual report of the business for the year
2018, the management of the company is using more of equity capital in comparison to debt
capital in the business (Robb and Robinson 2014). The management is trying to reduce the debt
capital of the business so that the overall level of risks of the business is also reduced (Graham,
Leary and Roberts 2015). This shows that the management of the company is trying to reduce
the capital structure of the business so that an optimal capital structure can be reached which can
help the management of the company to finance appropriate projects and thereby also enhance
the ability of the business to generate more revenue along with reducing the risks of the business.
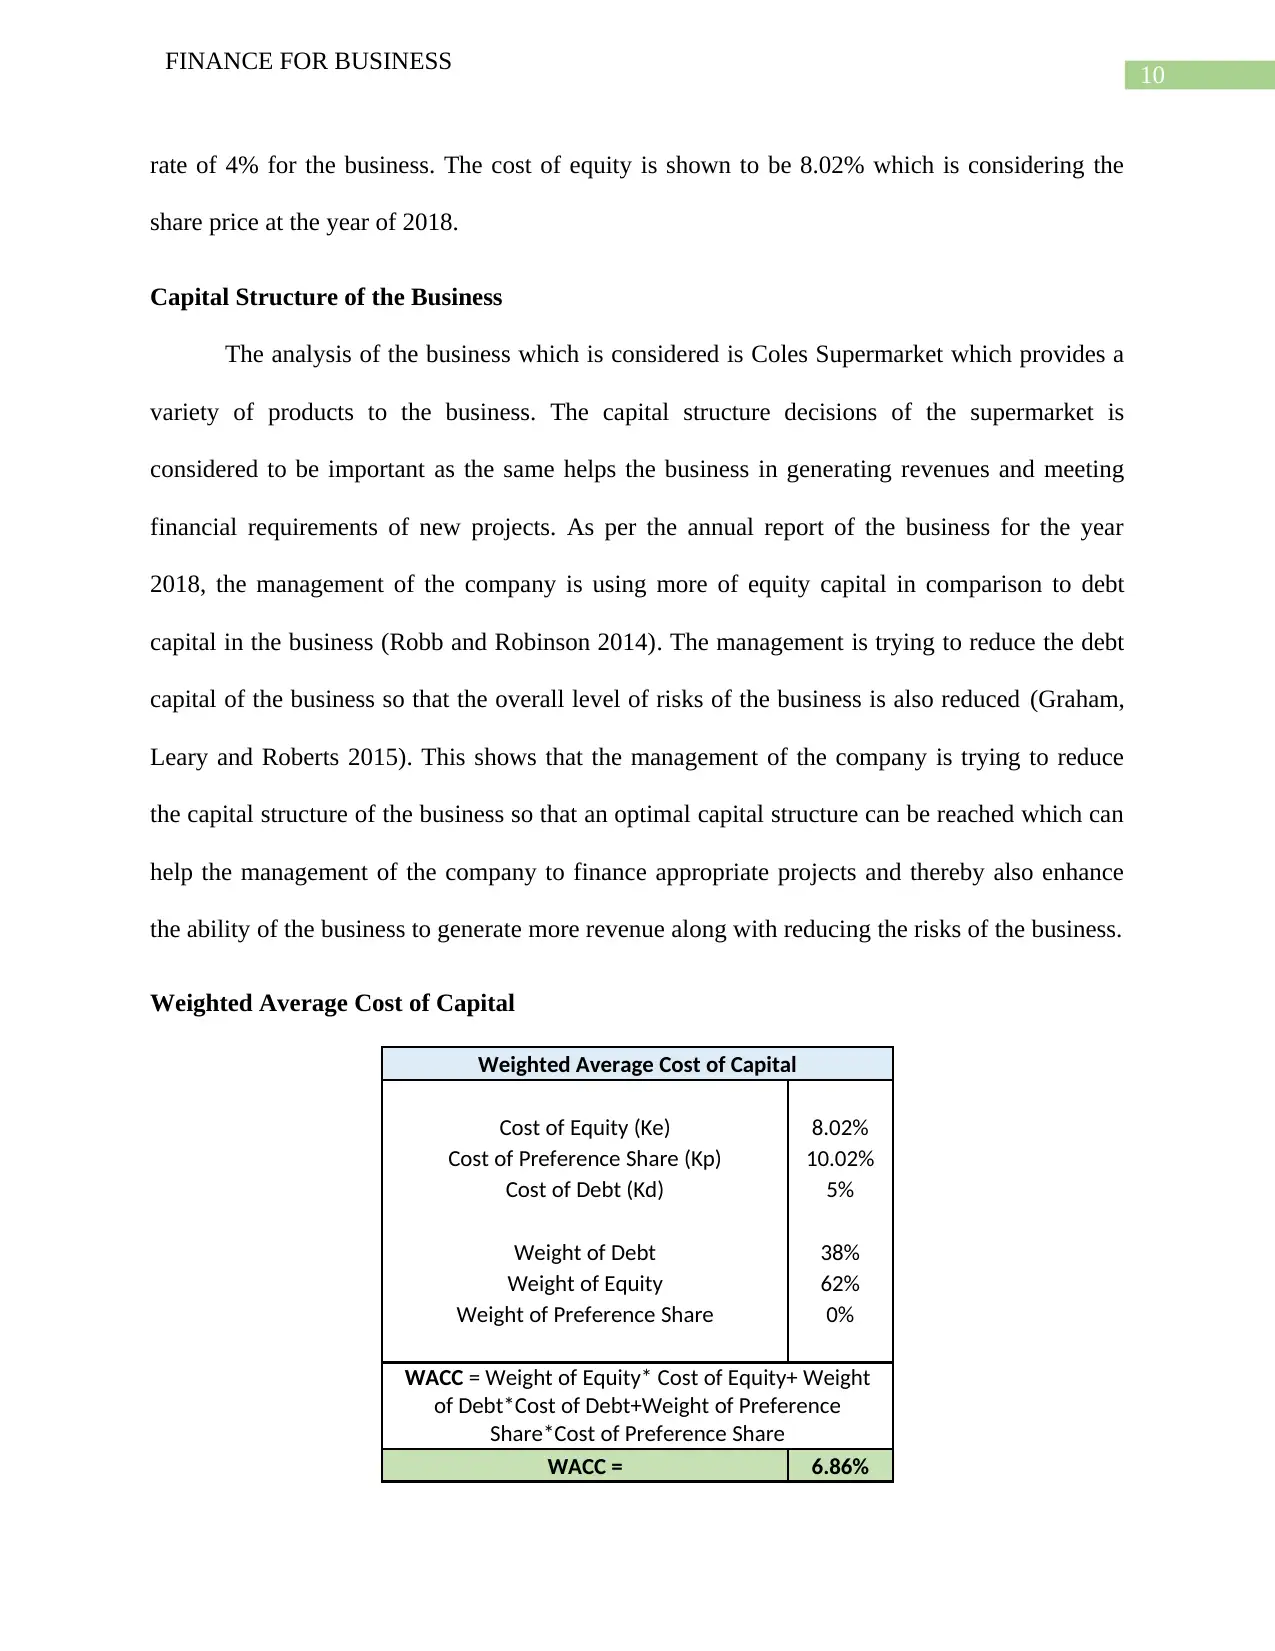
Weighted Average Cost of Capital
Weighted Average Cost of Capital
Cost of Equity (Ke) 8.02%
Cost of Preference Share (Kp) 10.02%
Cost of Debt (Kd) 5%
Weight of Debt 38%
Weight of Equity 62%
Weight of Preference Share 0%
WACC = Weight of Equity* Cost of Equity+ Weight
of Debt*Cost of Debt+Weight of Preference
Share*Cost of Preference Share
WACC = 6.86%
FINANCE FOR BUSINESS
rate of 4% for the business. The cost of equity is shown to be 8.02% which is considering the
share price at the year of 2018.
Capital Structure of the Business
The analysis of the business which is considered is Coles Supermarket which provides a
variety of products to the business. The capital structure decisions of the supermarket is
considered to be important as the same helps the business in generating revenues and meeting
financial requirements of new projects. As per the annual report of the business for the year
2018, the management of the company is using more of equity capital in comparison to debt
capital in the business (Robb and Robinson 2014). The management is trying to reduce the debt
capital of the business so that the overall level of risks of the business is also reduced (Graham,
Leary and Roberts 2015). This shows that the management of the company is trying to reduce
the capital structure of the business so that an optimal capital structure can be reached which can
help the management of the company to finance appropriate projects and thereby also enhance
the ability of the business to generate more revenue along with reducing the risks of the business.
Weighted Average Cost of Capital
Weighted Average Cost of Capital
Cost of Equity (Ke) 8.02%
Cost of Preference Share (Kp) 10.02%
Cost of Debt (Kd) 5%
Weight of Debt 38%
Weight of Equity 62%
Weight of Preference Share 0%
WACC = Weight of Equity* Cost of Equity+ Weight
of Debt*Cost of Debt+Weight of Preference
Share*Cost of Preference Share
WACC = 6.86%
11
FINANCE FOR BUSINESS
Figure 3: WACC of Coles Supermarket
Source: (Created by the Author)
The WACC of the project effectively shows the level of risks which is faced by the
business. The weighted average cost of capital is shown to be 6.86. The same iss computed
considering cost of debt, cost of equity and cost of preference shares.
Conclusion
The analysis which is conducted above shows that the management of Coles ltd needs to
consider the profitability aspect of the business so that improvements can be made in the same.
The solvency and efficiency of the business is shown to be favourable for the business. The
management of the company needs to improve the market valuation of the business so that more
revenue can be generated by the business. In an overall estimate the management of Coles ltd has
appropriately performed but the same needs to be improved further.
Recommendation
The recommendations which can be suggested to the management of the company needs
to take appropriate steps for the purpose of ensuring the business structure are suggested below:
The management of the company needs to improve the business structure of the company
and the same can be done by improving certain business policies such as debtor policy.
The costs of the business need to be reduced significantly so that the profitability of the
business can be enhanced.
The management of the company needs to focus on enhancing the wealth of shareholders
so that the earning per shares of the business needs to be improved.
⊘ This is a preview!⊘
Do you want full access?
Subscribe today to unlock all pages.
Trusted by 1+ million students worldwide
1 out of 14
Related Documents


Your All-in-One AI-Powered Toolkit for Academic Success.
+13062052269
info@desklib.com
Available 24*7 on WhatsApp / Email
![[object Object]](/_next/static/media/star-bottom.7253800d.svg)
Unlock your academic potential
Copyright © 2020–2026 A2Z Services. All Rights Reserved. Developed and managed by ZUCOL.