Accounting Principles Report: A2 Milk and Bellamy's Financial Analysis
VerifiedAdded on 2022/11/19
|14
|3566
|127
Report
AI Summary
This report provides a comprehensive financial analysis of A2 Milk Company Pty Ltd and Bellamy’s Australia Ltd, both operating in the Australian dairy and food and beverage industries, respectively. The analysis includes an overview of the industry and the companies, examining their strategies, market positions, and financial performance. The report delves into key financial aspects such as cash, receivables, inventory, property, plant, and equipment (PPE), current and non-current liabilities, and shareholder's equity. It incorporates ratio analysis, including current ratio, quick ratio, average daily sales, inventory turnover, debt ratio, times interest earned ratio, and return on equity, to assess the companies' liquidity, efficiency, solvency, and profitability. The report also highlights the auditor's letters and statements of cash flows, culminating in an overall analysis of the financial health of both companies, drawing conclusions about their strengths, weaknesses, and potential for future growth. The study is based on the financial reports for the years 2017 and 2018, offering a comparative perspective on their financial standing and operational performance.
Running head: ACCOUNTING PRINCIPLES
Accounting Principles
Name of the Student
Name of the University
Author’s Note
Accounting Principles
Name of the Student
Name of the University
Author’s Note
Paraphrase This Document
Need a fresh take? Get an instant paraphrase of this document with our AI Paraphraser
1ACCOUNTING PRINCIPLES
Table of Contents
Industry and Company Overview..............................................................................................2
Industry..................................................................................................................................2
Company................................................................................................................................2
Cash............................................................................................................................................3
Receivable..................................................................................................................................3
Inventory....................................................................................................................................4
Property, Plant and Equipment (PPE)........................................................................................5
Current Liabilities......................................................................................................................6
Non-Current Liabilities..............................................................................................................6
Shareholder’s Equity..................................................................................................................7
Auditor’s Letter..........................................................................................................................7
Statement of Cash Flows............................................................................................................8
Ratio Analysis............................................................................................................................8
Overall Analysis.......................................................................................................................11
References................................................................................................................................12
2ACCOUNTING PRINCIPLES
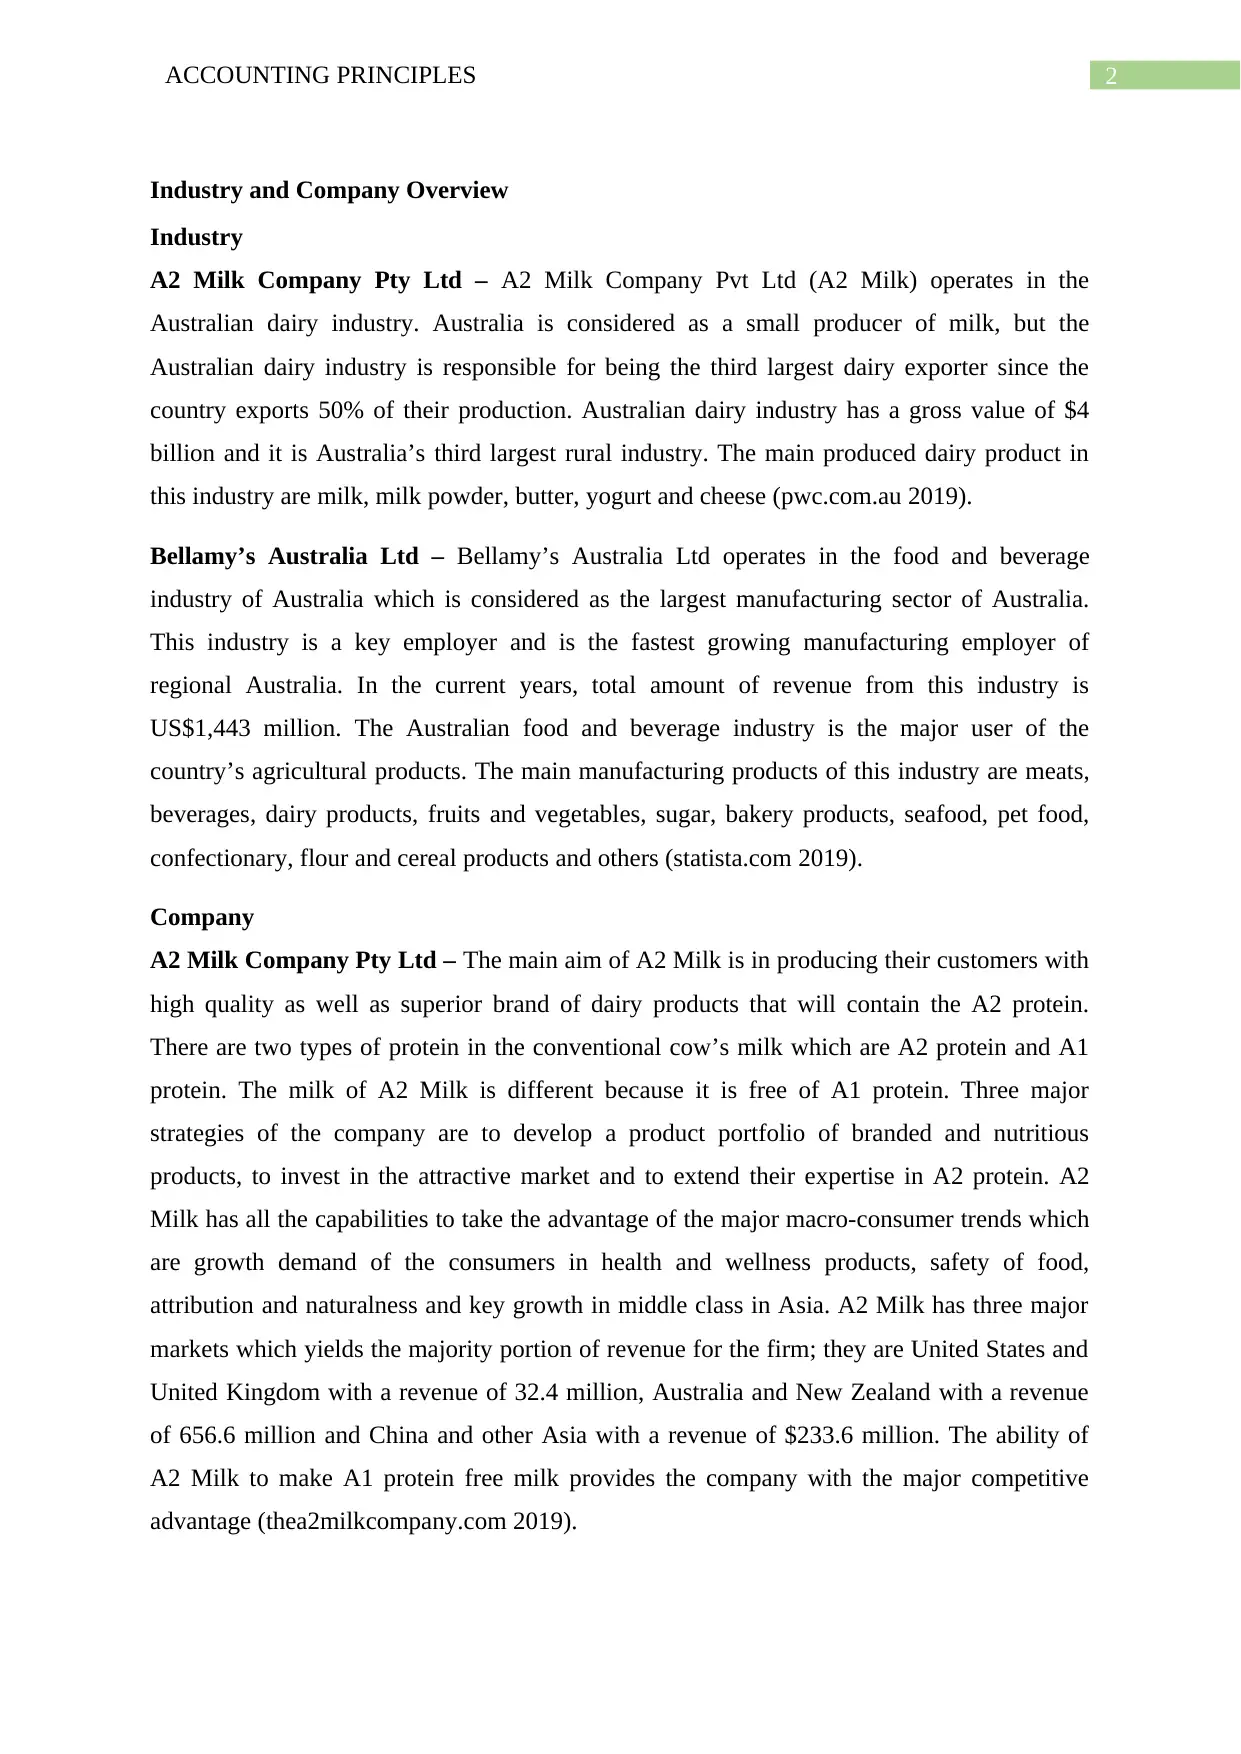
Industry and Company Overview
Industry
A2 Milk Company Pty Ltd – A2 Milk Company Pvt Ltd (A2 Milk) operates in the
Australian dairy industry. Australia is considered as a small producer of milk, but the
Australian dairy industry is responsible for being the third largest dairy exporter since the
country exports 50% of their production. Australian dairy industry has a gross value of $4
billion and it is Australia’s third largest rural industry. The main produced dairy product in
this industry are milk, milk powder, butter, yogurt and cheese (pwc.com.au 2019).
Bellamy’s Australia Ltd – Bellamy’s Australia Ltd operates in the food and beverage
industry of Australia which is considered as the largest manufacturing sector of Australia.
This industry is a key employer and is the fastest growing manufacturing employer of
regional Australia. In the current years, total amount of revenue from this industry is
US$1,443 million. The Australian food and beverage industry is the major user of the
country’s agricultural products. The main manufacturing products of this industry are meats,
beverages, dairy products, fruits and vegetables, sugar, bakery products, seafood, pet food,
confectionary, flour and cereal products and others (statista.com 2019).
Company
A2 Milk Company Pty Ltd – The main aim of A2 Milk is in producing their customers with
high quality as well as superior brand of dairy products that will contain the A2 protein.
There are two types of protein in the conventional cow’s milk which are A2 protein and A1
protein. The milk of A2 Milk is different because it is free of A1 protein. Three major
strategies of the company are to develop a product portfolio of branded and nutritious
products, to invest in the attractive market and to extend their expertise in A2 protein. A2
Milk has all the capabilities to take the advantage of the major macro-consumer trends which
are growth demand of the consumers in health and wellness products, safety of food,
attribution and naturalness and key growth in middle class in Asia. A2 Milk has three major
markets which yields the majority portion of revenue for the firm; they are United States and
United Kingdom with a revenue of 32.4 million, Australia and New Zealand with a revenue
of 656.6 million and China and other Asia with a revenue of $233.6 million. The ability of
A2 Milk to make A1 protein free milk provides the company with the major competitive
advantage (thea2milkcompany.com 2019).
⊘ This is a preview!⊘
Do you want full access?
Subscribe today to unlock all pages.
Trusted by 1+ million students worldwide
3ACCOUNTING PRINCIPLES
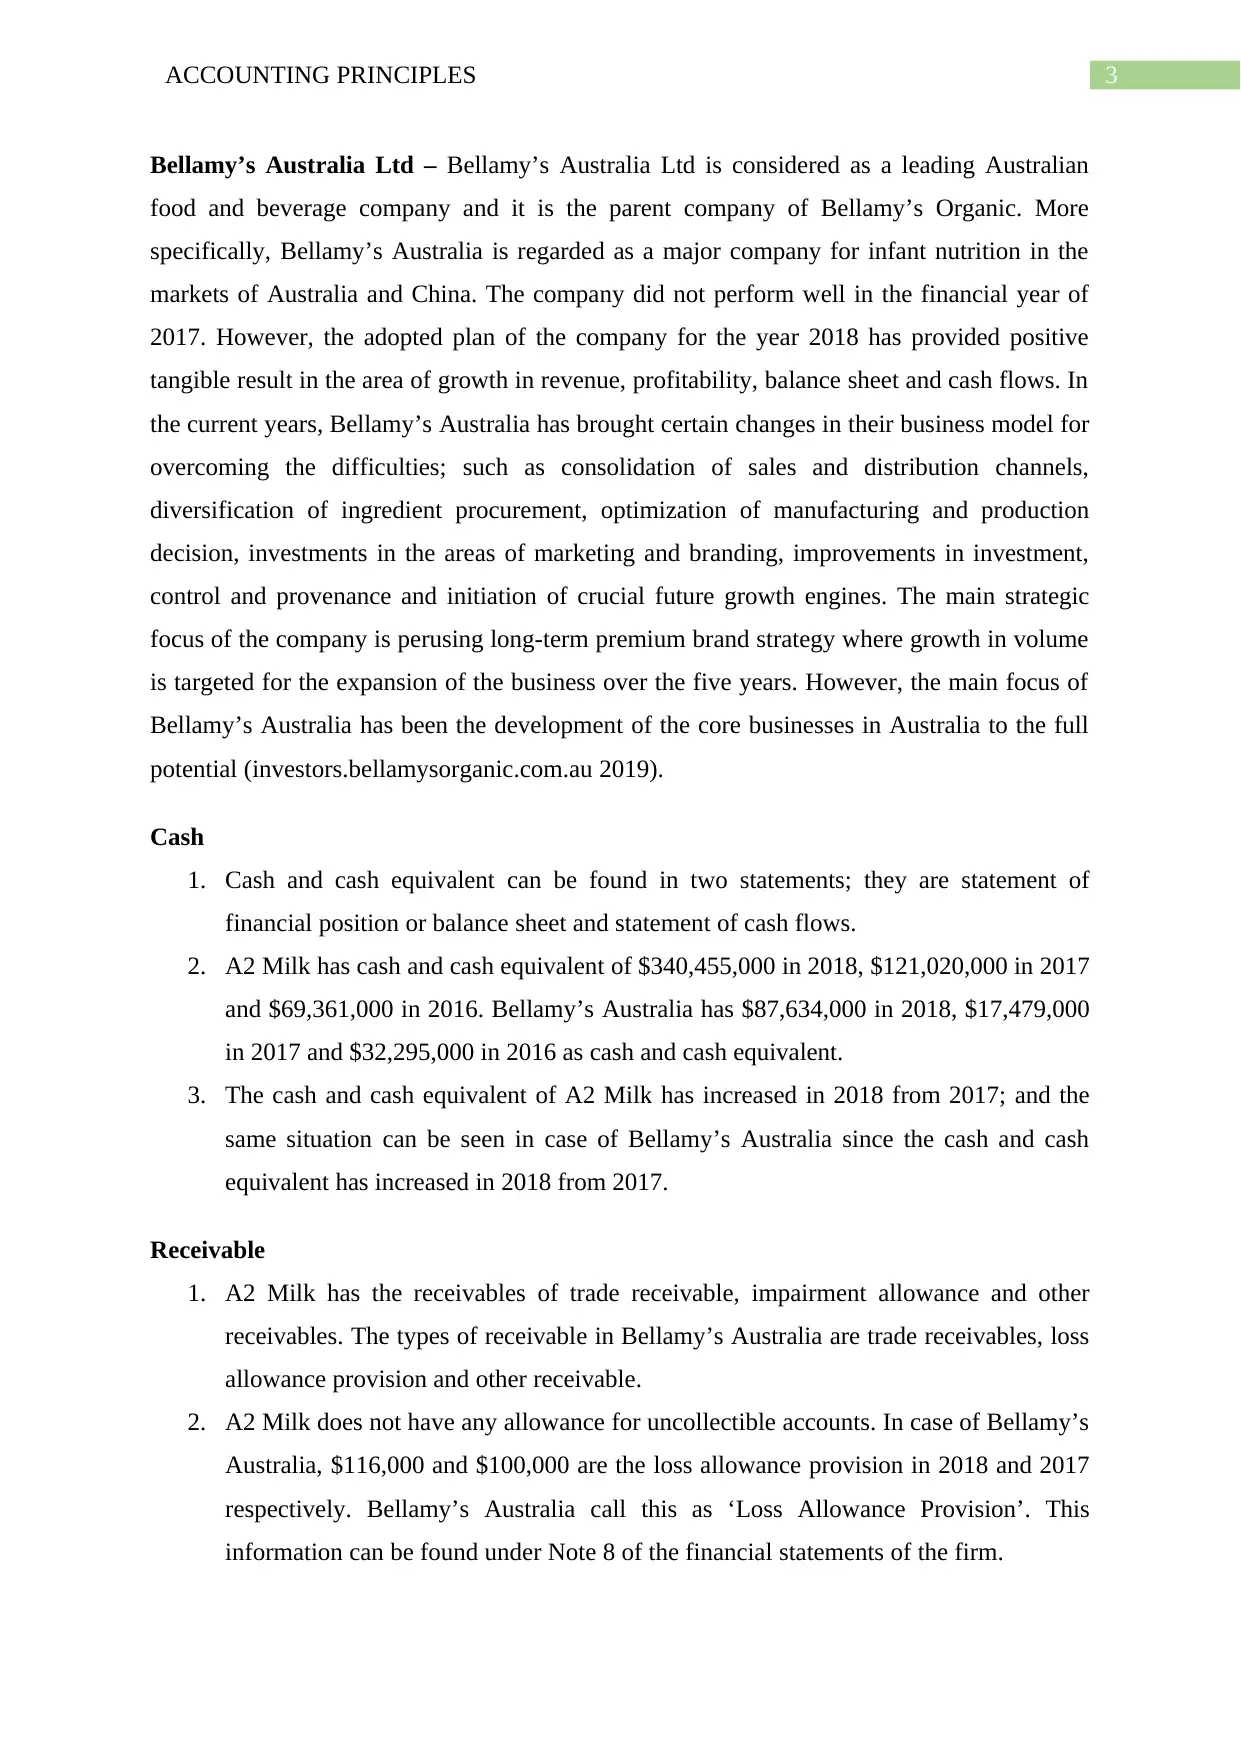
Bellamy’s Australia Ltd – Bellamy’s Australia Ltd is considered as a leading Australian
food and beverage company and it is the parent company of Bellamy’s Organic. More
specifically, Bellamy’s Australia is regarded as a major company for infant nutrition in the
markets of Australia and China. The company did not perform well in the financial year of
2017. However, the adopted plan of the company for the year 2018 has provided positive
tangible result in the area of growth in revenue, profitability, balance sheet and cash flows. In
the current years, Bellamy’s Australia has brought certain changes in their business model for
overcoming the difficulties; such as consolidation of sales and distribution channels,
diversification of ingredient procurement, optimization of manufacturing and production
decision, investments in the areas of marketing and branding, improvements in investment,
control and provenance and initiation of crucial future growth engines. The main strategic
focus of the company is perusing long-term premium brand strategy where growth in volume
is targeted for the expansion of the business over the five years. However, the main focus of
Bellamy’s Australia has been the development of the core businesses in Australia to the full
potential (investors.bellamysorganic.com.au 2019).
Cash
1. Cash and cash equivalent can be found in two statements; they are statement of
financial position or balance sheet and statement of cash flows.
2. A2 Milk has cash and cash equivalent of $340,455,000 in 2018, $121,020,000 in 2017
and $69,361,000 in 2016. Bellamy’s Australia has $87,634,000 in 2018, $17,479,000
in 2017 and $32,295,000 in 2016 as cash and cash equivalent.
3. The cash and cash equivalent of A2 Milk has increased in 2018 from 2017; and the
same situation can be seen in case of Bellamy’s Australia since the cash and cash
equivalent has increased in 2018 from 2017.
Receivable
1. A2 Milk has the receivables of trade receivable, impairment allowance and other
receivables. The types of receivable in Bellamy’s Australia are trade receivables, loss
allowance provision and other receivable.
2. A2 Milk does not have any allowance for uncollectible accounts. In case of Bellamy’s
Australia, $116,000 and $100,000 are the loss allowance provision in 2018 and 2017
respectively. Bellamy’s Australia call this as ‘Loss Allowance Provision’. This
information can be found under Note 8 of the financial statements of the firm.
Paraphrase This Document
Need a fresh take? Get an instant paraphrase of this document with our AI Paraphraser
4ACCOUNTING PRINCIPLES
3. The gross amount of receivables of Bellamy’s Australia is ($43,856,000 +
$5,577,000) = $4,94,33,0000. 0.3% of the gross receivable is allowance.
4. The ratios and interpretation is shown below:
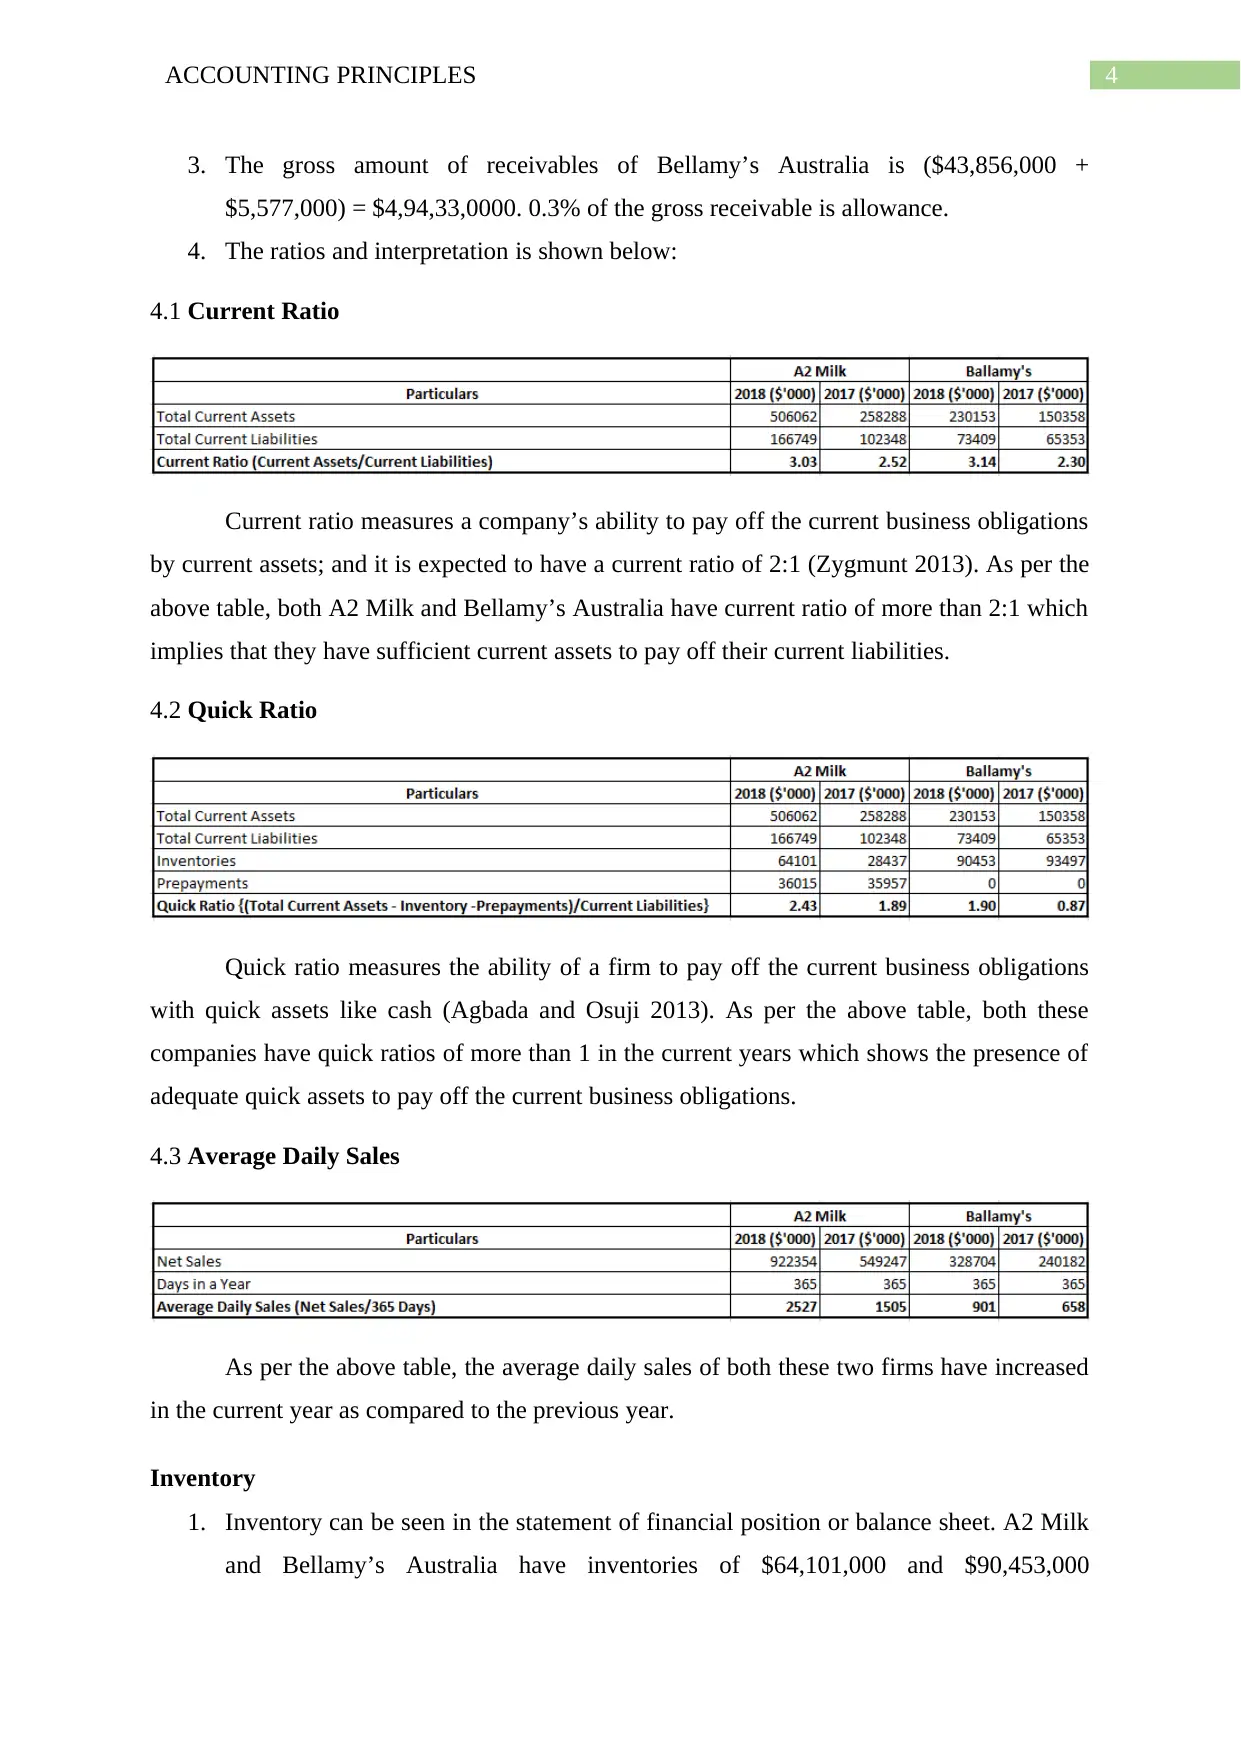
4.1 Current Ratio
Current ratio measures a company’s ability to pay off the current business obligations
by current assets; and it is expected to have a current ratio of 2:1 (Zygmunt 2013). As per the
above table, both A2 Milk and Bellamy’s Australia have current ratio of more than 2:1 which
implies that they have sufficient current assets to pay off their current liabilities.
4.2 Quick Ratio
Quick ratio measures the ability of a firm to pay off the current business obligations
with quick assets like cash (Agbada and Osuji 2013). As per the above table, both these
companies have quick ratios of more than 1 in the current years which shows the presence of
adequate quick assets to pay off the current business obligations.
4.3 Average Daily Sales
As per the above table, the average daily sales of both these two firms have increased
in the current year as compared to the previous year.
Inventory
1. Inventory can be seen in the statement of financial position or balance sheet. A2 Milk
and Bellamy’s Australia have inventories of $64,101,000 and $90,453,000
3. The gross amount of receivables of Bellamy’s Australia is ($43,856,000 +
$5,577,000) = $4,94,33,0000. 0.3% of the gross receivable is allowance.
4. The ratios and interpretation is shown below:
4.1 Current Ratio
Current ratio measures a company’s ability to pay off the current business obligations
by current assets; and it is expected to have a current ratio of 2:1 (Zygmunt 2013). As per the
above table, both A2 Milk and Bellamy’s Australia have current ratio of more than 2:1 which
implies that they have sufficient current assets to pay off their current liabilities.
4.2 Quick Ratio
Quick ratio measures the ability of a firm to pay off the current business obligations
with quick assets like cash (Agbada and Osuji 2013). As per the above table, both these
companies have quick ratios of more than 1 in the current years which shows the presence of
adequate quick assets to pay off the current business obligations.
4.3 Average Daily Sales
As per the above table, the average daily sales of both these two firms have increased
in the current year as compared to the previous year.
Inventory
1. Inventory can be seen in the statement of financial position or balance sheet. A2 Milk
and Bellamy’s Australia have inventories of $64,101,000 and $90,453,000
5ACCOUNTING PRINCIPLES
respectively in the current year. The inventory values are provided in thousands (Gaur
and Kesavan 2015).
2. Cost of goods sold can be found in consolidated statement of comprehensive income
or consolidated Statement of Profit or Loss and Other Comprehensive Income. The
page number is 70 for A2 Milk and 49 for Bellamy’s Australia. The cost of goods
sold for A2 Milk and Bellamy’s in the recent year are $458,005,000 and
$199,830,000 respectively and the values are given in thousands.
3. In case of both of the companies, inventories are valued at lower of the cost and net
realisable value. This information can be found in note C2 and note 9 of the financial
statements of A2 Milk and Bellamy’s Australia respectively.
4. Lowe of cost of inventory refers to the fact that a firm must record the cost of
inventory at whichever cost of lower that are the current market price or the original
cost.
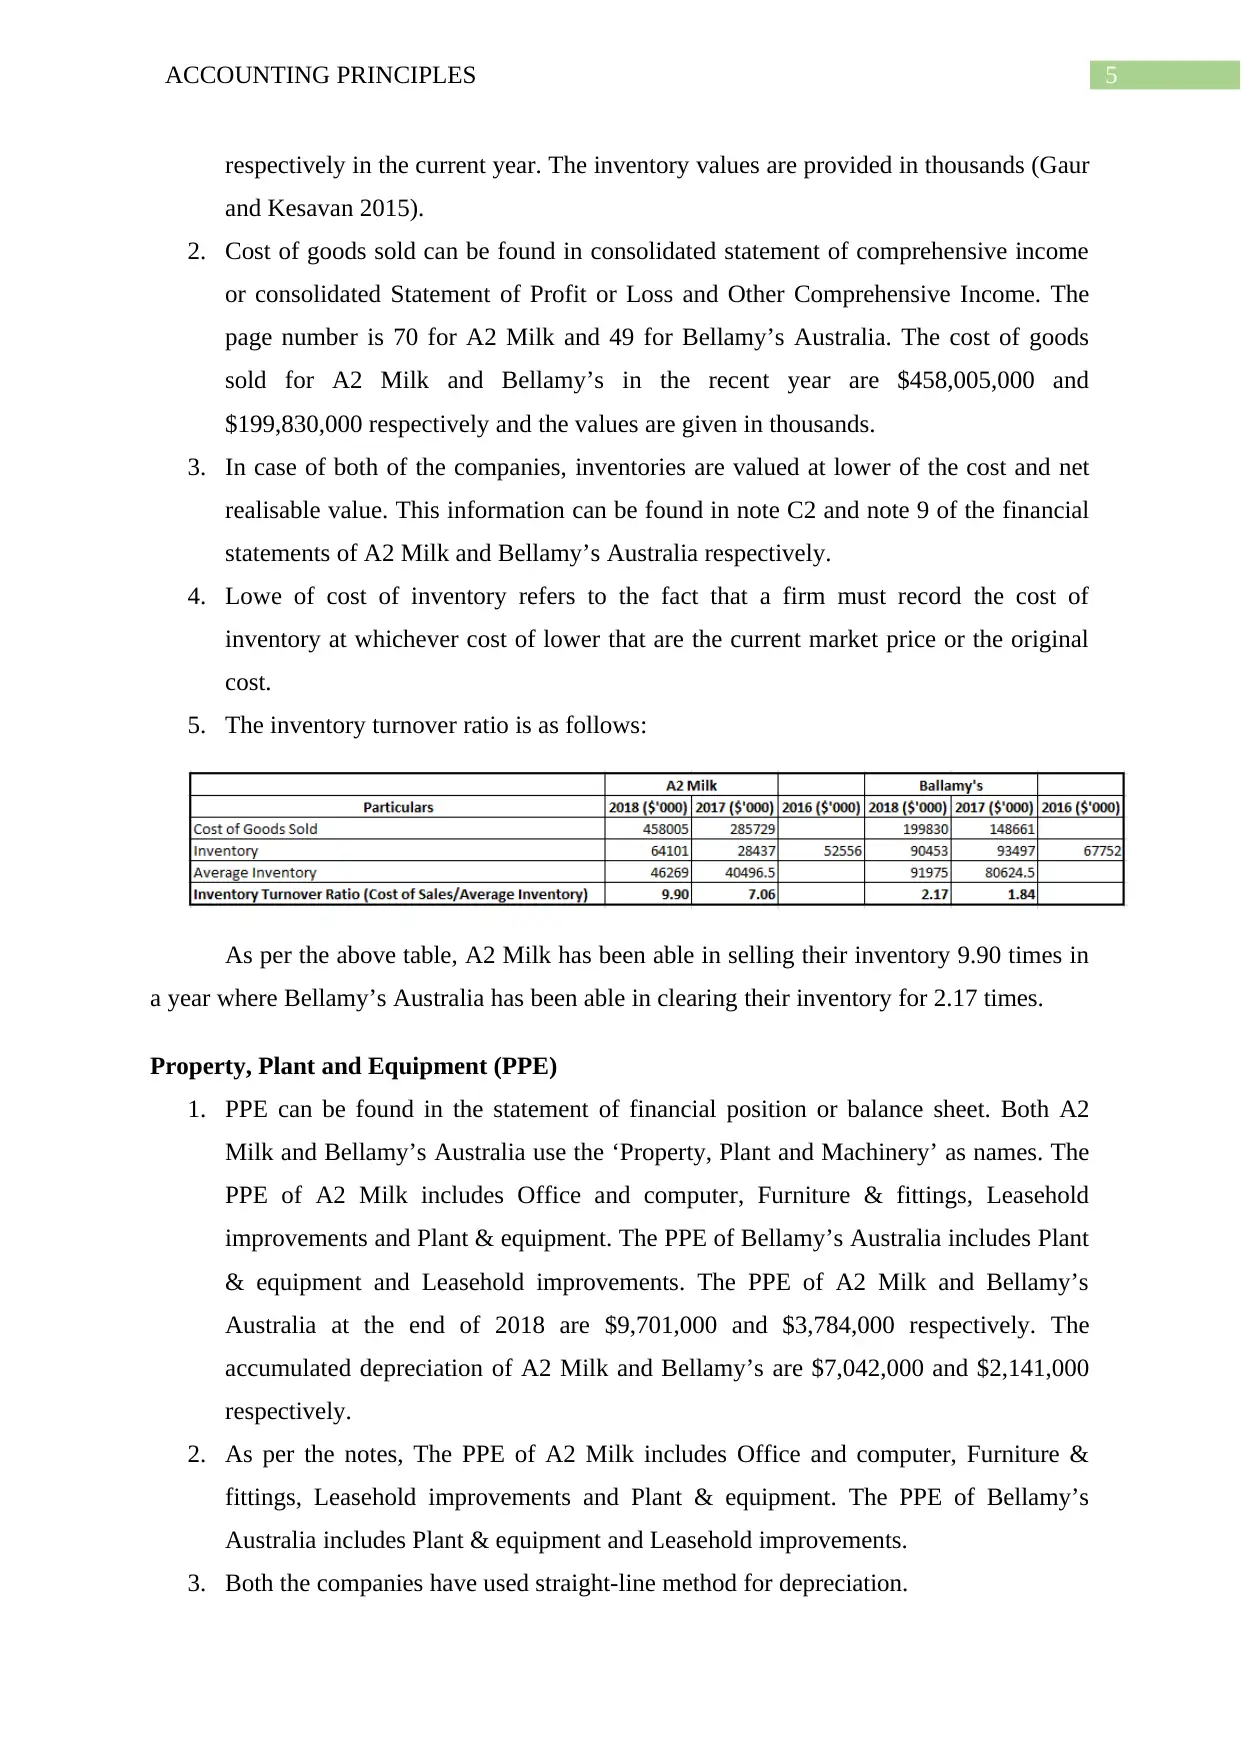
5. The inventory turnover ratio is as follows:
As per the above table, A2 Milk has been able in selling their inventory 9.90 times in
a year where Bellamy’s Australia has been able in clearing their inventory for 2.17 times.
Property, Plant and Equipment (PPE)
1. PPE can be found in the statement of financial position or balance sheet. Both A2
Milk and Bellamy’s Australia use the ‘Property, Plant and Machinery’ as names. The
PPE of A2 Milk includes Office and computer, Furniture & fittings, Leasehold
improvements and Plant & equipment. The PPE of Bellamy’s Australia includes Plant
& equipment and Leasehold improvements. The PPE of A2 Milk and Bellamy’s
Australia at the end of 2018 are $9,701,000 and $3,784,000 respectively. The
accumulated depreciation of A2 Milk and Bellamy’s are $7,042,000 and $2,141,000
respectively.
2. As per the notes, The PPE of A2 Milk includes Office and computer, Furniture &
fittings, Leasehold improvements and Plant & equipment. The PPE of Bellamy’s
Australia includes Plant & equipment and Leasehold improvements.
3. Both the companies have used straight-line method for depreciation.
respectively in the current year. The inventory values are provided in thousands (Gaur
and Kesavan 2015).
2. Cost of goods sold can be found in consolidated statement of comprehensive income
or consolidated Statement of Profit or Loss and Other Comprehensive Income. The
page number is 70 for A2 Milk and 49 for Bellamy’s Australia. The cost of goods
sold for A2 Milk and Bellamy’s in the recent year are $458,005,000 and
$199,830,000 respectively and the values are given in thousands.
3. In case of both of the companies, inventories are valued at lower of the cost and net
realisable value. This information can be found in note C2 and note 9 of the financial
statements of A2 Milk and Bellamy’s Australia respectively.
4. Lowe of cost of inventory refers to the fact that a firm must record the cost of
inventory at whichever cost of lower that are the current market price or the original
cost.
5. The inventory turnover ratio is as follows:
As per the above table, A2 Milk has been able in selling their inventory 9.90 times in
a year where Bellamy’s Australia has been able in clearing their inventory for 2.17 times.
Property, Plant and Equipment (PPE)
1. PPE can be found in the statement of financial position or balance sheet. Both A2
Milk and Bellamy’s Australia use the ‘Property, Plant and Machinery’ as names. The
PPE of A2 Milk includes Office and computer, Furniture & fittings, Leasehold
improvements and Plant & equipment. The PPE of Bellamy’s Australia includes Plant
& equipment and Leasehold improvements. The PPE of A2 Milk and Bellamy’s
Australia at the end of 2018 are $9,701,000 and $3,784,000 respectively. The
accumulated depreciation of A2 Milk and Bellamy’s are $7,042,000 and $2,141,000
respectively.
2. As per the notes, The PPE of A2 Milk includes Office and computer, Furniture &
fittings, Leasehold improvements and Plant & equipment. The PPE of Bellamy’s
Australia includes Plant & equipment and Leasehold improvements.
3. Both the companies have used straight-line method for depreciation.
⊘ This is a preview!⊘
Do you want full access?
Subscribe today to unlock all pages.
Trusted by 1+ million students worldwide
6ACCOUNTING PRINCIPLES
4. Both the companies have depreciate their plant assets over the useful lives.
5. The intangible assets of A2 Milk are patents, trademarks, software, project
development and goodwill; and the intangible assets of Bellamy’s Australia are
goodwill, licences and customer contracts, production accesses, other intangibles. In
case of A2 Milk, software, patents and trademarks are subject to amortization on
straight line basis, but trademarks are tested for impairment. Goodwill is recognized at
cost and are measured at cost less any accumulated depreciation. For Bellamy’s
Australia, licences and customer contracts are measured at fair value and goodwill is
allocated to cash-generating units.
Current Liabilities
Current liabilities can be found in the statement of financial position or balance sheet.
The current liabilities of A2 Milk contains trade and other payable and income tax
payable. The current liabilities of Bellamy’s Australia include trade and other
payable, borrowings, provisions, derivatives and current tax liabilities (Laux 2013).
A2 Milk does not have any contingent liability in 2018 and this can be seen in Note
D9 of the financial statements. As per the Note 24 of the financial statements of
Bellamy’s Australia, the company has a contingent liability where due to the
proceedings of Staler and Gordon on 23 February 2017 and Maurice Blackburn on 8
March 2017 in the Federal Court of Australia. The claim is related to the allegation of
contravention of the Corporations Act 2001 (Cth) regarding depictive conduct and
obligation for continuous disclosure.
Non-Current Liabilities
1. Non-current liabilities can be found in the statement of financial position or balance
sheet. The non-current liabilities of A2 Milk includes only trade and other payable.
The non-current liabilities of Bellamy’s include only provision.
2. The notes of financial statement of A2 Milk states that employee entitlement is the
non-current liability of the firm; it also includes the value and description of the same.
The notes of Bellamy’s Australia shows the employee benefit is the non-current
liability of the firm. It also contains the description of the same.
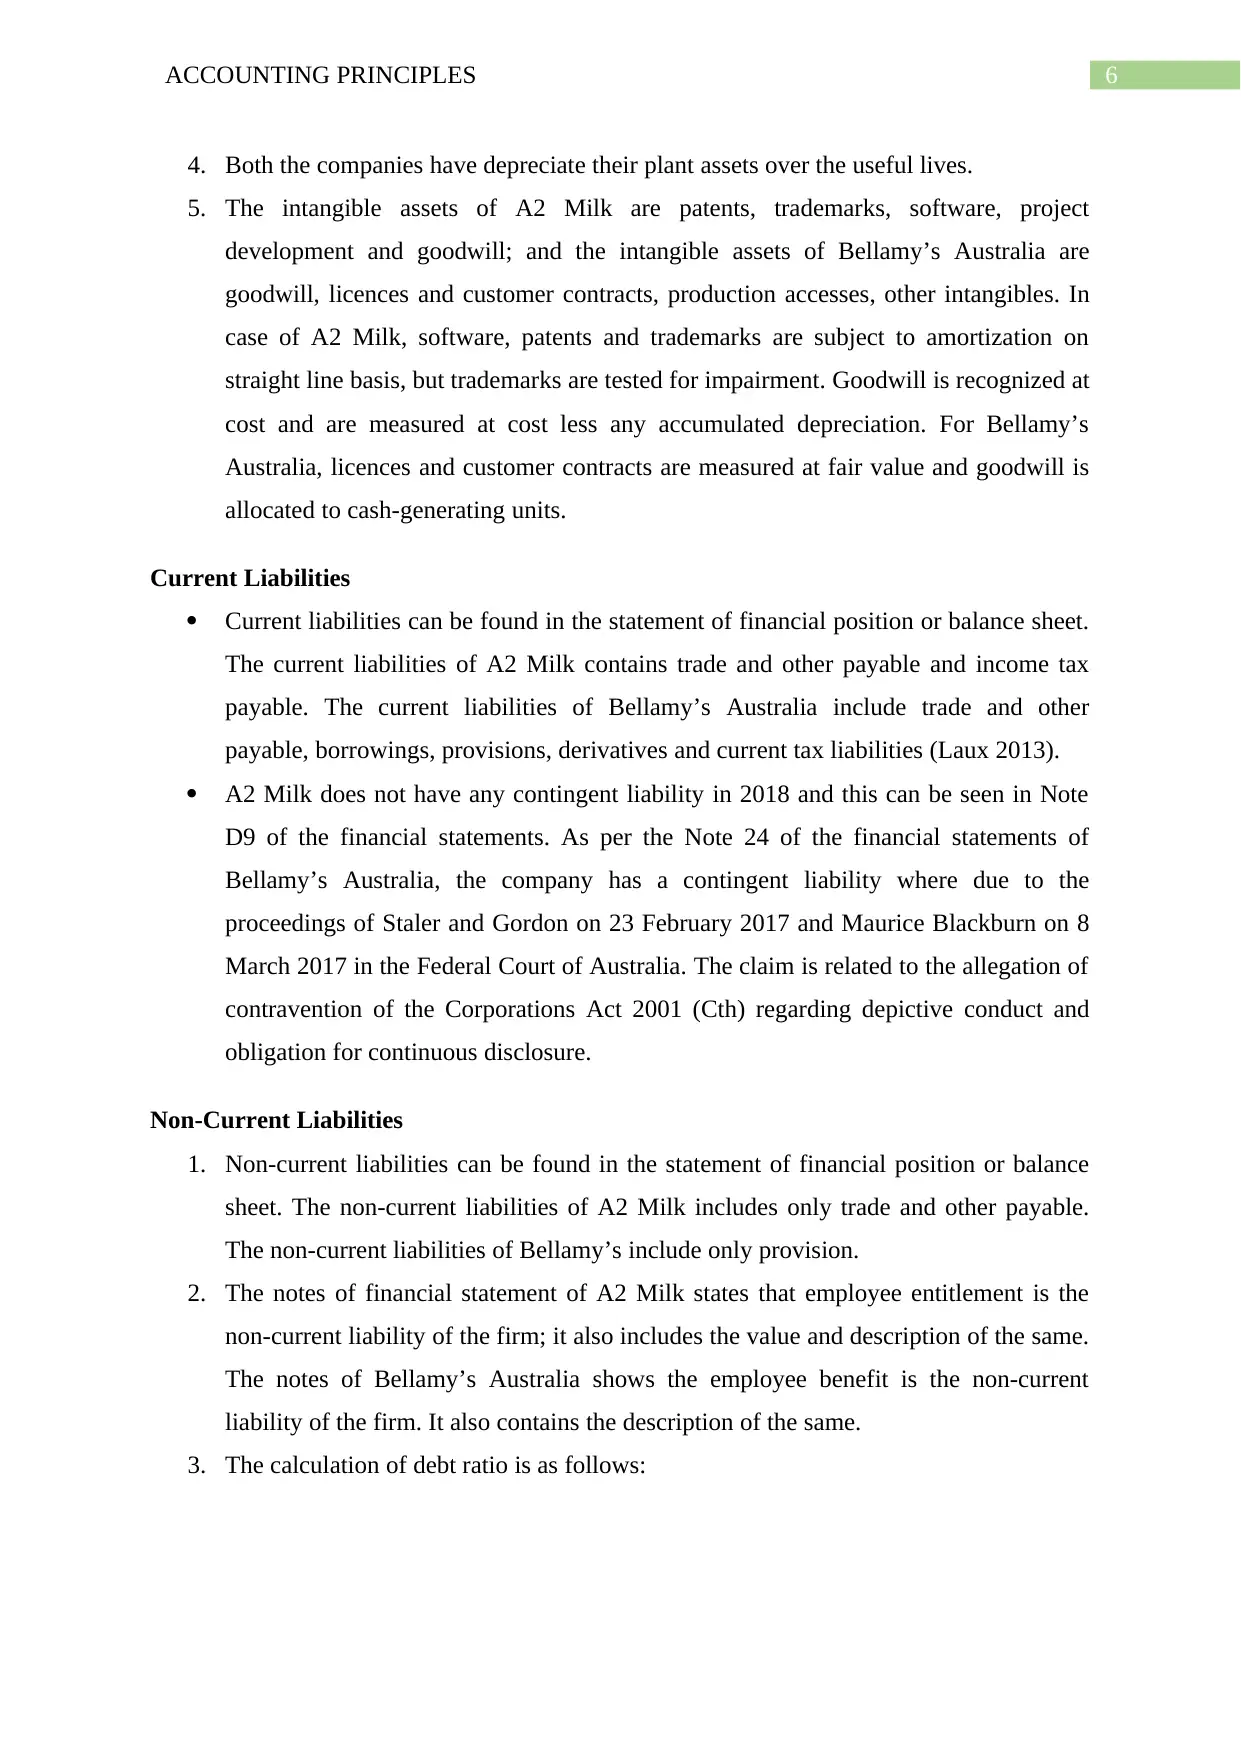
3. The calculation of debt ratio is as follows:
4. Both the companies have depreciate their plant assets over the useful lives.
5. The intangible assets of A2 Milk are patents, trademarks, software, project
development and goodwill; and the intangible assets of Bellamy’s Australia are
goodwill, licences and customer contracts, production accesses, other intangibles. In
case of A2 Milk, software, patents and trademarks are subject to amortization on
straight line basis, but trademarks are tested for impairment. Goodwill is recognized at
cost and are measured at cost less any accumulated depreciation. For Bellamy’s
Australia, licences and customer contracts are measured at fair value and goodwill is
allocated to cash-generating units.
Current Liabilities
Current liabilities can be found in the statement of financial position or balance sheet.
The current liabilities of A2 Milk contains trade and other payable and income tax
payable. The current liabilities of Bellamy’s Australia include trade and other
payable, borrowings, provisions, derivatives and current tax liabilities (Laux 2013).
A2 Milk does not have any contingent liability in 2018 and this can be seen in Note
D9 of the financial statements. As per the Note 24 of the financial statements of
Bellamy’s Australia, the company has a contingent liability where due to the
proceedings of Staler and Gordon on 23 February 2017 and Maurice Blackburn on 8
March 2017 in the Federal Court of Australia. The claim is related to the allegation of
contravention of the Corporations Act 2001 (Cth) regarding depictive conduct and
obligation for continuous disclosure.
Non-Current Liabilities
1. Non-current liabilities can be found in the statement of financial position or balance
sheet. The non-current liabilities of A2 Milk includes only trade and other payable.
The non-current liabilities of Bellamy’s include only provision.
2. The notes of financial statement of A2 Milk states that employee entitlement is the
non-current liability of the firm; it also includes the value and description of the same.
The notes of Bellamy’s Australia shows the employee benefit is the non-current
liability of the firm. It also contains the description of the same.
3. The calculation of debt ratio is as follows:
Paraphrase This Document
Need a fresh take? Get an instant paraphrase of this document with our AI Paraphraser
7ACCOUNTING PRINCIPLES
As per the above table, A2 Milk has 0.23 and 0.30 debt ration which implies that the
firm has around four times and three times as many assets as it has liabilities in 2018 and
2017 respectively. In case of Bellamy’s Australia, the firm has around four times and more
than two times as many assets as it has liabilities in 2018 and 2017 respectively.
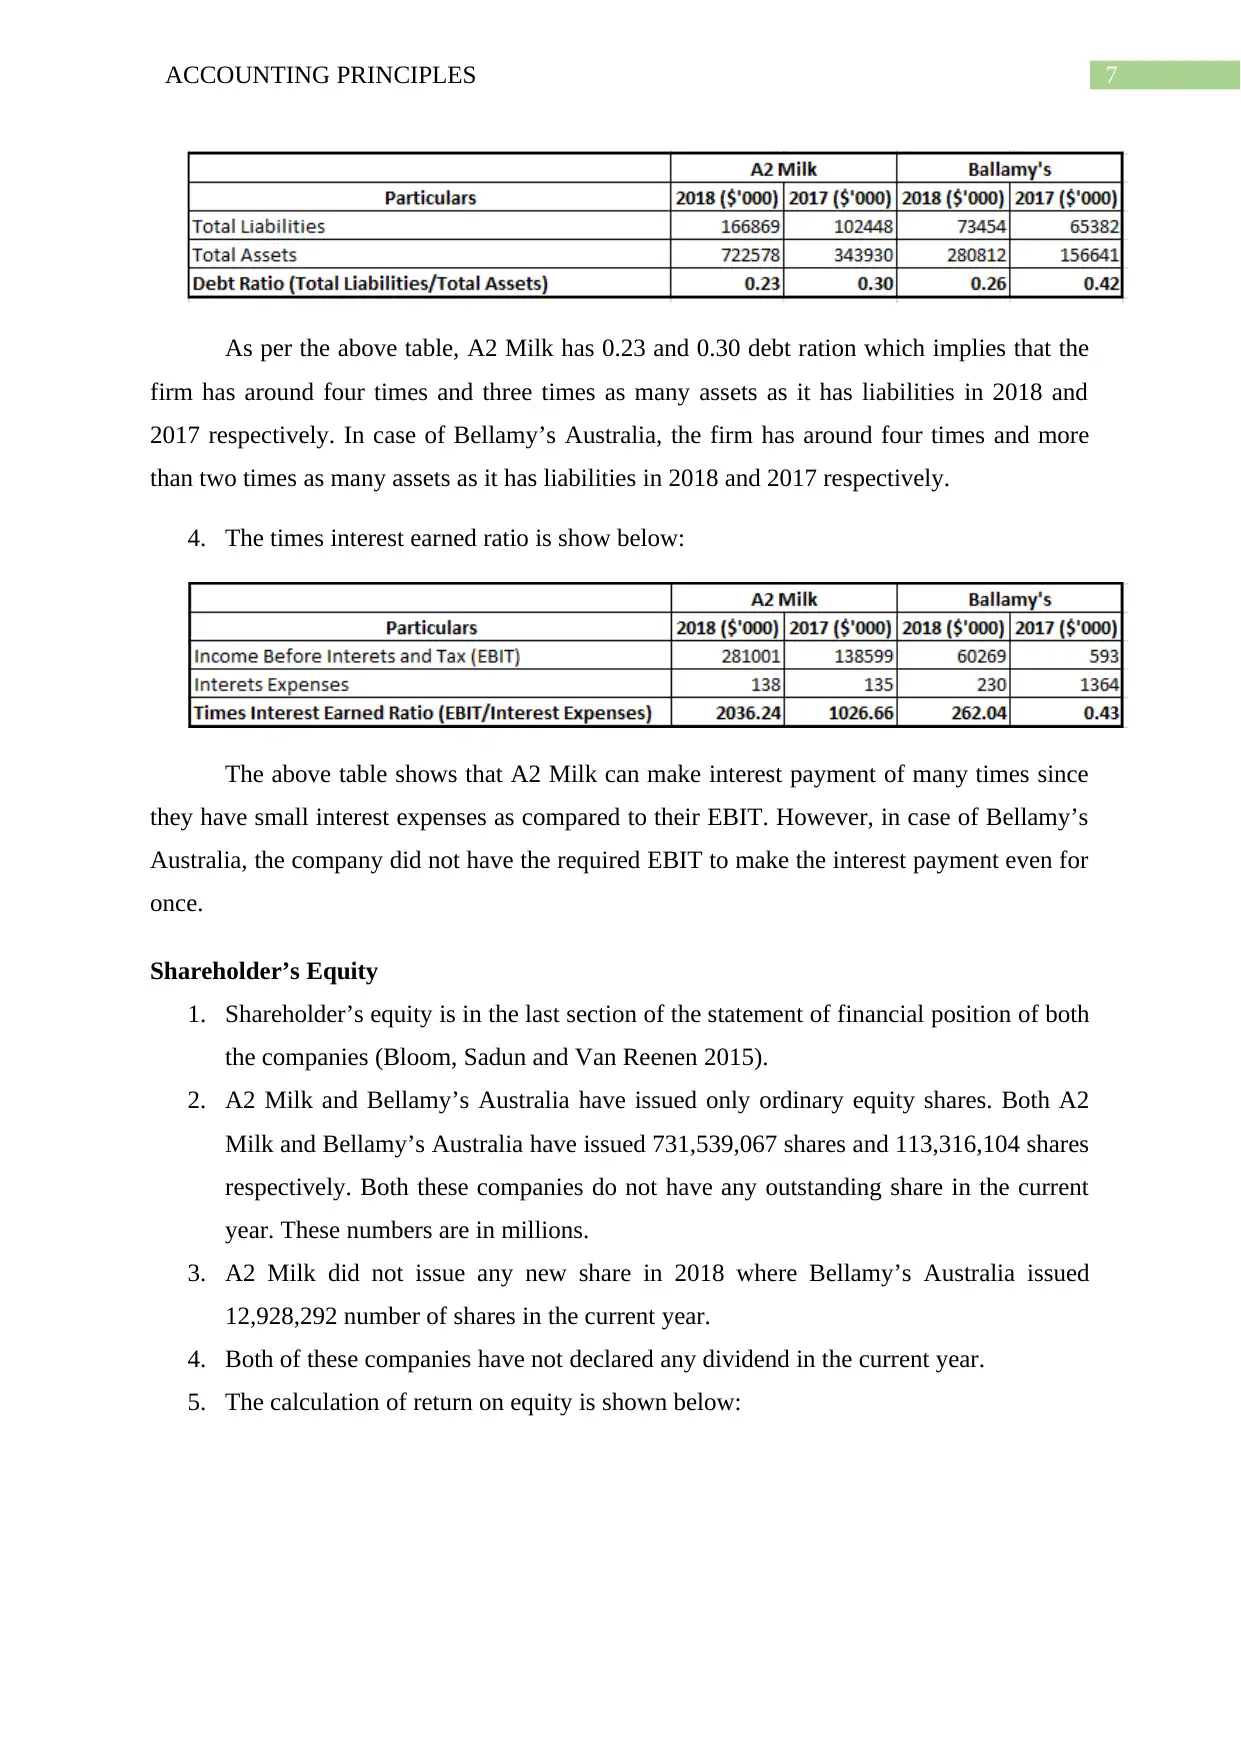
4. The times interest earned ratio is show below:
The above table shows that A2 Milk can make interest payment of many times since
they have small interest expenses as compared to their EBIT. However, in case of Bellamy’s
Australia, the company did not have the required EBIT to make the interest payment even for
once.
Shareholder’s Equity
1. Shareholder’s equity is in the last section of the statement of financial position of both
the companies (Bloom, Sadun and Van Reenen 2015).
2. A2 Milk and Bellamy’s Australia have issued only ordinary equity shares. Both A2
Milk and Bellamy’s Australia have issued 731,539,067 shares and 113,316,104 shares
respectively. Both these companies do not have any outstanding share in the current
year. These numbers are in millions.
3. A2 Milk did not issue any new share in 2018 where Bellamy’s Australia issued
12,928,292 number of shares in the current year.
4. Both of these companies have not declared any dividend in the current year.
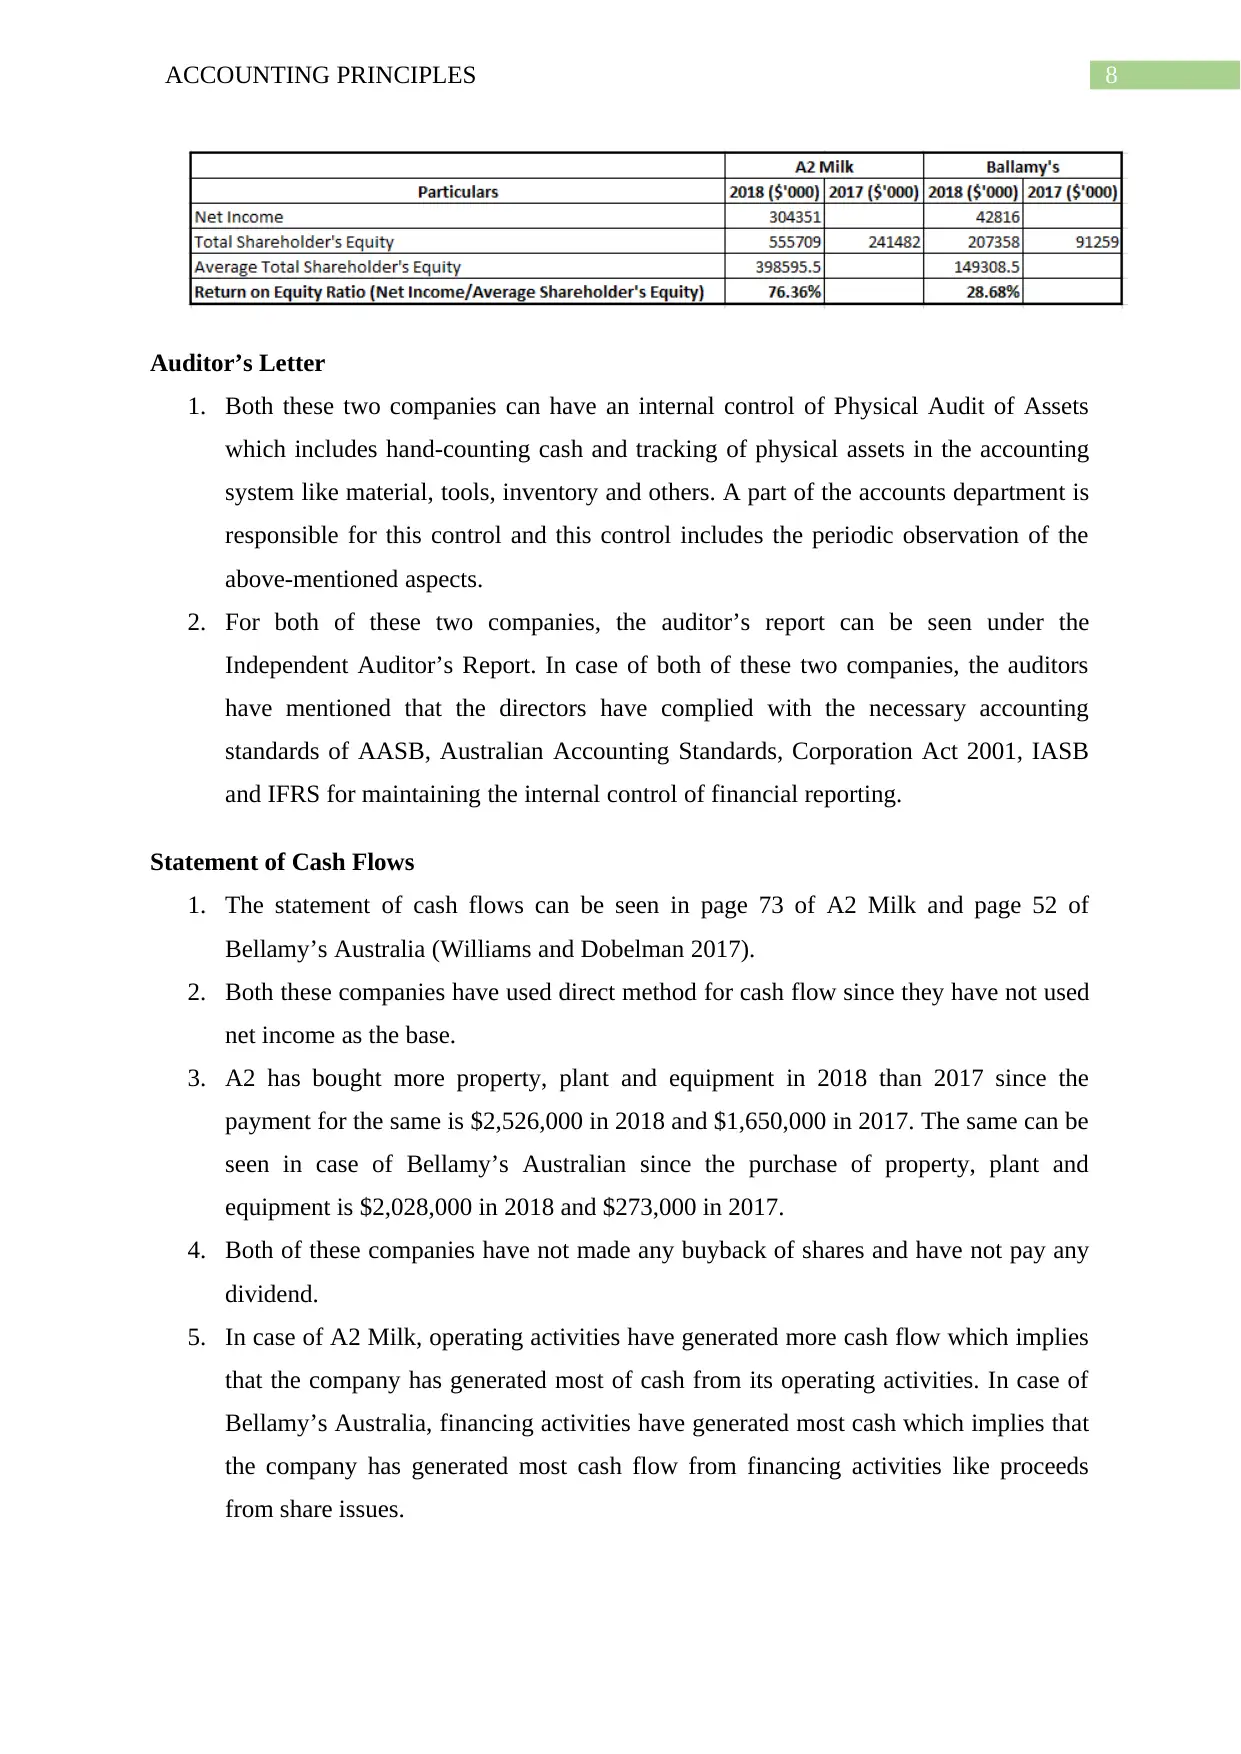
5. The calculation of return on equity is shown below:
As per the above table, A2 Milk has 0.23 and 0.30 debt ration which implies that the
firm has around four times and three times as many assets as it has liabilities in 2018 and
2017 respectively. In case of Bellamy’s Australia, the firm has around four times and more
than two times as many assets as it has liabilities in 2018 and 2017 respectively.
4. The times interest earned ratio is show below:
The above table shows that A2 Milk can make interest payment of many times since
they have small interest expenses as compared to their EBIT. However, in case of Bellamy’s
Australia, the company did not have the required EBIT to make the interest payment even for
once.
Shareholder’s Equity
1. Shareholder’s equity is in the last section of the statement of financial position of both
the companies (Bloom, Sadun and Van Reenen 2015).
2. A2 Milk and Bellamy’s Australia have issued only ordinary equity shares. Both A2
Milk and Bellamy’s Australia have issued 731,539,067 shares and 113,316,104 shares
respectively. Both these companies do not have any outstanding share in the current
year. These numbers are in millions.
3. A2 Milk did not issue any new share in 2018 where Bellamy’s Australia issued
12,928,292 number of shares in the current year.
4. Both of these companies have not declared any dividend in the current year.
5. The calculation of return on equity is shown below:
8ACCOUNTING PRINCIPLES
Auditor’s Letter
1. Both these two companies can have an internal control of Physical Audit of Assets
which includes hand-counting cash and tracking of physical assets in the accounting
system like material, tools, inventory and others. A part of the accounts department is
responsible for this control and this control includes the periodic observation of the
above-mentioned aspects.
2. For both of these two companies, the auditor’s report can be seen under the
Independent Auditor’s Report. In case of both of these two companies, the auditors
have mentioned that the directors have complied with the necessary accounting
standards of AASB, Australian Accounting Standards, Corporation Act 2001, IASB
and IFRS for maintaining the internal control of financial reporting.
Statement of Cash Flows
1. The statement of cash flows can be seen in page 73 of A2 Milk and page 52 of
Bellamy’s Australia (Williams and Dobelman 2017).
2. Both these companies have used direct method for cash flow since they have not used
net income as the base.
3. A2 has bought more property, plant and equipment in 2018 than 2017 since the
payment for the same is $2,526,000 in 2018 and $1,650,000 in 2017. The same can be
seen in case of Bellamy’s Australian since the purchase of property, plant and
equipment is $2,028,000 in 2018 and $273,000 in 2017.
4. Both of these companies have not made any buyback of shares and have not pay any
dividend.
5. In case of A2 Milk, operating activities have generated more cash flow which implies
that the company has generated most of cash from its operating activities. In case of
Bellamy’s Australia, financing activities have generated most cash which implies that
the company has generated most cash flow from financing activities like proceeds
from share issues.
⊘ This is a preview!⊘
Do you want full access?
Subscribe today to unlock all pages.
Trusted by 1+ million students worldwide
9ACCOUNTING PRINCIPLES
Ratio Analysis
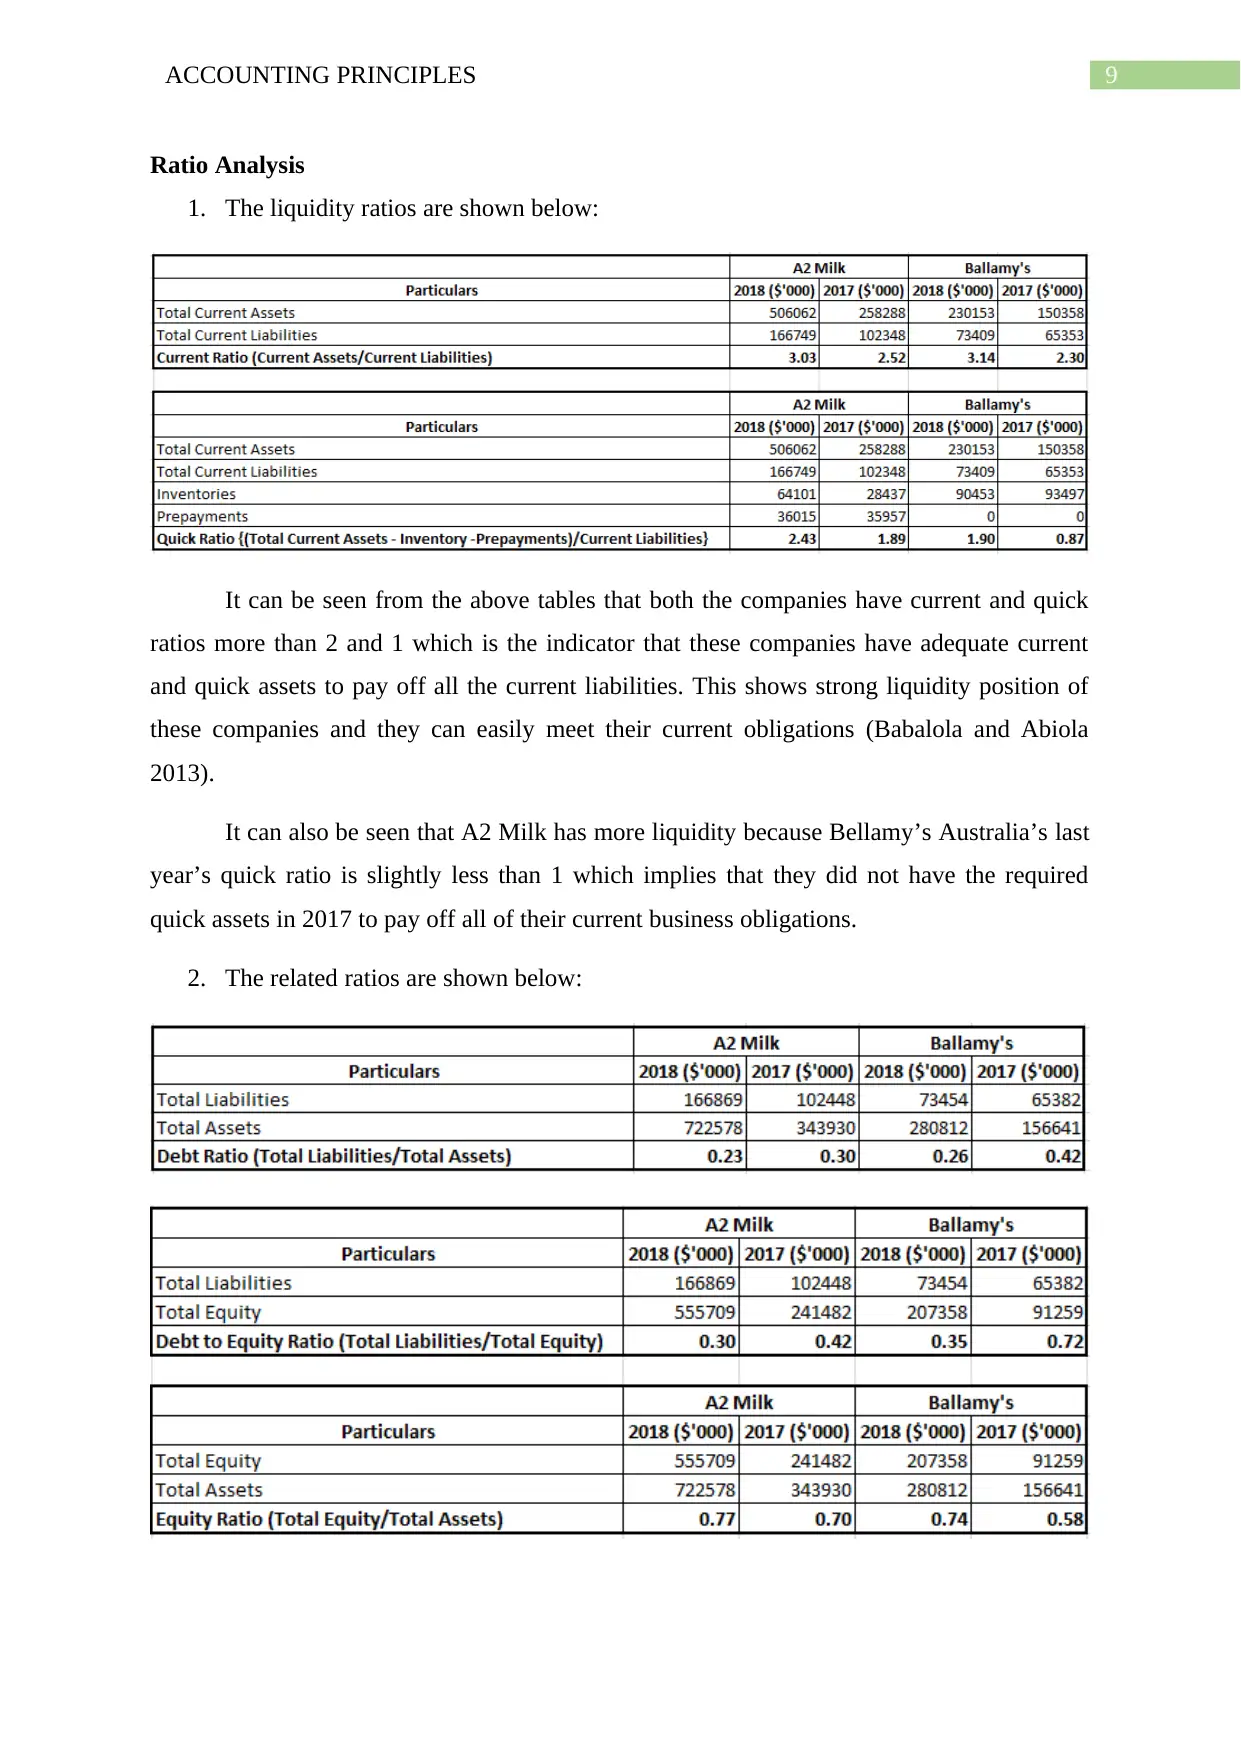
1. The liquidity ratios are shown below:
It can be seen from the above tables that both the companies have current and quick
ratios more than 2 and 1 which is the indicator that these companies have adequate current
and quick assets to pay off all the current liabilities. This shows strong liquidity position of
these companies and they can easily meet their current obligations (Babalola and Abiola
2013).
It can also be seen that A2 Milk has more liquidity because Bellamy’s Australia’s last
year’s quick ratio is slightly less than 1 which implies that they did not have the required
quick assets in 2017 to pay off all of their current business obligations.
2. The related ratios are shown below:
Ratio Analysis
1. The liquidity ratios are shown below:
It can be seen from the above tables that both the companies have current and quick
ratios more than 2 and 1 which is the indicator that these companies have adequate current
and quick assets to pay off all the current liabilities. This shows strong liquidity position of
these companies and they can easily meet their current obligations (Babalola and Abiola
2013).
It can also be seen that A2 Milk has more liquidity because Bellamy’s Australia’s last
year’s quick ratio is slightly less than 1 which implies that they did not have the required
quick assets in 2017 to pay off all of their current business obligations.
2. The related ratios are shown below:
Paraphrase This Document
Need a fresh take? Get an instant paraphrase of this document with our AI Paraphraser
10ACCOUNTING PRINCIPLES
It can be seen from the above tables that both A2 Milk and Bellamy’s Australia has
less amount of debts as compare to total assets. It can also be seen that these companies have
emphasized on equity shares for raising capital. All these aspects indicates towards the fact
that it is easy for these two companies to meet their long-term obligations due to the presence
of less amount of debts as compared to total assets.
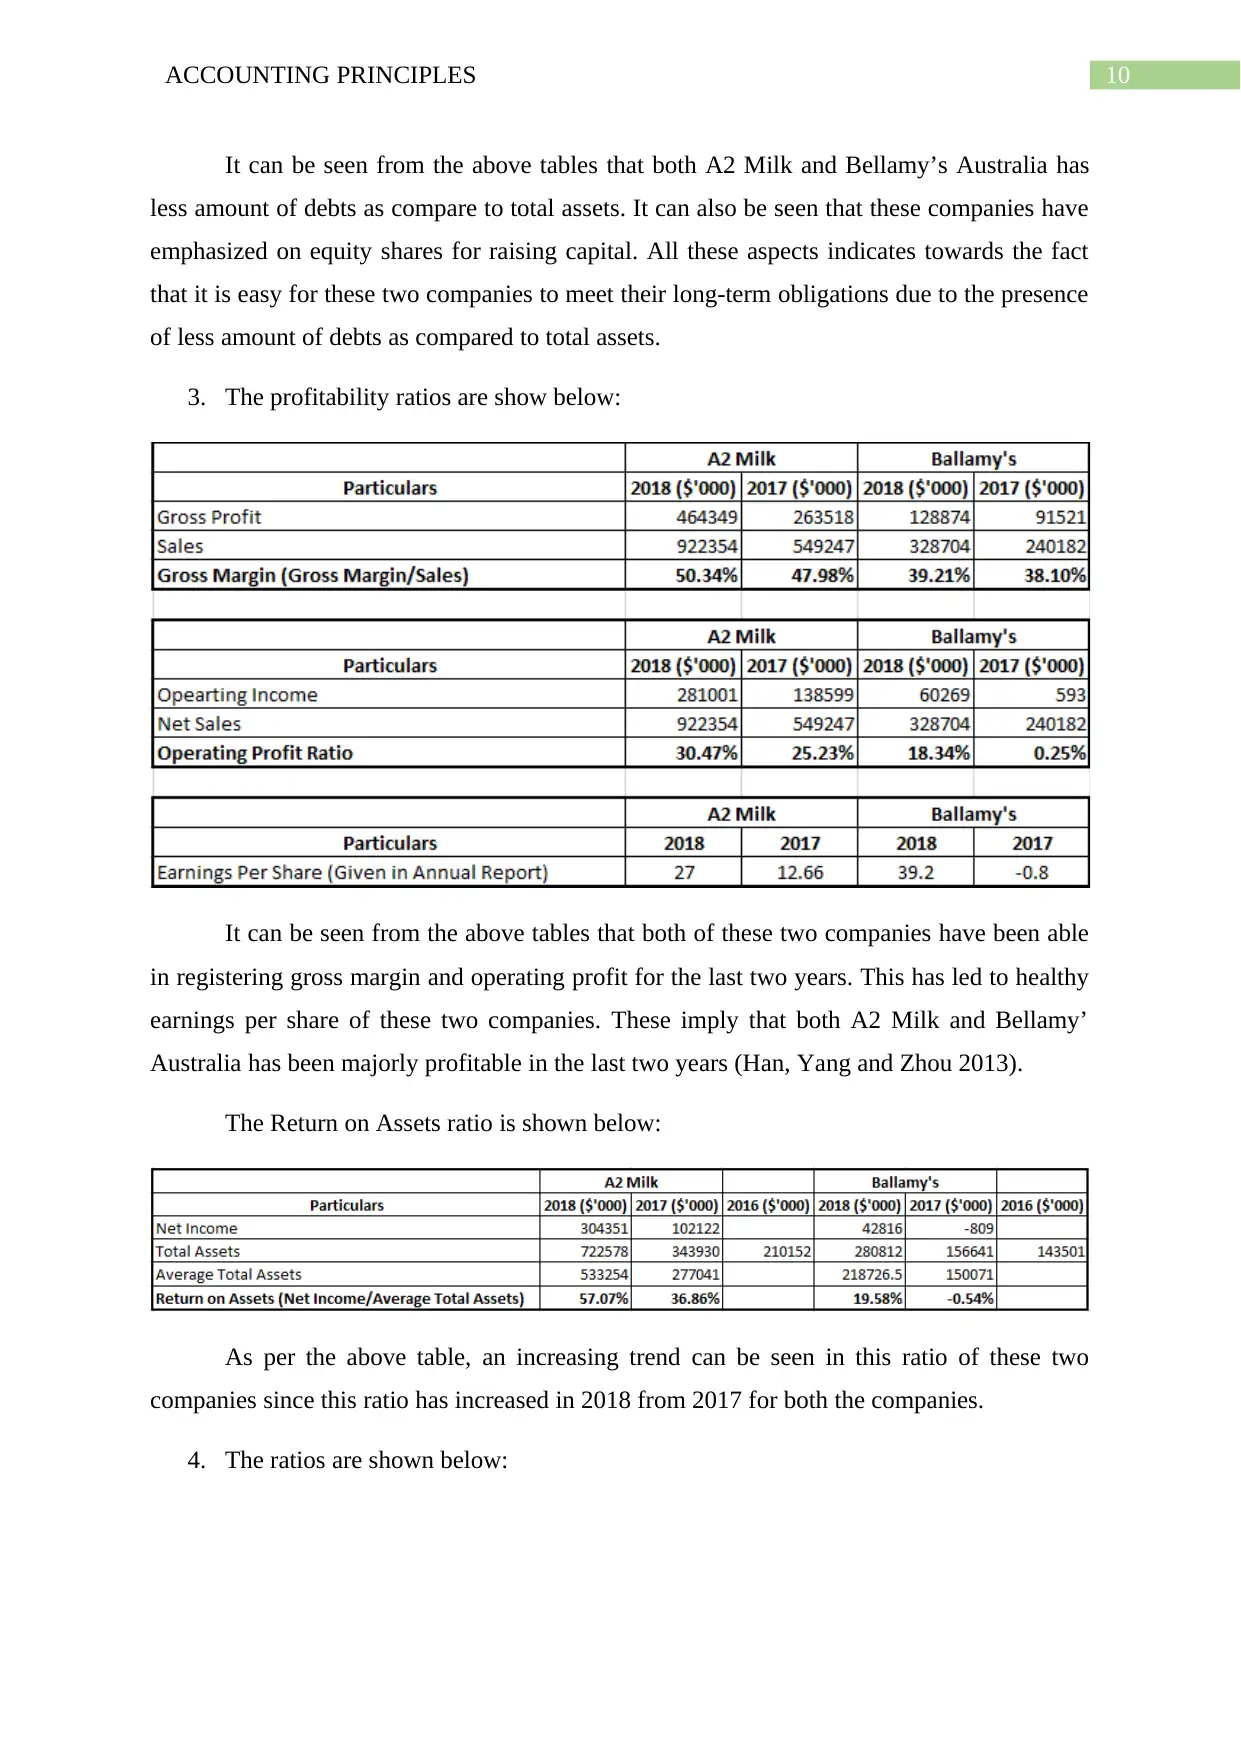
3. The profitability ratios are show below:
It can be seen from the above tables that both of these two companies have been able
in registering gross margin and operating profit for the last two years. This has led to healthy
earnings per share of these two companies. These imply that both A2 Milk and Bellamy’
Australia has been majorly profitable in the last two years (Han, Yang and Zhou 2013).
The Return on Assets ratio is shown below:
As per the above table, an increasing trend can be seen in this ratio of these two
companies since this ratio has increased in 2018 from 2017 for both the companies.
4. The ratios are shown below:
It can be seen from the above tables that both A2 Milk and Bellamy’s Australia has
less amount of debts as compare to total assets. It can also be seen that these companies have
emphasized on equity shares for raising capital. All these aspects indicates towards the fact
that it is easy for these two companies to meet their long-term obligations due to the presence
of less amount of debts as compared to total assets.
3. The profitability ratios are show below:
It can be seen from the above tables that both of these two companies have been able
in registering gross margin and operating profit for the last two years. This has led to healthy
earnings per share of these two companies. These imply that both A2 Milk and Bellamy’
Australia has been majorly profitable in the last two years (Han, Yang and Zhou 2013).
The Return on Assets ratio is shown below:
As per the above table, an increasing trend can be seen in this ratio of these two
companies since this ratio has increased in 2018 from 2017 for both the companies.
4. The ratios are shown below:
11ACCOUNTING PRINCIPLES
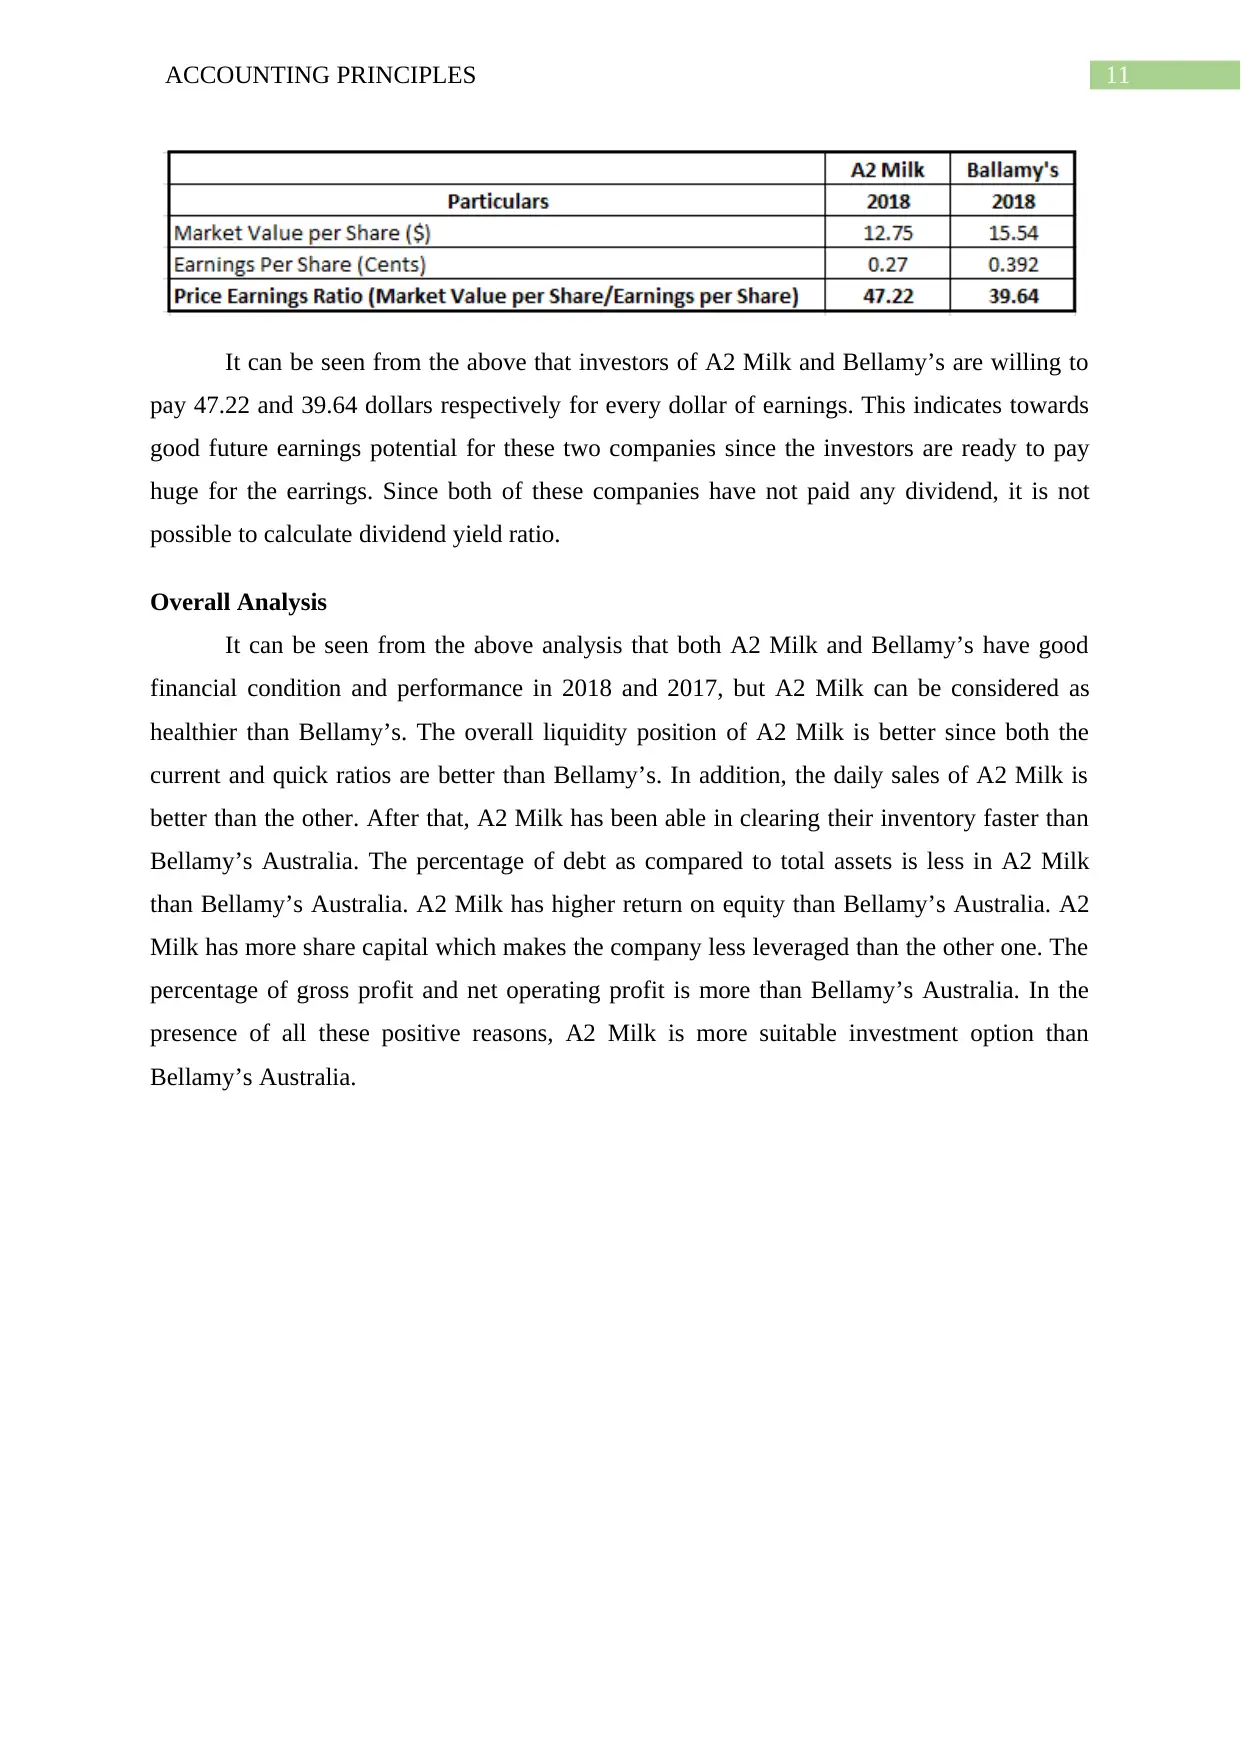
It can be seen from the above that investors of A2 Milk and Bellamy’s are willing to
pay 47.22 and 39.64 dollars respectively for every dollar of earnings. This indicates towards
good future earnings potential for these two companies since the investors are ready to pay
huge for the earrings. Since both of these companies have not paid any dividend, it is not
possible to calculate dividend yield ratio.
Overall Analysis
It can be seen from the above analysis that both A2 Milk and Bellamy’s have good
financial condition and performance in 2018 and 2017, but A2 Milk can be considered as
healthier than Bellamy’s. The overall liquidity position of A2 Milk is better since both the
current and quick ratios are better than Bellamy’s. In addition, the daily sales of A2 Milk is
better than the other. After that, A2 Milk has been able in clearing their inventory faster than
Bellamy’s Australia. The percentage of debt as compared to total assets is less in A2 Milk
than Bellamy’s Australia. A2 Milk has higher return on equity than Bellamy’s Australia. A2
Milk has more share capital which makes the company less leveraged than the other one. The
percentage of gross profit and net operating profit is more than Bellamy’s Australia. In the
presence of all these positive reasons, A2 Milk is more suitable investment option than
Bellamy’s Australia.
⊘ This is a preview!⊘
Do you want full access?
Subscribe today to unlock all pages.
Trusted by 1+ million students worldwide
1 out of 14
Related Documents


Your All-in-One AI-Powered Toolkit for Academic Success.
+13062052269
info@desklib.com
Available 24*7 on WhatsApp / Email
![[object Object]](/_next/static/media/star-bottom.7253800d.svg)
Unlock your academic potential
Copyright © 2020–2026 A2Z Services. All Rights Reserved. Developed and managed by ZUCOL.