MBA Financial Analysis: A Financial Comparison of Ryanair & Air Arabia
VerifiedAdded on 2023/05/30
|41
|11848
|198
Report
AI Summary
This report provides a comparative financial analysis of Ryanair and Air Arabia, two airlines operating in Europe and the Middle East, respectively. The analysis utilizes profitability, liquidity, efficiency, and gearing ratios, along with horizontal and vertical analysis of financial statements from 2015 to 2017/2018. The study evaluates business performance, focusing on key financial and non-financial measures relevant to the airline industry. Ryanair demonstrates consistent revenue and higher efficiency, while Air Arabia shows better performance in profitability and leverage. Recommendations include cost optimization and standardization of aircraft models to improve financial performance. The report concludes with a detailed comparison, highlighting the strengths and weaknesses of each airline based on the analyzed financial metrics.
Financial Reporting and Analysis
Name of the Student
Name of the University
Author’s Note
Name of the Student
Name of the University
Author’s Note
Paraphrase This Document
Need a fresh take? Get an instant paraphrase of this document with our AI Paraphraser
Executive Summary
The study has performed financial comparison of Ryan Air and Air Arabia. The methodology
used in the report is a range of profitability ratios, liquidity ratios, efficiency ratios and gearing
ratios. The study has also used the technique of horizontal and vertical analysis for a more vivid
description of changes in the key areas of income statement and the balance sheet. This section
of the study has included the investigation of five main areas of financial statement ranging from
total Noncurrent assets, total current assets, total current liabilities, total long-term liabilities and
total shareholder. The overall evaluation has suggested that when comparing financial
parameters such as profitability, leverage and loans to capital employed Air Arabia performed
better than Ryan Air. When the income statements of both the airlines are compared for three
years, it could be stated that lower revenue fluctuations are observed in Ryanair and its
performance is deemed to be more consistent than Air Arabia. This is mainly owing to a range of
factors such as the operations of Ryanair in a stable geopolitical environment, favorable brand
image in the market. On the other hand, the regions of Air Arabia are reliant on the fuel sector
and hence, it is highly sensitive to changes in the prices of fuel. However, when parameters such
as efficiency are considered, Ryan Air has clearly excelled in performance. Some of the major
recommendations for improving the financial perspective is identified with optimizing the costs
incurred for the airlines. In addition to this, the achievement of targets is related to plane leasing
cost and seat revenue. This can be improved by standardizing the models of the planes used by
both the airliners.
Table of Contents
Introduction..........................................................................................................................3
Profitability Ratios...............................................................................................................4
.............................................................................................................................................6
Efficiency Ratios.................................................................................................................6
Liquidity Ratios...................................................................................................................6
Gearing Ratios.....................................................................................................................7
Horizontal Analysis (Please use 2015 as the base year)......................................................8
Vertical Analysis.................................................................................................................9
Evaluation of Business Performance of Air Arabia..........................................................10
Structuring of the Airline...............................................................................................10
Identification of business success measured in the airline industry..............................10
Focus most applicable to the airline..............................................................................11
Examining financial and non-financial measure of performance..................................12
Using direct competition as a means of evaluating the performance............................21
Comparative Analysis between the airlines.......................................................................21
Conclusion.........................................................................................................................23
Recommendations..............................................................................................................24
References..........................................................................................................................26
List of Appendix................................................................................................................32
Ratio Analysis................................................................................................................32
Horizontal Analysis.......................................................................................................36
Vertical Analysis...........................................................................................................38
⊘ This is a preview!⊘
Do you want full access?
Subscribe today to unlock all pages.
Trusted by 1+ million students worldwide
Introduction
The report presents a comparative analysis of two chosen airlines. It investigates their
financial positions in the aviation industry of Europe and the Middle East. The two airlines that
have been chosen for this paper include Ryanair and Air Arabia. Ryanair is a low-cost Irish-
based airline established in 1984 having primary operational bases at London Stansted and
Dublin airports. It has become the largest European airline in 2016 in terms of passengers carried
and more precisely, it has carried more international passengers than any other airline
(Ryanair.com 2018). On the other hand, Air Arabia provides offers global commercial air
transportation, passenger transport, cargo services and aircraft rental. The airline is involved in
providing its passenger transport services via buses, cars, air travel and limousine to 130
destinations in Africa, Europe and the Middle East (Airarabia.com 2018). Although the financial
year ends for Ryanair and Air Arabia fall on different times during the year, for standardization
purposes, this report assumes the historical periods (2015-2018) for each organization to be the
same.
The analysis looked comparatively at three significant financial ratios, which include
profitability ratio, liquidity ratio and efficiency ratio for the two airlines. The business strategies
are evaluated as well by using the balanced scorecard approach for understanding the sustainable
ground for future prosperity. This analysis would assist the stakeholders in undertaking decisions
regarding the financial conditions of the airlines.
Profitability Ratios
Net and Gross Profit Margins
According to the profitability ratio table provided below, Ryanair’s net and gross profit
ratios follow a similar trend. The year 2016 yielded the highest ratios although it did not yield
Paraphrase This Document
Need a fresh take? Get an instant paraphrase of this document with our AI Paraphraser
the highest revenue. From the notes attached to the 2016 Ryanair financial report, this is credited
to the fact that Ryanair sold its holding in Aer Lingus in that year. This led to an increase in the
gross and net profits. Excluding this fact, Ryanair continued to show a steady growth in revenue
for the 3- year period. This was due to fuel prices going down worldwide while Ryanair’s market
share was getting bigger due to expansion and customer focus through launching the “Always
Getting Better” program.
Ryanair’s revenue in 2017 is higher than the previous year but this increment is marginal
when compared to the growth in revenue between 2015 and 2016. 2017 was a difficult year for
the aviation industry in Europe due to different terror attacks in the region and large charters
taking a large market share in Portugal and Spain, Ryanair’s lead markets (Ryanair-FY2017-
Annual-Report.pdf, 2018).
In contrast to Ryanair, Air Arabia has its worst financial performance within the 3-year
period in 2016. The drop in fuel prices negatively impacted the Middle East as it is an oil
producing region. The price drop led to a general regression in the region’s economy and
specifically hit the aviation sector, as it made it more challenging to obtain better yields per unit.
Added to this was the overcapacity of the Middle East’s aviation market when compared to the
demand on air travel. The Middle Eastern carriers continued their fleet expansion during difficult
economic times based on previous demand forecasts (Air Arabia Annual Report 2016, 2017).
This is reflected on Air Arabia’s financial statements for the year 2016 as its revenues went
down while its assets kept growing.
On the other hand, 2017 was a good year for Air Arabia as it succeeded in achieving an
all-time record profit. Although the revenue for this year was lower than that of 2016, Air Arabia
managed to substantially lower its costs thus resulting in bigger gross and net profits.
Return on Equity
Return on equity denotes the portion of return that an organization makes from the
investment of the shareholders (Barr and McClellan, 2018). Similar to the previous Ryanair’s
(ROE) was at its highest in 2016. Along with growth in revenue and in profit, 2016 showed a
decrease in equity for Ryanair due to the sale of its shareholder equity in Aer Lingus. According
to csimarket.com, the average ROE for the airline industry falls at 23.3%. Ryanair has recorded a
higher than market average ROE for all the 3 years.
For Air Arabia, 2016 is again the year with the weakest performance. Reasons for this are
discussed above. The ROE values for Air Arabia fall below the industry average. This could be
attributed to the fact that Air Arabia has been in existence only since 2003 and still relies heavily
on the capital invested rather than the investments from equity. Whereas in Ryanair 30 years of
successful operations means that it can rely less on capital invested and is thus is able to generate
more income from investments made on shareholders’ equity.
Return on Capital Employed (ROCE)
Return on capital employed is used for illustrating the ways through which an
organization uses its long-term investments for generation of income (Bekaert and Hodrick,
2017). Although Ryanair has increased market share, Ryanair has not been able to use its long-
term investment supplies for generating income due to minimized return on capital employed.
On the other hand, the ratio has remained stagnantly low for Air Arabia in all three years due to
lower market share.
⊘ This is a preview!⊘
Do you want full access?
Subscribe today to unlock all pages.
Trusted by 1+ million students worldwide
Profitability Ratios:
Particulars 2017 2016 2015 2017 2016 2015
$m $m $m $m $m $m
Profit for the year A 1316.0 1559.0 867.0 631.0 490.0 511.0
Revenue B 6648.0 6536.0 5654.0 3739.0 3778.0 3826.0
Total Assets C 11990.0 11218.0 12185.0 12964.0 12513.0 11399.0
Total Equity D 4423.0 3597.0 4035.0 6036.0 5443.0 4962.0
Gross Profit I 1856.0 1753.0 1277.0 349.0 262.0 366.0
Capital Employed J 1694 1452 2396 993 559 282
Net Profit Margin E= A/B 19.80% 23.85% 15.33% 16.88% 12.97% 13.36%
Return on Equity (ROE) F=A/D 30% 43% 21% 10% 9% 10%
Return on Capital Employed (ROCE) G=A/J 78% 107% 36% 64% 88% 181%
Gross Profit Margin H=I/B 28% 27% 23% 9% 7% 10%
Ryanair AirArabia
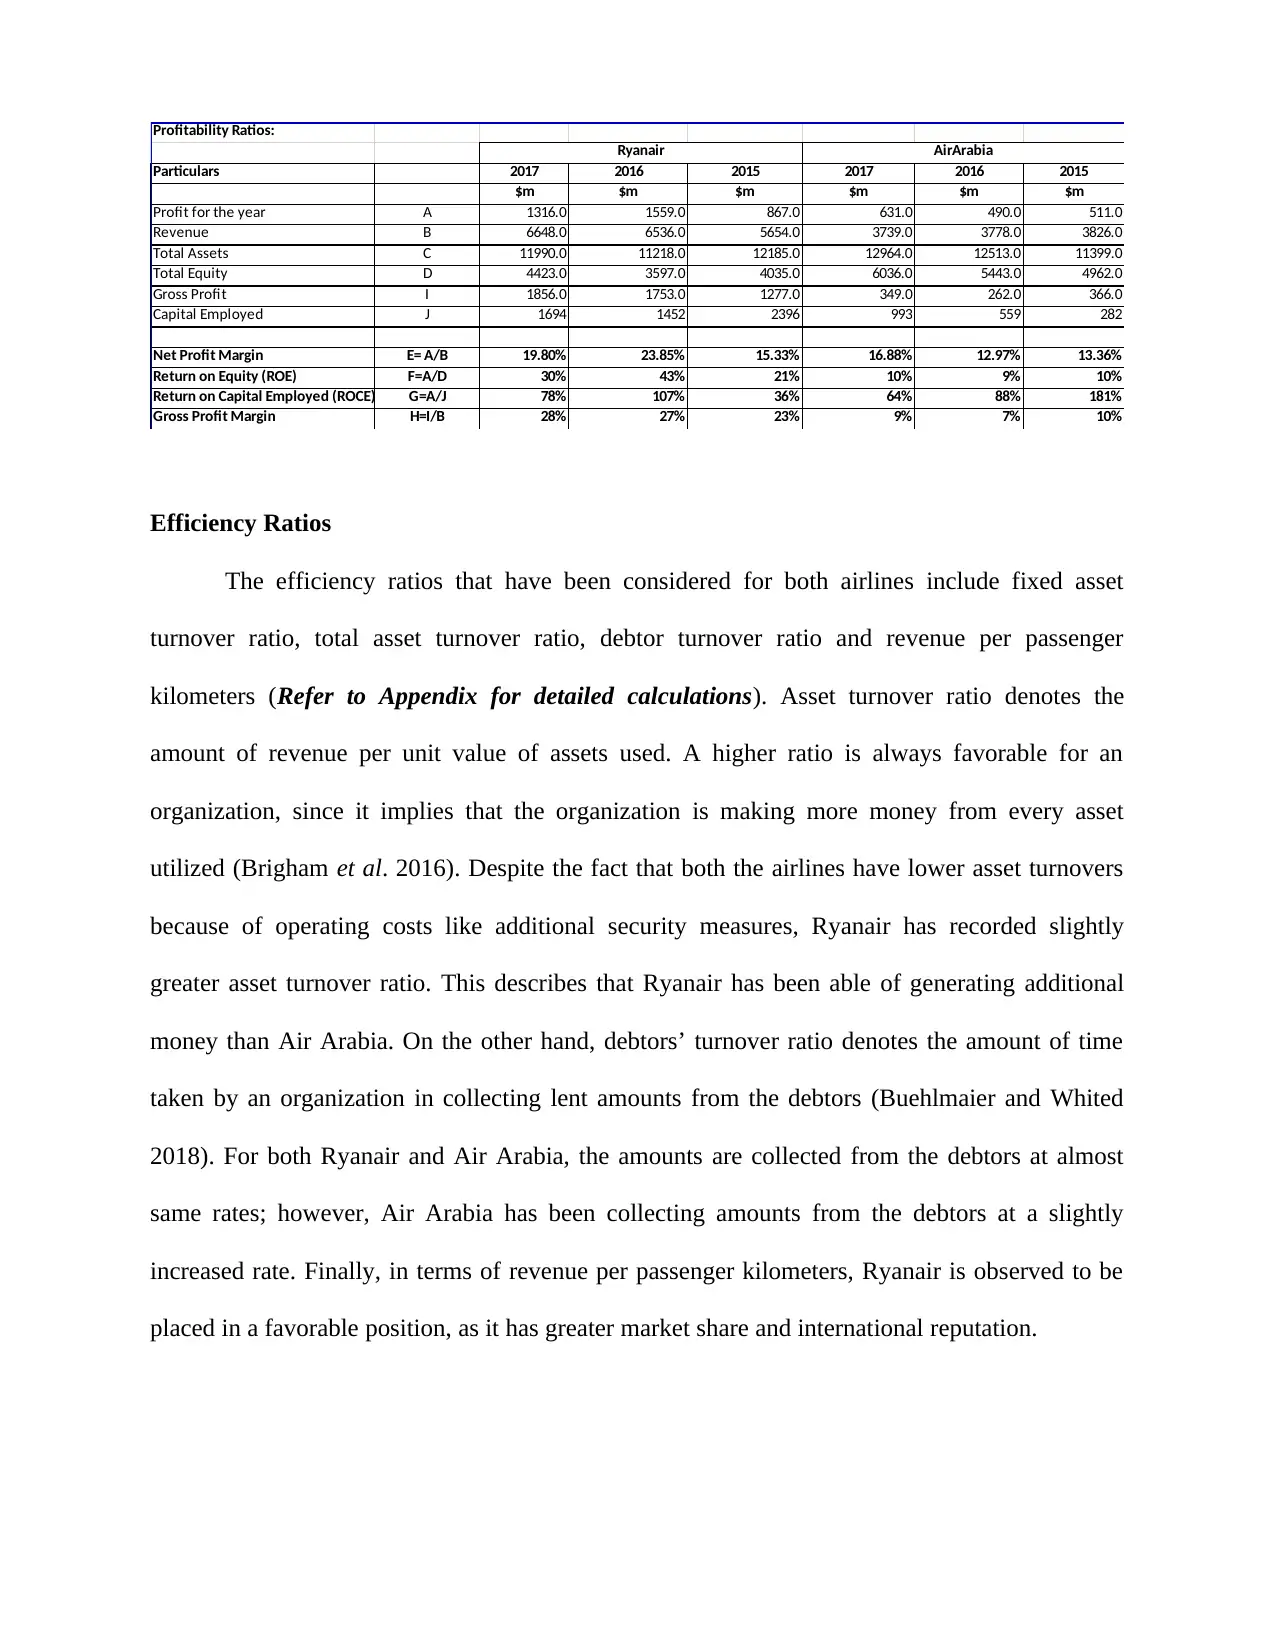
Efficiency Ratios
The efficiency ratios that have been considered for both airlines include fixed asset
turnover ratio, total asset turnover ratio, debtor turnover ratio and revenue per passenger
kilometers (Refer to Appendix for detailed calculations). Asset turnover ratio denotes the
amount of revenue per unit value of assets used. A higher ratio is always favorable for an
organization, since it implies that the organization is making more money from every asset
utilized (Brigham et al. 2016). Despite the fact that both the airlines have lower asset turnovers
because of operating costs like additional security measures, Ryanair has recorded slightly
greater asset turnover ratio. This describes that Ryanair has been able of generating additional
money than Air Arabia. On the other hand, debtors’ turnover ratio denotes the amount of time
taken by an organization in collecting lent amounts from the debtors (Buehlmaier and Whited
2018). For both Ryanair and Air Arabia, the amounts are collected from the debtors at almost
same rates; however, Air Arabia has been collecting amounts from the debtors at a slightly
increased rate. Finally, in terms of revenue per passenger kilometers, Ryanair is observed to be
placed in a favorable position, as it has greater market share and international reputation.
Particulars 2017 2016 2015 2017 2016 2015
$m $m $m $m $m $m
Profit for the year A 1316.0 1559.0 867.0 631.0 490.0 511.0
Revenue B 6648.0 6536.0 5654.0 3739.0 3778.0 3826.0
Total Assets C 11990.0 11218.0 12185.0 12964.0 12513.0 11399.0
Total Equity D 4423.0 3597.0 4035.0 6036.0 5443.0 4962.0
Gross Profit I 1856.0 1753.0 1277.0 349.0 262.0 366.0
Capital Employed J 1694 1452 2396 993 559 282
Net Profit Margin E= A/B 19.80% 23.85% 15.33% 16.88% 12.97% 13.36%
Return on Equity (ROE) F=A/D 30% 43% 21% 10% 9% 10%
Return on Capital Employed (ROCE) G=A/J 78% 107% 36% 64% 88% 181%
Gross Profit Margin H=I/B 28% 27% 23% 9% 7% 10%
Ryanair AirArabia
Efficiency Ratios
The efficiency ratios that have been considered for both airlines include fixed asset
turnover ratio, total asset turnover ratio, debtor turnover ratio and revenue per passenger
kilometers (Refer to Appendix for detailed calculations). Asset turnover ratio denotes the
amount of revenue per unit value of assets used. A higher ratio is always favorable for an
organization, since it implies that the organization is making more money from every asset
utilized (Brigham et al. 2016). Despite the fact that both the airlines have lower asset turnovers
because of operating costs like additional security measures, Ryanair has recorded slightly
greater asset turnover ratio. This describes that Ryanair has been able of generating additional
money than Air Arabia. On the other hand, debtors’ turnover ratio denotes the amount of time
taken by an organization in collecting lent amounts from the debtors (Buehlmaier and Whited
2018). For both Ryanair and Air Arabia, the amounts are collected from the debtors at almost
same rates; however, Air Arabia has been collecting amounts from the debtors at a slightly
increased rate. Finally, in terms of revenue per passenger kilometers, Ryanair is observed to be
placed in a favorable position, as it has greater market share and international reputation.
Paraphrase This Document
Need a fresh take? Get an instant paraphrase of this document with our AI Paraphraser
Liquidity Ratios
For analyzing the liquidity position of Ryanair and Air Arabia, the two liquidity ratios
that have been taken into consideration include current ratio and cash ratio. In the words of
Edwards (2014), current ratio implies the ability of an organization in transforming its assets into
liquid money. The standard current ratio is considered to be 2. In case of Ryanair, the ratio has
fallen from 1.72 in 2015 to 1.43 in 2016; however, it has increased to 1.56 in 2017. On the other
hand, for Ryanair, the ratio has slightly increased from 0.24 in 2015 to 0.25 in 2016 and there is
further slight increase to 0.27 in 2017. This implies that Ryanair has performed better in this
front by being able to convert its assets into cash for covering short-term liabilities rapidly. On
the other hand, Air Arabia has significantly lower current ratio signifying that it does not have
sound performance.
As commented by Erdogan, Erdogan and Ömürbek (2015), the cash ratio signifies the
ability of an organization in paying off its short-term liabilities with cash and cash equivalents.
More precisely, this ratio denotes cash and cash equivalents as a percentage of current liabilities.
In terms of cash ratio, the trend is observed to be increasing for both the airlines, as they have
managed to increase its cash base over the years.
Gearing Ratios
For analyzing the financial leverage position of Ryanair and Air Arabia, the three ratios
that have been taken into account include debt-to-equity ratio, debt ratio and equity ratio. As
stated by Finkler et al. (2016), debt-to-equity denotes the percentage of financing, which comes
from investors as well as creditors. When the ratio is higher, more bank loans are used than
shareholder funds. The ideal debt-to-equity ratio is considered to be 1 (Frias‐Aceituno,
Rodríguez‐Ariza and Garcia‐Sánchez 2014). In this case, the ratio for both the airlines has been
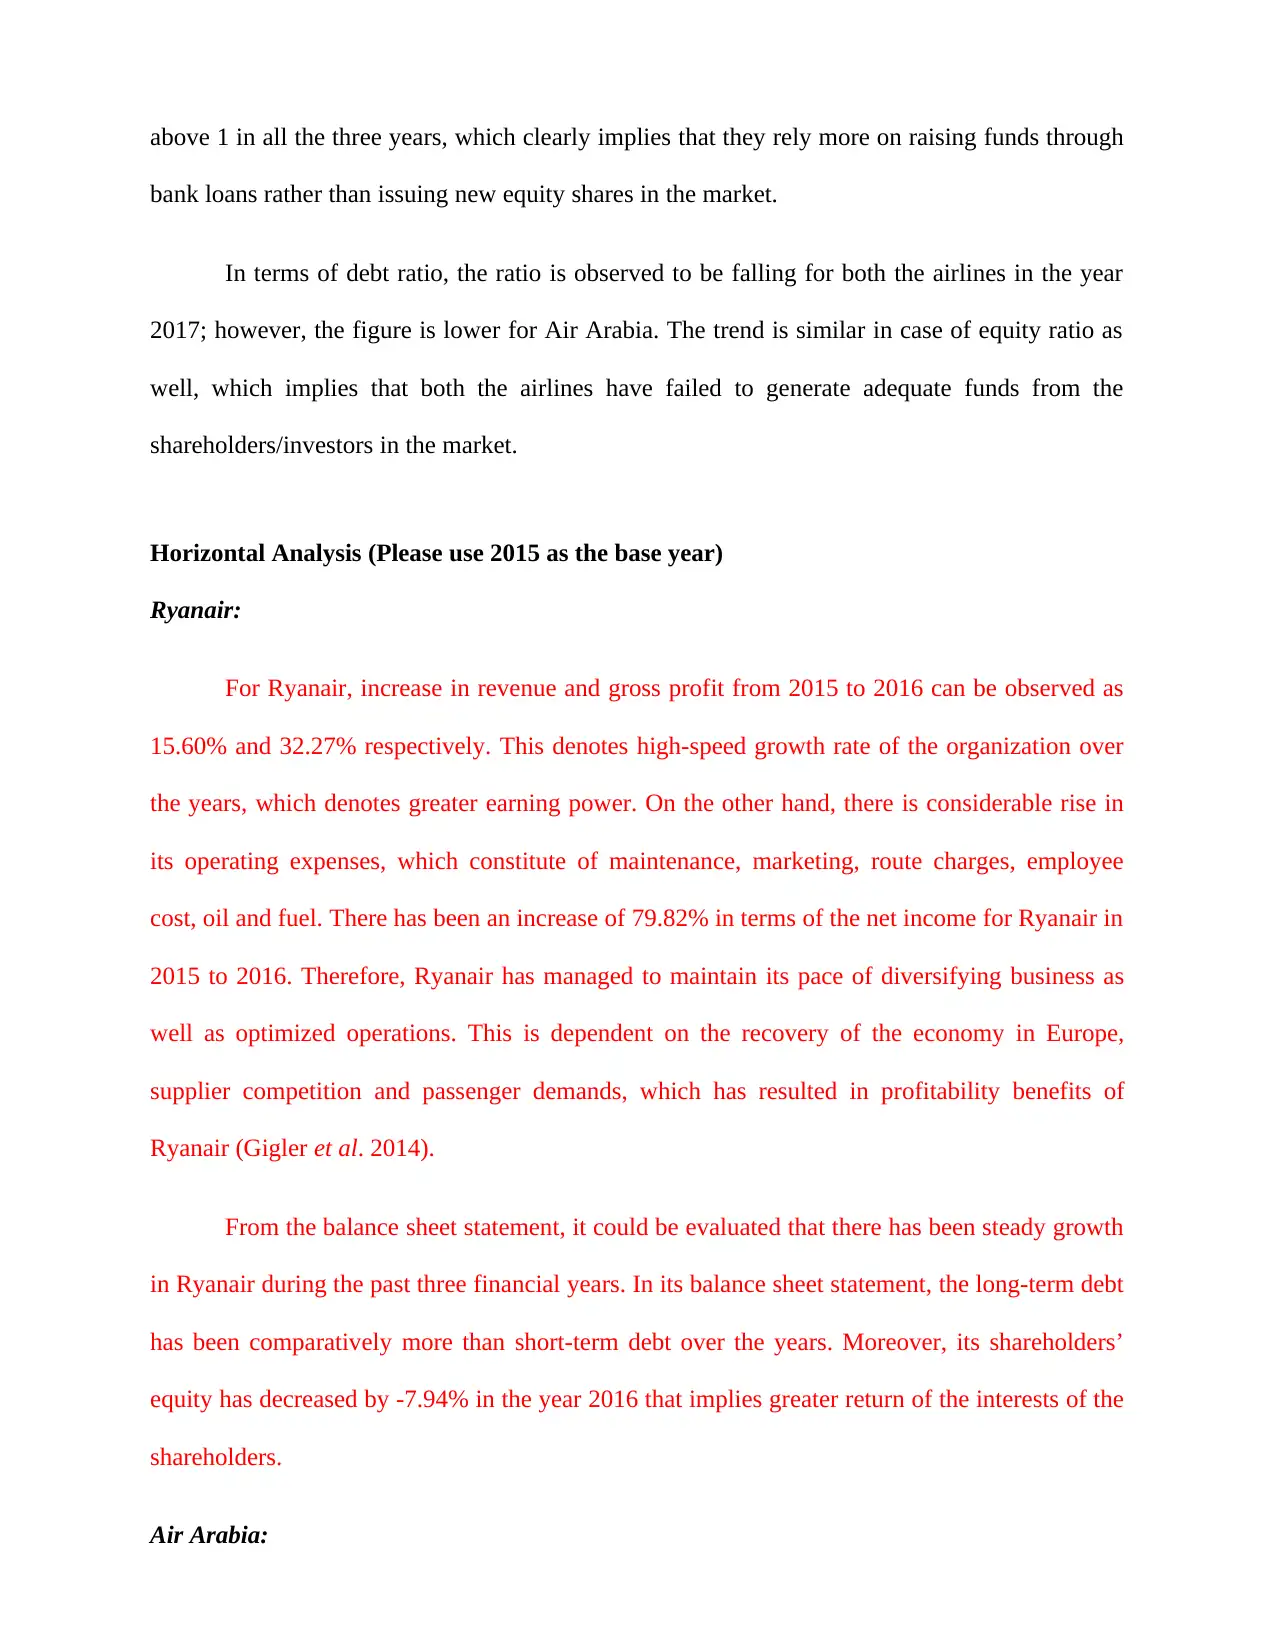
above 1 in all the three years, which clearly implies that they rely more on raising funds through
bank loans rather than issuing new equity shares in the market.
In terms of debt ratio, the ratio is observed to be falling for both the airlines in the year
2017; however, the figure is lower for Air Arabia. The trend is similar in case of equity ratio as
well, which implies that both the airlines have failed to generate adequate funds from the
shareholders/investors in the market.
Horizontal Analysis (Please use 2015 as the base year)
Ryanair:
For Ryanair, increase in revenue and gross profit from 2015 to 2016 can be observed as
15.60% and 32.27% respectively. This denotes high-speed growth rate of the organization over
the years, which denotes greater earning power. On the other hand, there is considerable rise in
its operating expenses, which constitute of maintenance, marketing, route charges, employee
cost, oil and fuel. There has been an increase of 79.82% in terms of the net income for Ryanair in
2015 to 2016. Therefore, Ryanair has managed to maintain its pace of diversifying business as
well as optimized operations. This is dependent on the recovery of the economy in Europe,
supplier competition and passenger demands, which has resulted in profitability benefits of
Ryanair (Gigler et al. 2014).
From the balance sheet statement, it could be evaluated that there has been steady growth
in Ryanair during the past three financial years. In its balance sheet statement, the long-term debt
has been comparatively more than short-term debt over the years. Moreover, its shareholders’
equity has decreased by -7.94% in the year 2016 that implies greater return of the interests of the
shareholders.
Air Arabia:
⊘ This is a preview!⊘
Do you want full access?
Subscribe today to unlock all pages.
Trusted by 1+ million students worldwide
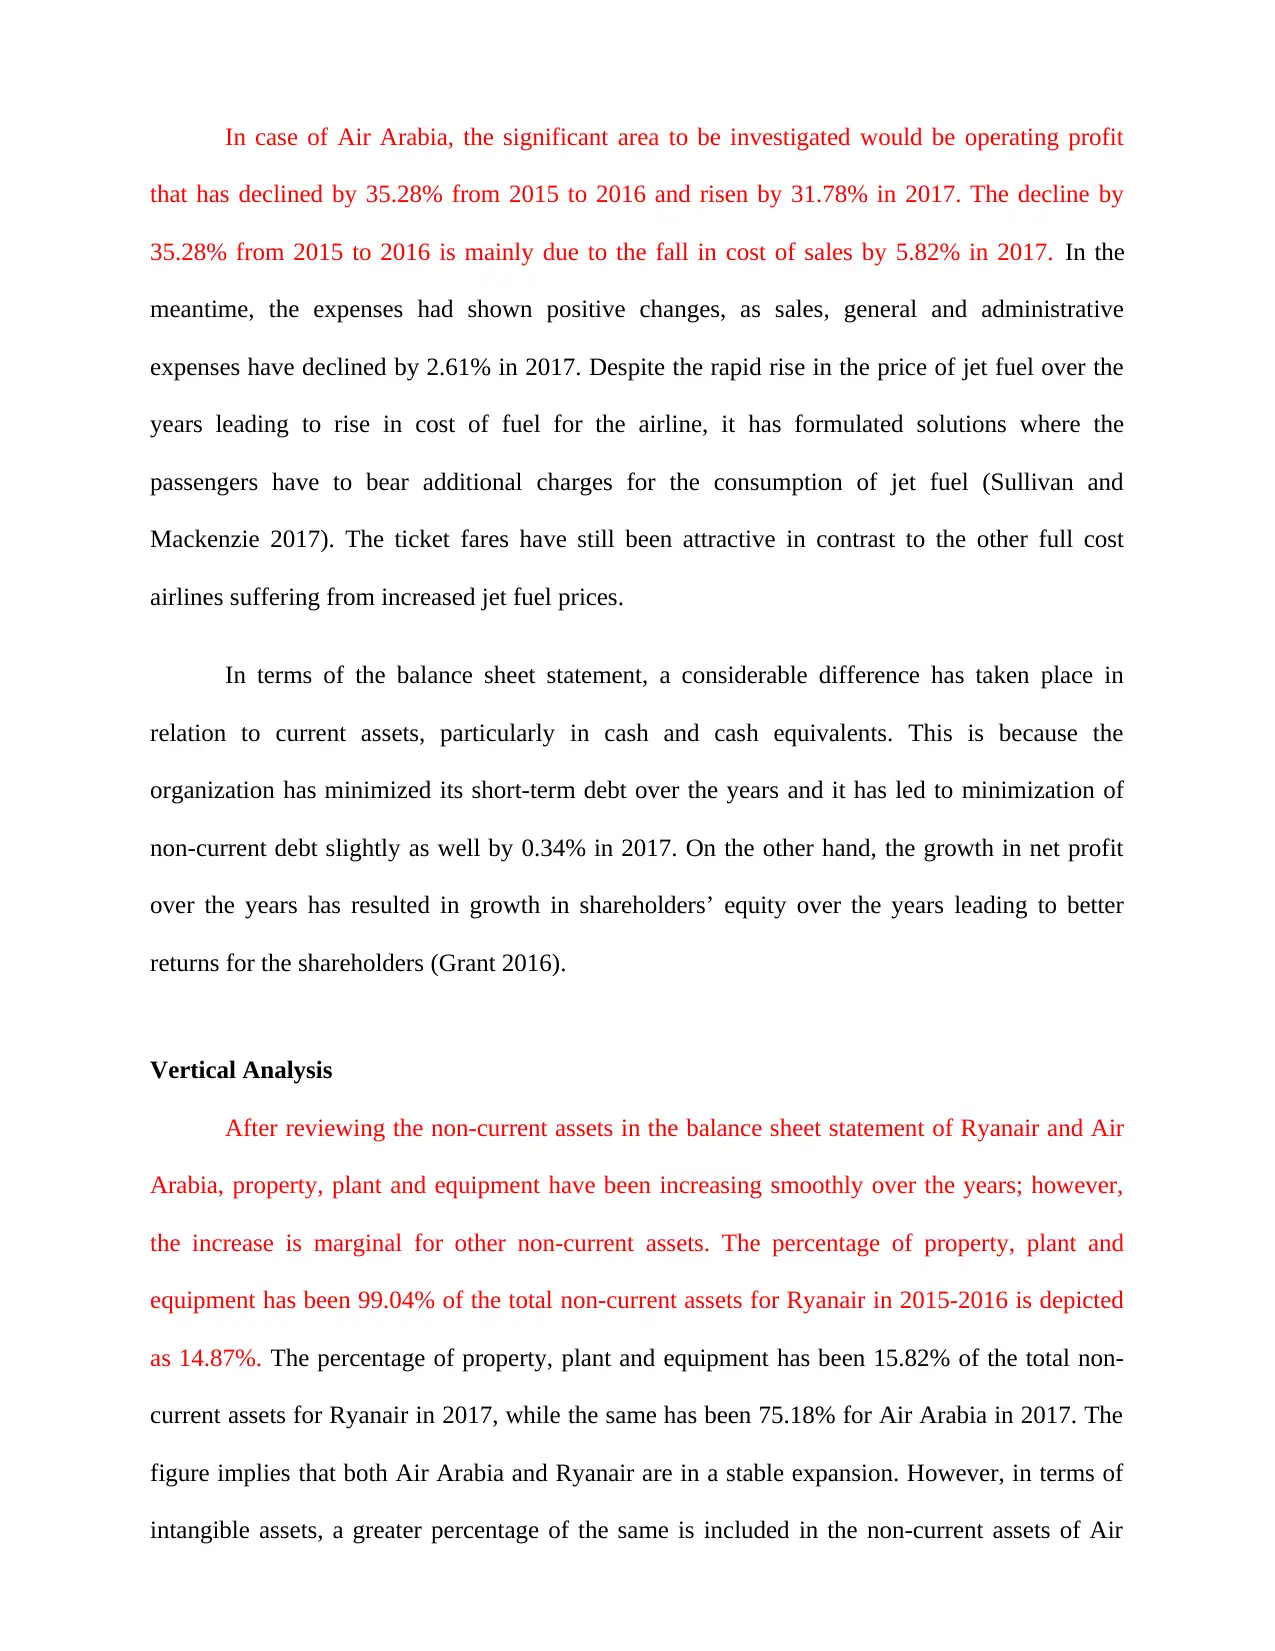
In case of Air Arabia, the significant area to be investigated would be operating profit
that has declined by 35.28% from 2015 to 2016 and risen by 31.78% in 2017. The decline by
35.28% from 2015 to 2016 is mainly due to the fall in cost of sales by 5.82% in 2017. In the
meantime, the expenses had shown positive changes, as sales, general and administrative
expenses have declined by 2.61% in 2017. Despite the rapid rise in the price of jet fuel over the
years leading to rise in cost of fuel for the airline, it has formulated solutions where the
passengers have to bear additional charges for the consumption of jet fuel (Sullivan and
Mackenzie 2017). The ticket fares have still been attractive in contrast to the other full cost
airlines suffering from increased jet fuel prices.
In terms of the balance sheet statement, a considerable difference has taken place in
relation to current assets, particularly in cash and cash equivalents. This is because the
organization has minimized its short-term debt over the years and it has led to minimization of
non-current debt slightly as well by 0.34% in 2017. On the other hand, the growth in net profit
over the years has resulted in growth in shareholders’ equity over the years leading to better
returns for the shareholders (Grant 2016).
Vertical Analysis
After reviewing the non-current assets in the balance sheet statement of Ryanair and Air
Arabia, property, plant and equipment have been increasing smoothly over the years; however,
the increase is marginal for other non-current assets. The percentage of property, plant and
equipment has been 99.04% of the total non-current assets for Ryanair in 2015-2016 is depicted
as 14.87%. The percentage of property, plant and equipment has been 15.82% of the total non-
current assets for Ryanair in 2017, while the same has been 75.18% for Air Arabia in 2017. The
figure implies that both Air Arabia and Ryanair are in a stable expansion. However, in terms of
intangible assets, a greater percentage of the same is included in the non-current assets of Air
Paraphrase This Document
Need a fresh take? Get an instant paraphrase of this document with our AI Paraphraser
Arabia compared to Ryanair. Thus, it could be said that majority of the assets and liabilities are
in the form of slots and aircrafts.
In terms of current assets, steady increase could be observed over the years for both the
airlines, particularly with the rise in cash and cash equivalents. This is mainly due to the fact that
these two airlines have minimized their short-term bank borrowings over the years. The situation
is identical in case of non-current liabilities as well, in which the maximum elements are
increasing over the years after which a slow recovery took place. There have been reductions in
short-term and long-term borrowings for both the airlines in 2017 and decline in bank loans has
minimized the interest expenses for interest bearing loans by 15.49% for Ryanair. On the other
hand, Air Arabia has incurred increased interest expenses making up 3.18% of sales revenue.
Therefore, after considering all these aspects, Ryanair is observed to be in a competitive position
in the global aviation industry. This is due to the fact that it has wider reach to the market and it
has carried increased number of passengers over the years due to which it has managed to
maintain favorable financial standing in the operating market.
Evaluation of Business Performance of Air Arabia
Structuring of the Airline
Identification of business success measured in the airline industry
The measurement of the key success factors in the airline industry is depicted to ranging
with several number of factors. For instance, the measurement of success pertaining to attracting
the customers ranges from attractiveness of the airline’s service and effectiveness of the airline’s
promotional expenditures. The measure of success based on the effectiveness of the attracting the
customers is often defined with derivation of the promotional effectiveness. This measure is seen
with the sales per dollar pertaining to the promotional expense. Except where otherwise noted,
the analysis of the data pertaining to the Department of Transportation databases in UAE
(Mohamad et al. 2017).
The second crucial factor is considered with managing people. This factor relates to
managing productivity in the airline. The measure for this is seen with capacity per employee
and this is often regarded as how effectively the employees work together for providing the
physical services in transporting the passengers from one place to another. The morale for this
is seen to be considered with how the committed employees are able to provide effective
physical service in getting the passengers from one place to another. More importantly morale is
considered as the measure of how committed employees are able to provide good service to the
customers involved in the aviation industry (Ellis et al. 2018).
Managing Finance is another determinant of the success factor among the airline
industry. More importantly unit revenue and unit cost are important by themselves and the
relationship among them should be also considered effectively by the company. The unit
revenues and unit costs are particularly seen to be effective for the long-term profit of the
company (Sweis et al. 2019).
Focus most applicable to the airline
Air Arabia is seen as a one of the budget airliners headquartered in the A1 Building
Sharjah Freight Center, Sharjah International Airport, in United Arab Emirates. The scheduled
service of the airline is seen to operate in more than 151 destinations. However, some of the
main areas of problem with the airliner is considered with comparatively lower performance
pertaining to the areas of maintaining a steady cash ratio. This is particularly evident with the
Cash & Cash equivalents as per the current liabilities. The focus pertaining to this aspect needs
to be seen with an augmented emphasis on the short-term cash available for maintaining a steady
cash ratio. The airliner needs to ensure steady cash by following up with the account’s
⊘ This is a preview!⊘
Do you want full access?
Subscribe today to unlock all pages.
Trusted by 1+ million students worldwide
1 out of 41
Related Documents


Your All-in-One AI-Powered Toolkit for Academic Success.
+13062052269
info@desklib.com
Available 24*7 on WhatsApp / Email
![[object Object]](/_next/static/media/star-bottom.7253800d.svg)
Unlock your academic potential
Copyright © 2020–2026 A2Z Services. All Rights Reserved. Developed and managed by ZUCOL.