Co-op Food: Financial Ratio Analysis and Performance Review

Verified

Added on  2020/10/05

|4
|447
|254
Report
AI Summary
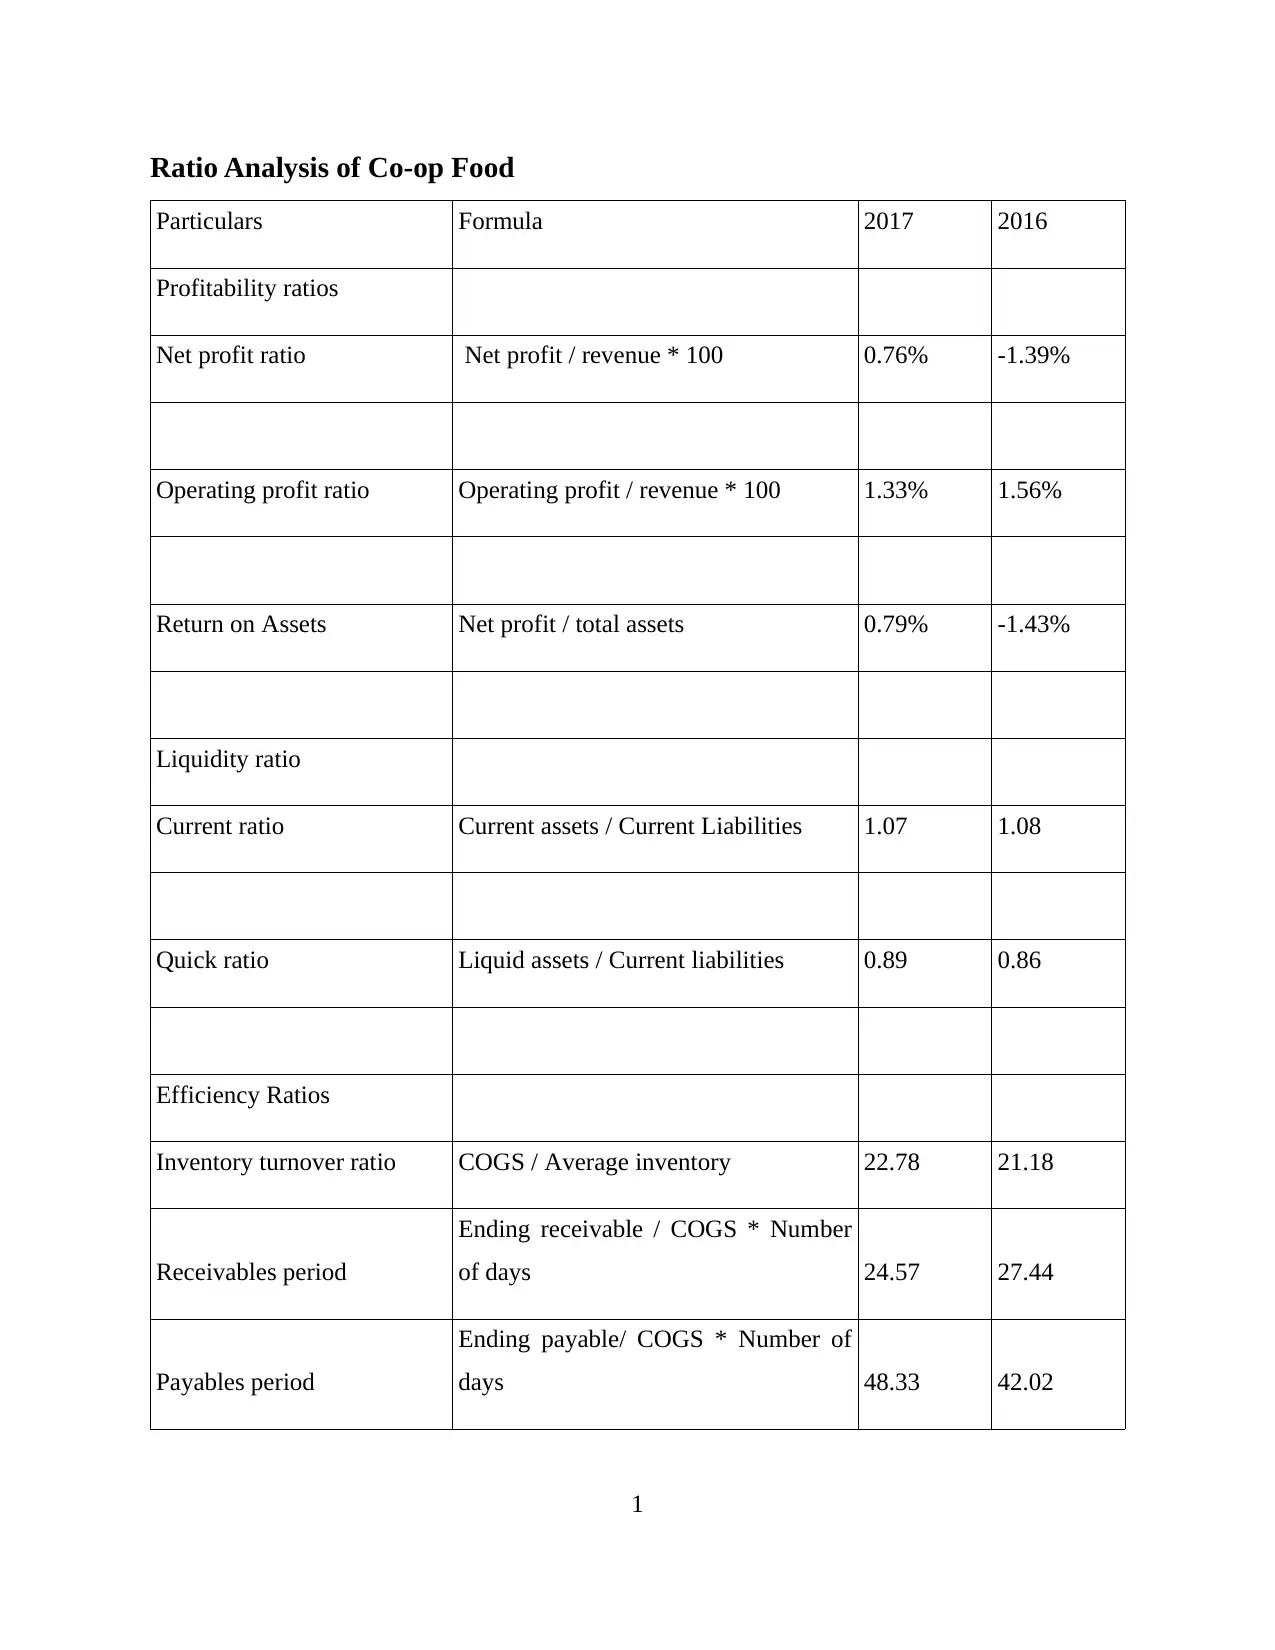
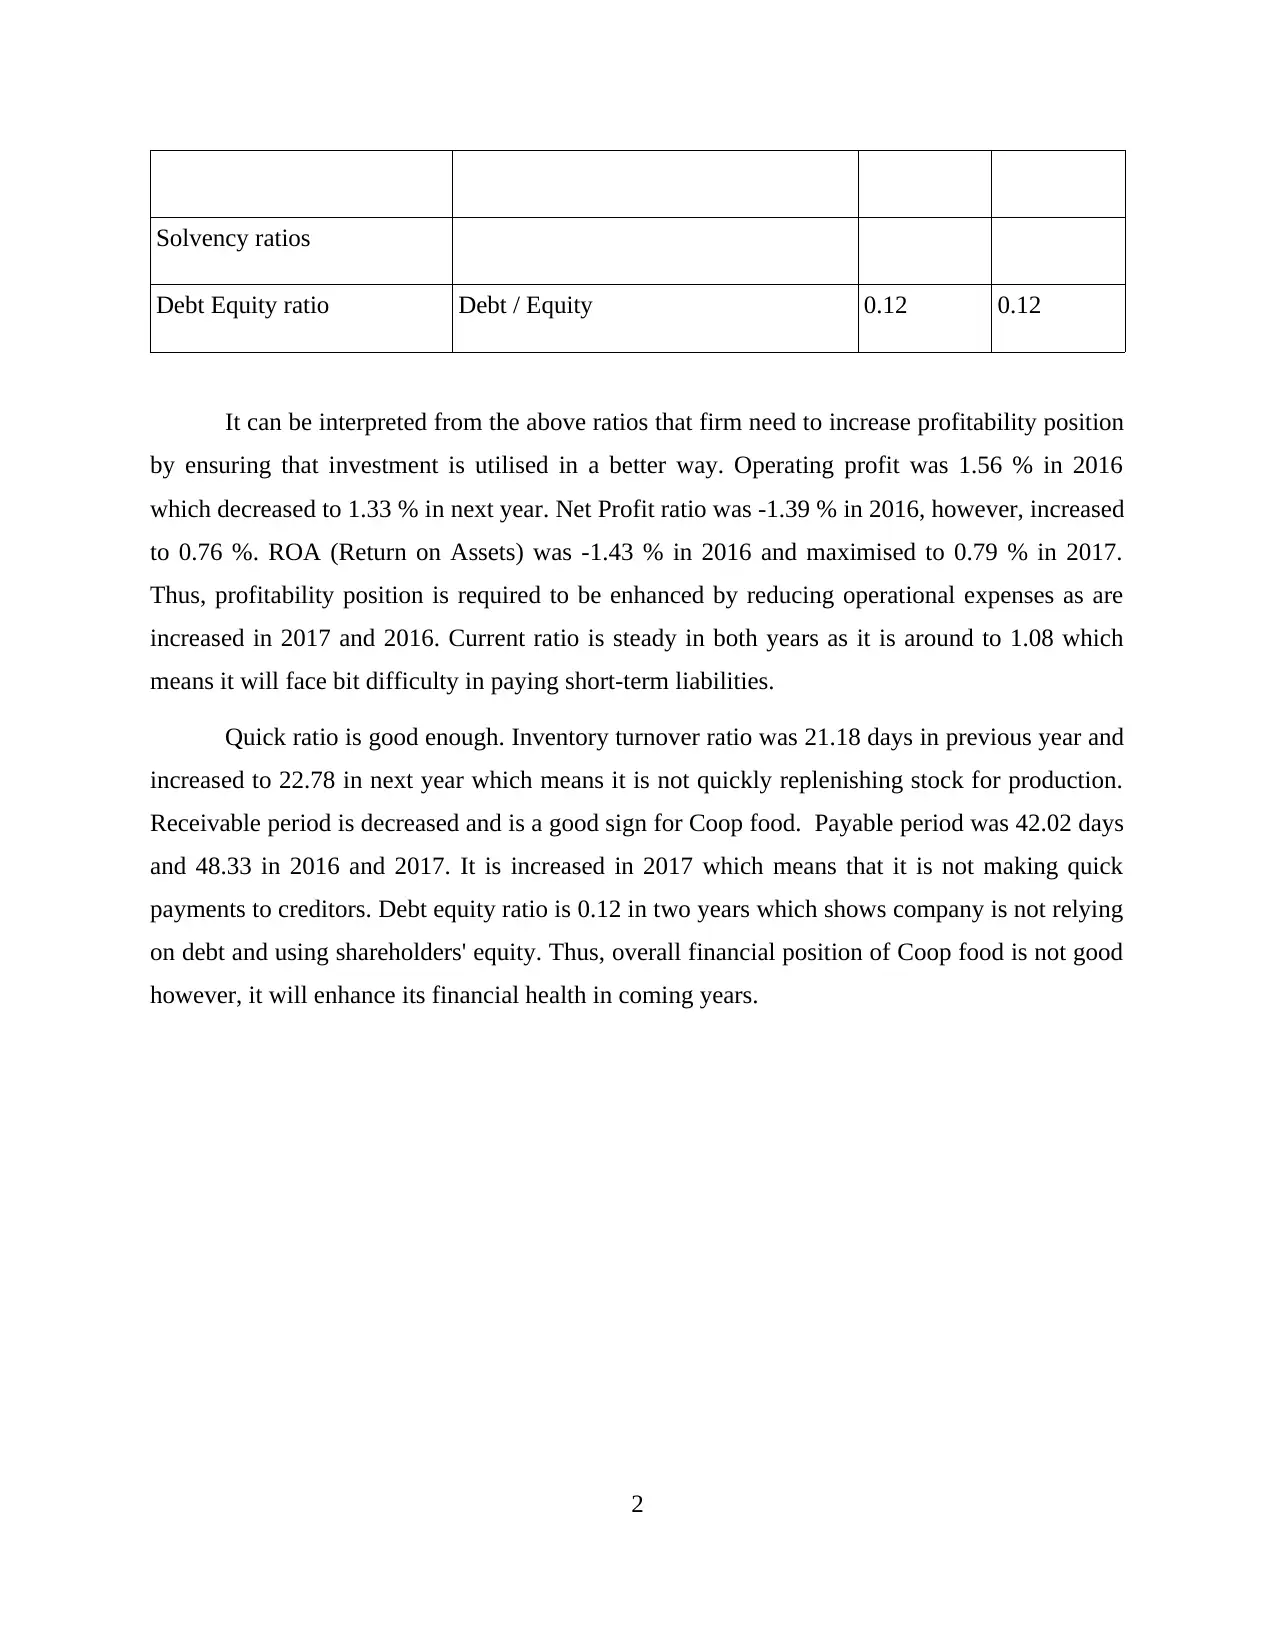
This report presents a financial analysis of Co-op Food, focusing on the years 2016 and 2017. The analysis utilizes various financial ratios to assess the company's performance. Key areas of examination include profitability, as evidenced by the net profit ratio, operating profit ratio, and return on assets, showing improvements in 2017 after a loss in 2016. Liquidity is evaluated through the current and quick ratios, indicating the company's ability to meet short-term obligations. Efficiency is assessed using inventory turnover, receivables period, and payables period, highlighting changes in stock management and payment practices. Finally, solvency is examined using the debt-equity ratio, demonstrating the company's reliance on debt. The report concludes with an overview of Co-op Food's financial health and its potential for future improvement.
Document Page
Mergers & Acquisitions
tabler-icon-diamond-filled.svg

Paraphrase This Document

Need a fresh take? Get an instant paraphrase of this document with our AI Paraphraser
Document Page
TABLE OF CONTENTS
Ratio Analysis of Co-op Food ........................................................................................................1
Document Page
Ratio Analysis of Co-op Food
Particulars Formula 2017 2016
Profitability ratios
Net profit ratio Net profit / revenue * 100 0.76% -1.39%
Operating profit ratio Operating profit / revenue * 100 1.33% 1.56%
Return on Assets Net profit / total assets 0.79% -1.43%
Liquidity ratio
Current ratio Current assets / Current Liabilities 1.07 1.08
Quick ratio Liquid assets / Current liabilities 0.89 0.86
Efficiency Ratios
Inventory turnover ratio COGS / Average inventory 22.78 21.18
Receivables period
Ending receivable / COGS * Number
of days 24.57 27.44
Payables period
Ending payable/ COGS * Number of
days 48.33 42.02
1
Document Page
Solvency ratios
Debt Equity ratio Debt / Equity 0.12 0.12
It can be interpreted from the above ratios that firm need to increase profitability position
by ensuring that investment is utilised in a better way. Operating profit was 1.56 % in 2016
which decreased to 1.33 % in next year. Net Profit ratio was -1.39 % in 2016, however, increased
to 0.76 %. ROA (Return on Assets) was -1.43 % in 2016 and maximised to 0.79 % in 2017.
Thus, profitability position is required to be enhanced by reducing operational expenses as are
increased in 2017 and 2016. Current ratio is steady in both years as it is around to 1.08 which
means it will face bit difficulty in paying short-term liabilities.
Quick ratio is good enough. Inventory turnover ratio was 21.18 days in previous year and
increased to 22.78 in next year which means it is not quickly replenishing stock for production.
Receivable period is decreased and is a good sign for Coop food. Payable period was 42.02 days
and 48.33 in 2016 and 2017. It is increased in 2017 which means that it is not making quick
payments to creditors. Debt equity ratio is 0.12 in two years which shows company is not relying
on debt and using shareholders' equity. Thus, overall financial position of Coop food is not good
however, it will enhance its financial health in coming years.
2
chevron_up_icon
1 out of 4
circle_padding
hide_on_mobile
zoom_out_icon
[object Object]