Detailed Financial Analysis of Crystal Hotel: Management Accounting
VerifiedAdded on  2023/06/10
|11
|2203
|257
Report
AI Summary
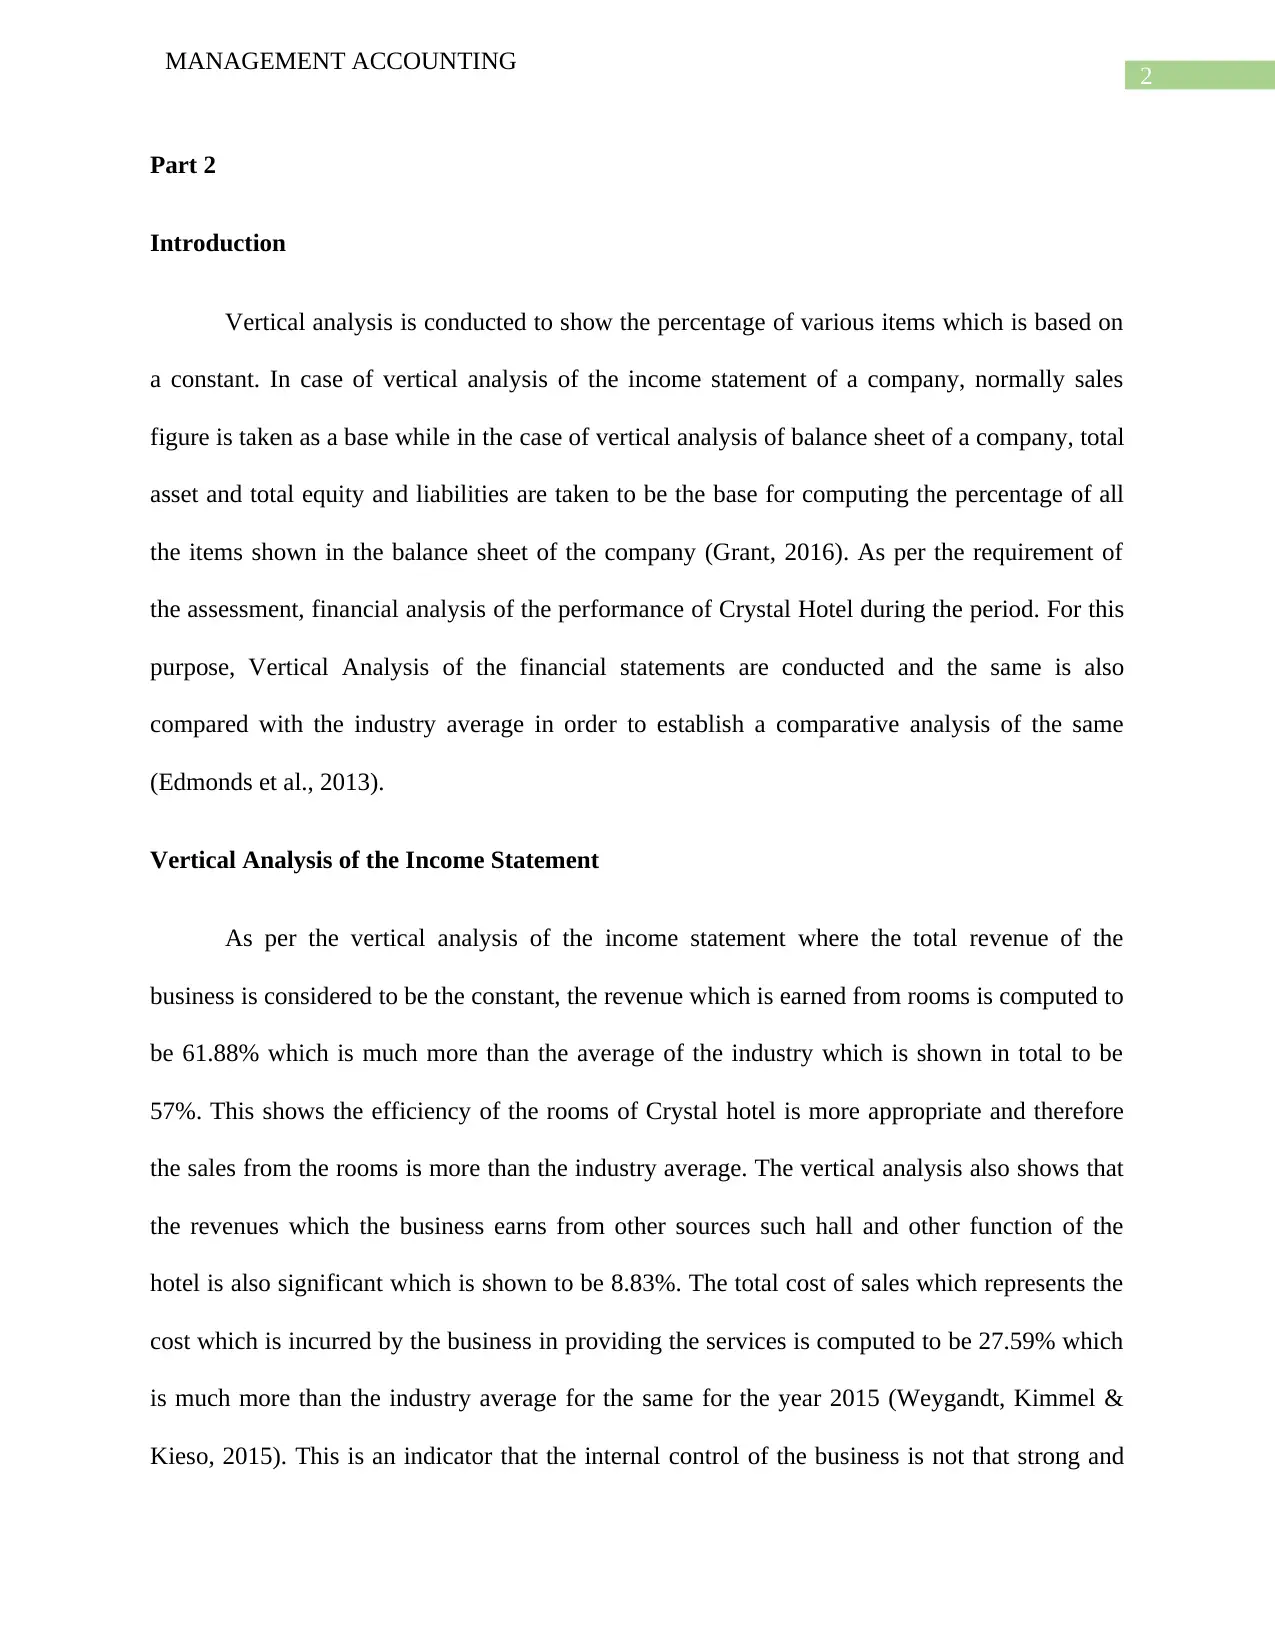
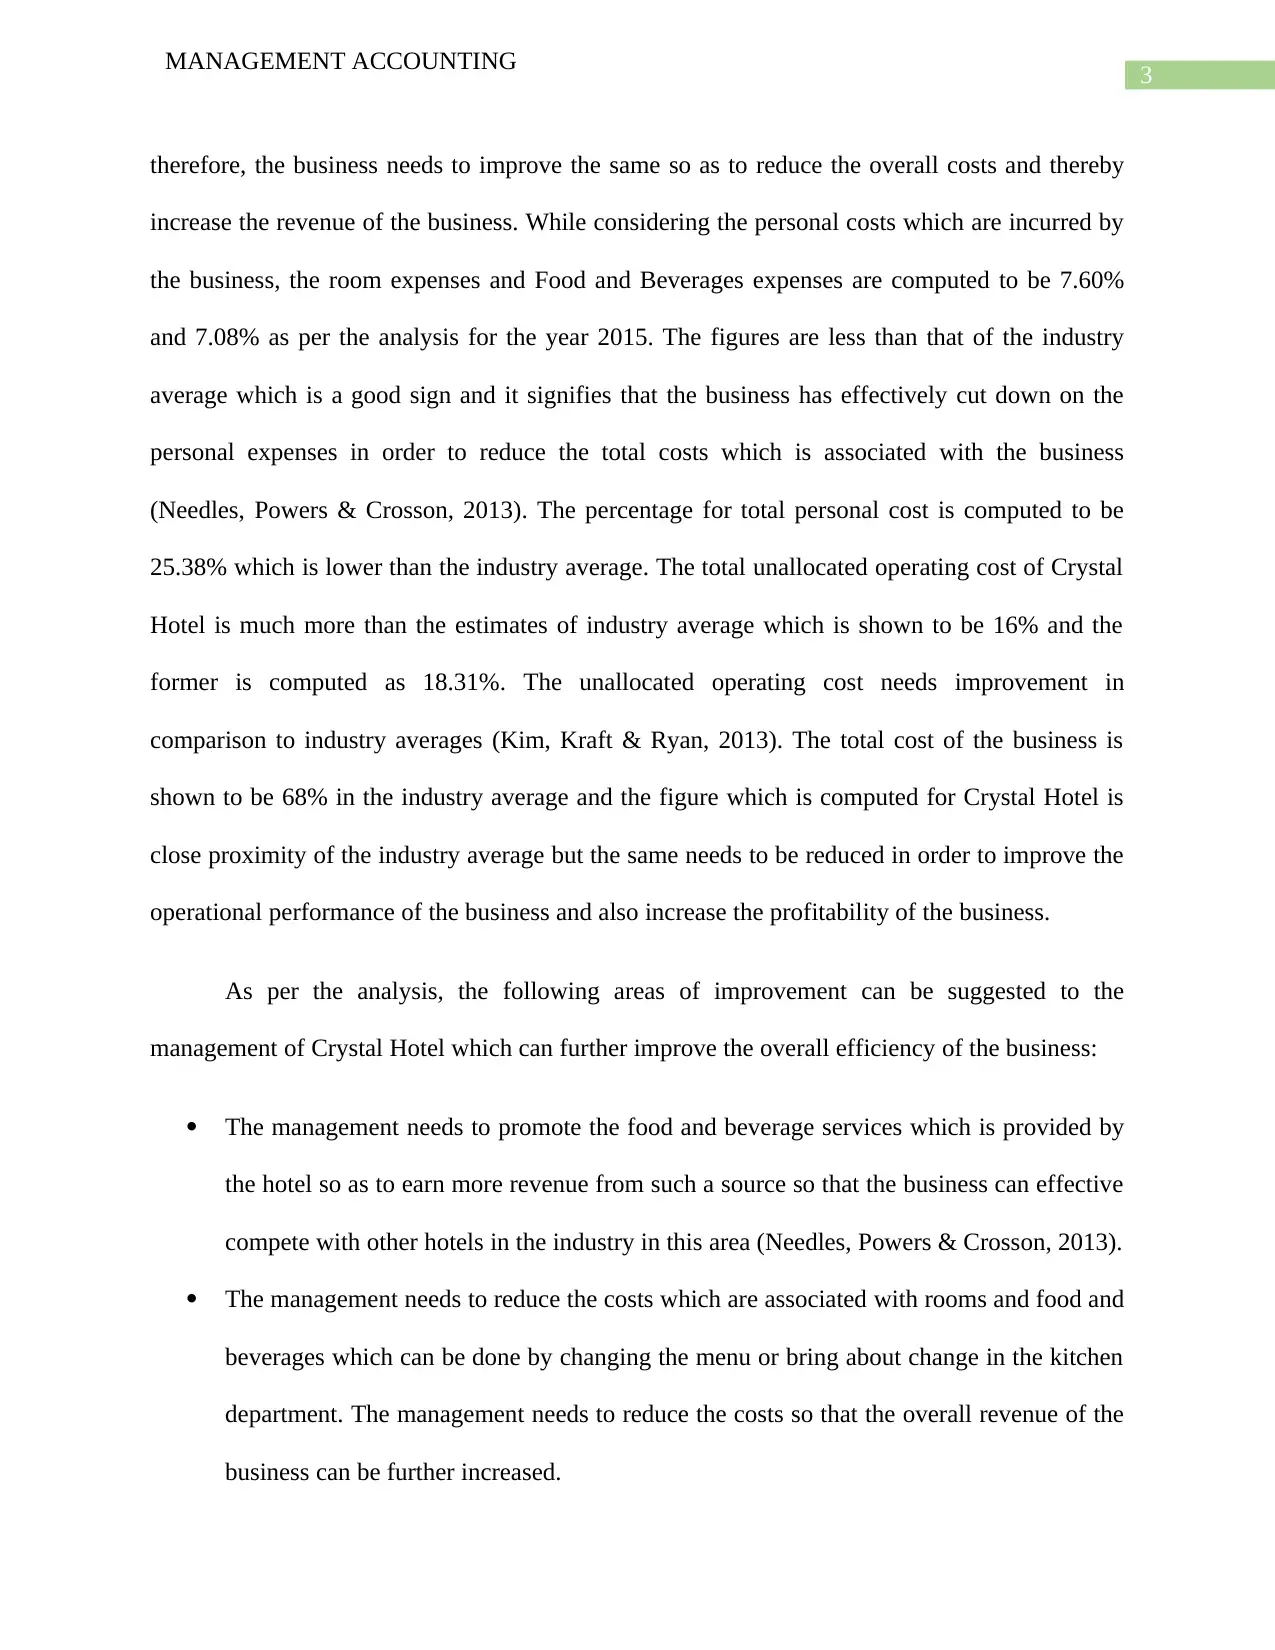
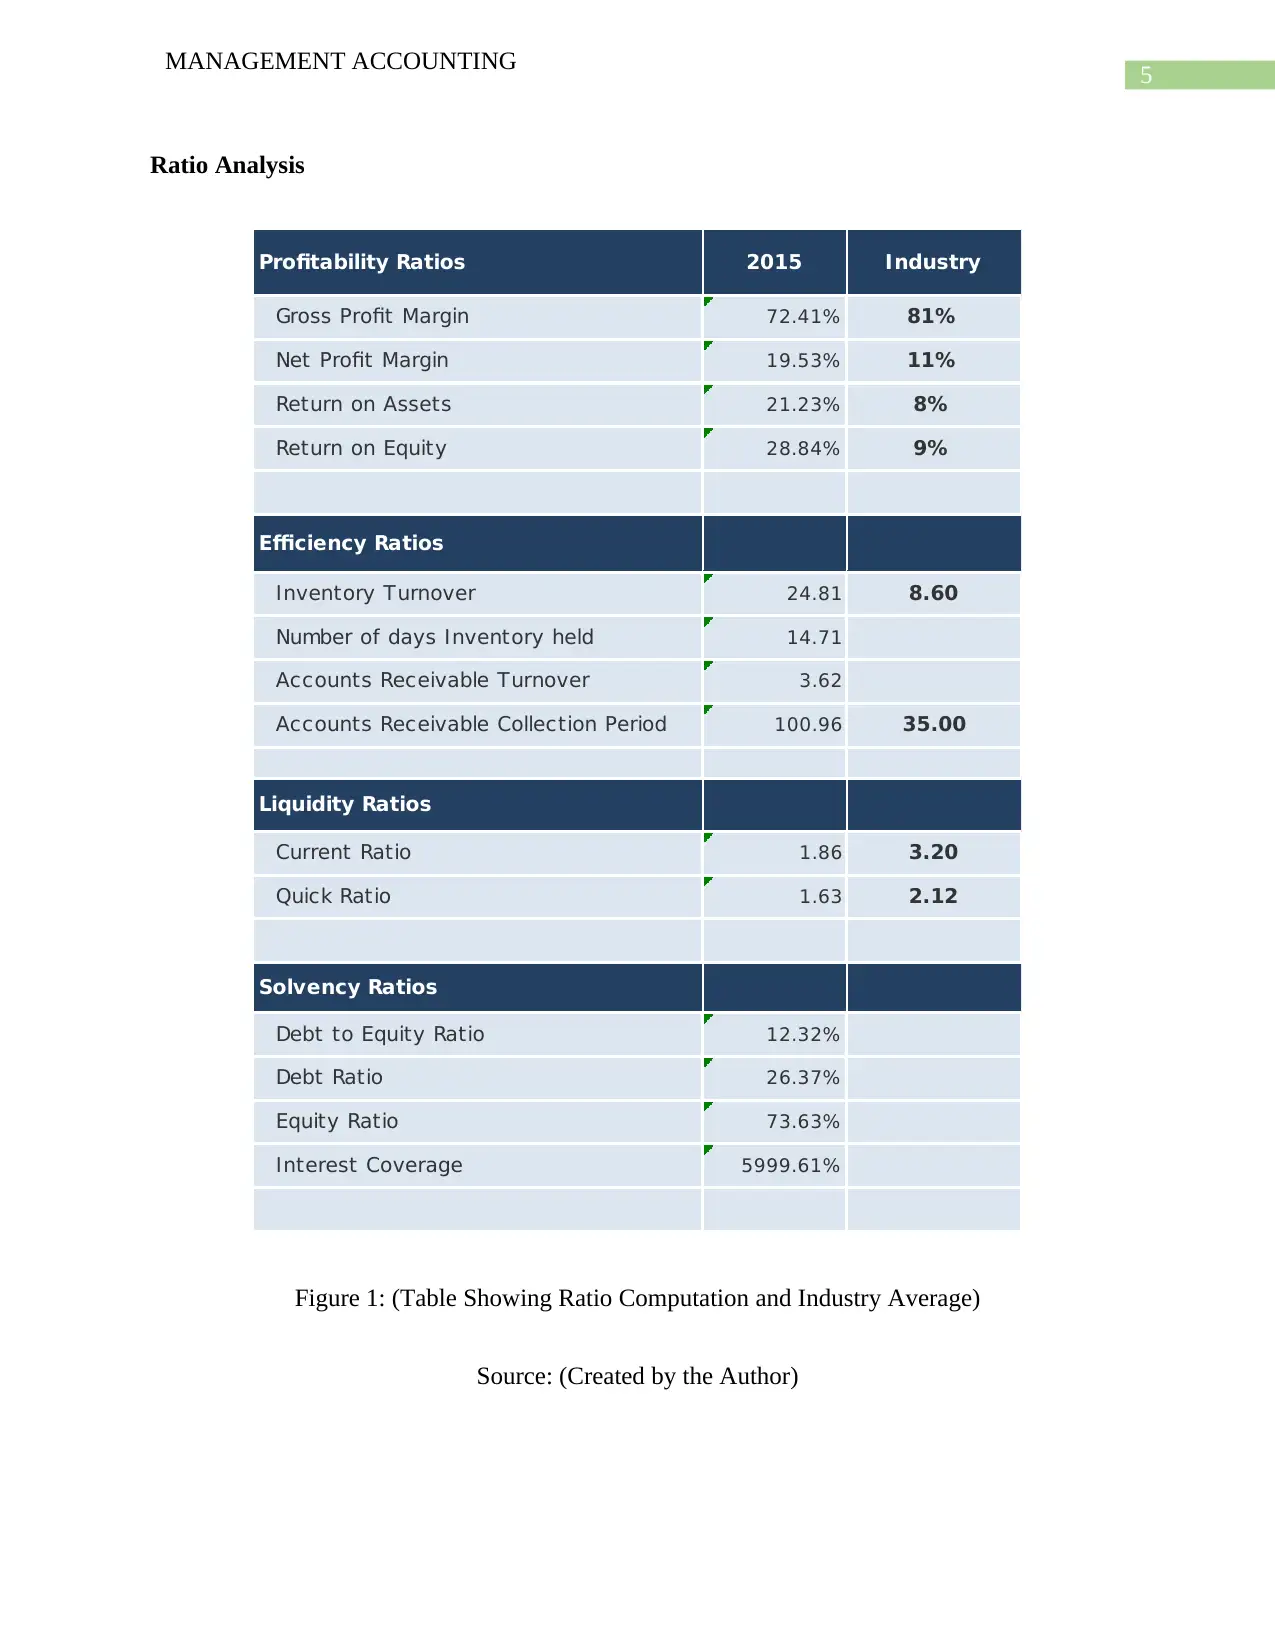
This report presents a detailed financial analysis of Crystal Hotel, employing vertical analysis of the income statement and ratio analysis to assess the hotel's performance against industry benchmarks. The vertical analysis reveals that Crystal Hotel excels in room revenue but lags in cost of sales, indicating a need for improved internal controls. Ratio analysis highlights strong profitability metrics, including net profit margin, return on assets, and return on equity, significantly exceeding industry averages. However, liquidity ratios suggest room for improvement, and the credit policy appears lenient. The report recommends strategies to enhance food and beverage services, reduce costs, and optimize capital structure. Additional industry-specific benchmarks, such as market valuation, star ratings, and customer satisfaction, are suggested for comprehensive performance evaluation. Desklib offers a wealth of similar solved assignments and past papers for students seeking to deepen their understanding of financial analysis and management accounting.
Contribute Materials
Your contribution can guide someone’s learning journey. Share your
documents today.

Running head: MANAGEMENT ACCOUNTING
Management Accounting
Name of the Student:
Name of the University:
Author’s Note
Management Accounting
Name of the Student:
Name of the University:
Author’s Note
Secure Best Marks with AI Grader
Need help grading? Try our AI Grader for instant feedback on your assignments.

1
MANAGEMENT ACCOUNTING
Table of Contents
Part 2................................................................................................................................................2
Introduction..................................................................................................................................2
Vertical Analysis of the Income Statement.................................................................................2
Ratio Analysis..............................................................................................................................5
Additional Industry Specific Benchmarks for Hotels..................................................................7
Reference.........................................................................................................................................9

2
MANAGEMENT ACCOUNTING
Part 2
Introduction
Vertical analysis is conducted to show the percentage of various items which is based on
a constant. In case of vertical analysis of the income statement of a company, normally sales
figure is taken as a base while in the case of vertical analysis of balance sheet of a company, total
asset and total equity and liabilities are taken to be the base for computing the percentage of all
the items shown in the balance sheet of the company (Grant, 2016). As per the requirement of
the assessment, financial analysis of the performance of Crystal Hotel during the period. For this
purpose, Vertical Analysis of the financial statements are conducted and the same is also
compared with the industry average in order to establish a comparative analysis of the same
(Edmonds et al., 2013).
Vertical Analysis of the Income Statement
As per the vertical analysis of the income statement where the total revenue of the
business is considered to be the constant, the revenue which is earned from rooms is computed to
be 61.88% which is much more than the average of the industry which is shown in total to be
57%. This shows the efficiency of the rooms of Crystal hotel is more appropriate and therefore
the sales from the rooms is more than the industry average. The vertical analysis also shows that
the revenues which the business earns from other sources such hall and other function of the
hotel is also significant which is shown to be 8.83%. The total cost of sales which represents the
cost which is incurred by the business in providing the services is computed to be 27.59% which
is much more than the industry average for the same for the year 2015 (Weygandt, Kimmel &
Kieso, 2015). This is an indicator that the internal control of the business is not that strong and

3
MANAGEMENT ACCOUNTING
therefore, the business needs to improve the same so as to reduce the overall costs and thereby
increase the revenue of the business. While considering the personal costs which are incurred by
the business, the room expenses and Food and Beverages expenses are computed to be 7.60%
and 7.08% as per the analysis for the year 2015. The figures are less than that of the industry
average which is a good sign and it signifies that the business has effectively cut down on the
personal expenses in order to reduce the total costs which is associated with the business
(Needles, Powers & Crosson, 2013). The percentage for total personal cost is computed to be
25.38% which is lower than the industry average. The total unallocated operating cost of Crystal
Hotel is much more than the estimates of industry average which is shown to be 16% and the
former is computed as 18.31%. The unallocated operating cost needs improvement in
comparison to industry averages (Kim, Kraft & Ryan, 2013). The total cost of the business is
shown to be 68% in the industry average and the figure which is computed for Crystal Hotel is
close proximity of the industry average but the same needs to be reduced in order to improve the
operational performance of the business and also increase the profitability of the business.
As per the analysis, the following areas of improvement can be suggested to the
management of Crystal Hotel which can further improve the overall efficiency of the business:
ï‚· The management needs to promote the food and beverage services which is provided by
the hotel so as to earn more revenue from such a source so that the business can effective
compete with other hotels in the industry in this area (Needles, Powers & Crosson, 2013).
ï‚· The management needs to reduce the costs which are associated with rooms and food and
beverages which can be done by changing the menu or bring about change in the kitchen
department. The management needs to reduce the costs so that the overall revenue of the
business can be further increased.
Secure Best Marks with AI Grader
Need help grading? Try our AI Grader for instant feedback on your assignments.

4
MANAGEMENT ACCOUNTING
ï‚· The unallocated costs and the personal costs which relates to social security also needs to
improve as this are adding to the total costs of the business and if improvement in such an
area can be achieved not only the efficiency of the area will increase but also the overall
costs will reduce. It is also recommended that the unallocated operating costs items need
to be evaluated in order to ascertain whether such costs are necessary in nature or not.

5
MANAGEMENT ACCOUNTING
Ratio Analysis
Profitability Ratios 2015 Industry
Gross Profit Margin 72.41% 81%
Net Profit Margin 19.53% 11%
Return on Assets 21.23% 8%
Return on Equity 28.84% 9%
Efficiency Ratios
Inventory Turnover 24.81 8.60
Number of days Inventory held 14.71
Accounts Receivable Turnover 3.62
Accounts Receivable Collection Period 100.96 35.00
Liquidity Ratios
Current Ratio 1.86 3.20
Quick Ratio 1.63 2.12
Solvency Ratios
Debt to Equity Ratio 12.32%
Debt Ratio 26.37%
Equity Ratio 73.63%
Interest Coverage 5999.61%
Figure 1: (Table Showing Ratio Computation and Industry Average)
Source: (Created by the Author)

6
MANAGEMENT ACCOUNTING
As shown in figure 1, significant ratios are calculated for the purpose of establishing the
performance of the business and also comparing the same with the industry average. The gross
profit margin for Crystal Hotel is shown to be 72.41% which is lower than the industry average
which is shown to be 81% which shows that there are hotels which have a better operational
performance than Crystal Hotel which can be due to cost minimization policies and other factors.
The net profit of the company is shown to be 19.53% which is significantly more than the
industry average which shows that the business is fairly successful in the market (Carraher &
Van Auken, 2013). The return on assets and return on equity of the Hotel is significantly more
than the industry average which is a positive sign for the business and it also suggest that the
business is a developing one. Both Return on Assets and Return on Equity is considered to be
financial Indicators of success for the business and both of these estimates show positive sign for
the Crystal Hotel (Vuckovic, Veselinovic & Drobnjakovic, 2016). The efficiency ratio mainly
comprises of inventory turnover ratio and receivable turnover ratio which is shown in the above
figure. The inventory turnover ratio of the business is shown to be 24.81 which is significantly
more than the industry average which suggest that the business is effectively handling the
inventory of the business. This also implies that the business follows aggressive sales policy and
also offers large discounts in order to promote the overall sales of the Hotel. The debtor turnover
ratio is also an important indicator of the efficiency of the business in handling the credit sales of
the business and also reflects the credit policy of the business (Delen, Kuzey & Uyar, 2013). As
shown in the table the business allows long periods as credit policy while the industry average is
only 35 days. This signifies that either the business has trust on the customers and offers such
credit policies to regular and loyal customers or the credit policy of the business is inappropriate.
Paraphrase This Document
Need a fresh take? Get an instant paraphrase of this document with our AI Paraphraser

7
MANAGEMENT ACCOUNTING
The liquidity ratio of the business shows the ability of the company to meet the day to
day expenses of the business in order to smoothly run the operations of the business. The current
ratio of the Hotel is computed to be 1.86 and the acid test ratio is computed to be 1.63 which is
lower than the estimates of the industry average which is shown in table above. The ratios are
ideal which shows that the business has no liquidity problems but comparison shows that in the
industry businesses exist which have a better liquidity position than Crystal Hotel. Therefore, it
can be recommended that the management of Crystal Hotel needs to improve the liquidity
position further in order stay competitive in the industry.
The debt equity ratio is considered to be a financial indicator of the success of the
business and therefore the same are considered by the potential investors before making any
investment in the business. The debt equity ratio shows the capital structure of the business and
whether the same has balance or not. The debt equity ratio is computed to be 12.32% which
means that the business is more depended on equity sources of capital rather than debt capital of
the business. The suggestion which can be given to the business is to utilize more debt capital so
as to attain a perfect capital structure which can improve the potentials of the business further.
The equity ratio of the company is shown to be 73.63% which is natural due to the utilization of
more equity capital in the capital mix of the business.
Additional Industry Specific Benchmarks for Hotels
The additional industry specific benchmarks which can be used by Crystal Hotel for
measuring the performance of the business in comparison to other business operating in the
Industry:

8
MANAGEMENT ACCOUNTING
1. The market valuation of the business is an important indicator of the success of the
business and also provides an image of the reputation of the company in the market. On
the basis of the market valuation of the business, potential investor decides whether to
invest in the business or not (Maimbo & Melecky, 2014).
2. Then there is the star rating which the is also a sign of the efficiency and reputation of the
business in the market. In many situations, business with high star ratings are preferred
by customers even though the same are expensive. Star ratings signifies the quality of
services which is provided by the business.
3. Customer satisfaction and feedbacks are also indicator the business performance. In many
cases customer leaves review of the hotel in websites on the basis of which potential
customers select their perfect hotels. This can also be a basis on which business can be
benchmarked to ascertain the techniques used.

9
MANAGEMENT ACCOUNTING
Reference
Carraher, S., & Van Auken, H. (2013). The use of financial statements for decision making by
small firms. Journal of Small Business & Entrepreneurship, 26(3), 323-336.
Delen, D., Kuzey, C., & Uyar, A. (2013). Measuring firm performance using financial ratios: A
decision tree approach. Expert Systems with Applications, 40(10), 3970-3983.
Edmonds, T. P., McNair, F. M., Olds, P. R., & Milam, E. E. (2013). Fundamental financial
accounting concepts. New York, NY: McGraw-Hill Irwin.
Grant, R. M. (2016). Contemporary strategy analysis: Text and cases edition. John Wiley &
Sons.
Kim, S., Kraft, P., & Ryan, S. G. (2013). Financial statement comparability and credit
risk. Review of Accounting Studies, 18(3), 783-823.
Maimbo, S. M., & Melecky, M. (2014). Financial sector policy in practice: benchmarking
financial sector strategies around the world. The World Bank.
Needles, B. E., Powers, M., & Crosson, S. V. (2013). Financial and managerial accounting.
Cengage Learning.
Needles, B. E., Powers, M., & Crosson, S. V. (2013). Principles of accounting. Cengage
Learning.
Vuckovic, B., Veselinovic, B., & Drobnjakovic, M. (2016). Analysis of profitability of selected
agricultural enterprises in the autonomous province of Vojvodina, Republic of
Serbia. Aktual'ni Problemy Ekonomiky= Actual Problems in Economics, (176), 147.
Secure Best Marks with AI Grader
Need help grading? Try our AI Grader for instant feedback on your assignments.

10
MANAGEMENT ACCOUNTING
Weygandt, J. J., Kimmel, P. D., & Kieso, D. E. (2015). Financial & managerial accounting.
John Wiley & Sons.
MANAGEMENT ACCOUNTING
Weygandt, J. J., Kimmel, P. D., & Kieso, D. E. (2015). Financial & managerial accounting.
John Wiley & Sons.
1 out of 11
Related Documents

Your All-in-One AI-Powered Toolkit for Academic Success.
 +13062052269
info@desklib.com
Available 24*7 on WhatsApp / Email
Unlock your academic potential
© 2024  |  Zucol Services PVT LTD  |  All rights reserved.