Financial Analysis Management & Enterprise: Daimler vs Tesla
VerifiedAdded on 2021/01/02
|31
|7792
|433
Report
AI Summary
This report provides a comprehensive financial analysis of Daimler and Tesla, two major players in the automotive industry. It begins with an introduction to financial analysis and its importance in evaluating organizational performance. The core of the report involves a detailed ratio analysis, including liquidity, profitability, efficiency, and leverage ratios, calculated for both companies over a four-year period (2014-2017). The analysis includes a comparison of current and quick ratios to assess liquidity, gross profit margin, return on assets, return on equity, asset turnover, inventory turnover, and debt ratios. Additionally, the report incorporates horizontal and vertical analyses of Daimler's statement of profit and loss to identify trends. The conclusion summarizes the key findings, comparing the financial health and performance of Daimler and Tesla. Finally, it includes a list of references and supporting data in the appendix.

FINANCIAL ANALYSIS
MANAGEMENT & ENTERPRISE -
FAME
MANAGEMENT & ENTERPRISE -
FAME
Paraphrase This Document
Need a fresh take? Get an instant paraphrase of this document with our AI Paraphraser
Table of Contents
INTRODUCTION...........................................................................................................................1
Ratio Analysis ............................................................................................................................1
Horizontal analysis...........................................................................................................................6
Vertical analysis ..............................................................................................................................8
Cash position of both the organisation........................................................................................9
CONCLUSION................................................................................................................................9
REFERENCES..............................................................................................................................10
APPENDIX....................................................................................................................................11
INTRODUCTION
For every organisation the financial performance is evaluated through various fiscal
tools. Financial analysis is-one of the measure which is used by every firm to determine its exact
performance and position in terms of profitability, liquidity and other traits of business
execution. With this a comparison can be carries out with own past performances and also with
other competitors in the industry. In the present horizontal and vertical of financial position is
carries out for ratios of Daimler and Tesla. The fact related with cash position of both firms is
also determined.
Ratio Analysis
Liquidity Ratio:
Daimler
Particulars Formula 2014 2015 2016 2017 2014 2015 2016 2017
Current
Ratio
Current Assets /
Current Liability 1.15 1.19 1.21 1.23 1.52 0.99 1.07 0.86
Quick
ratio
(Current asset-
Inventory-
prepaid
expenses)/Current
Liability
0.84 0.88 0.90 0.92 1.02 0.49 0.69 0.53
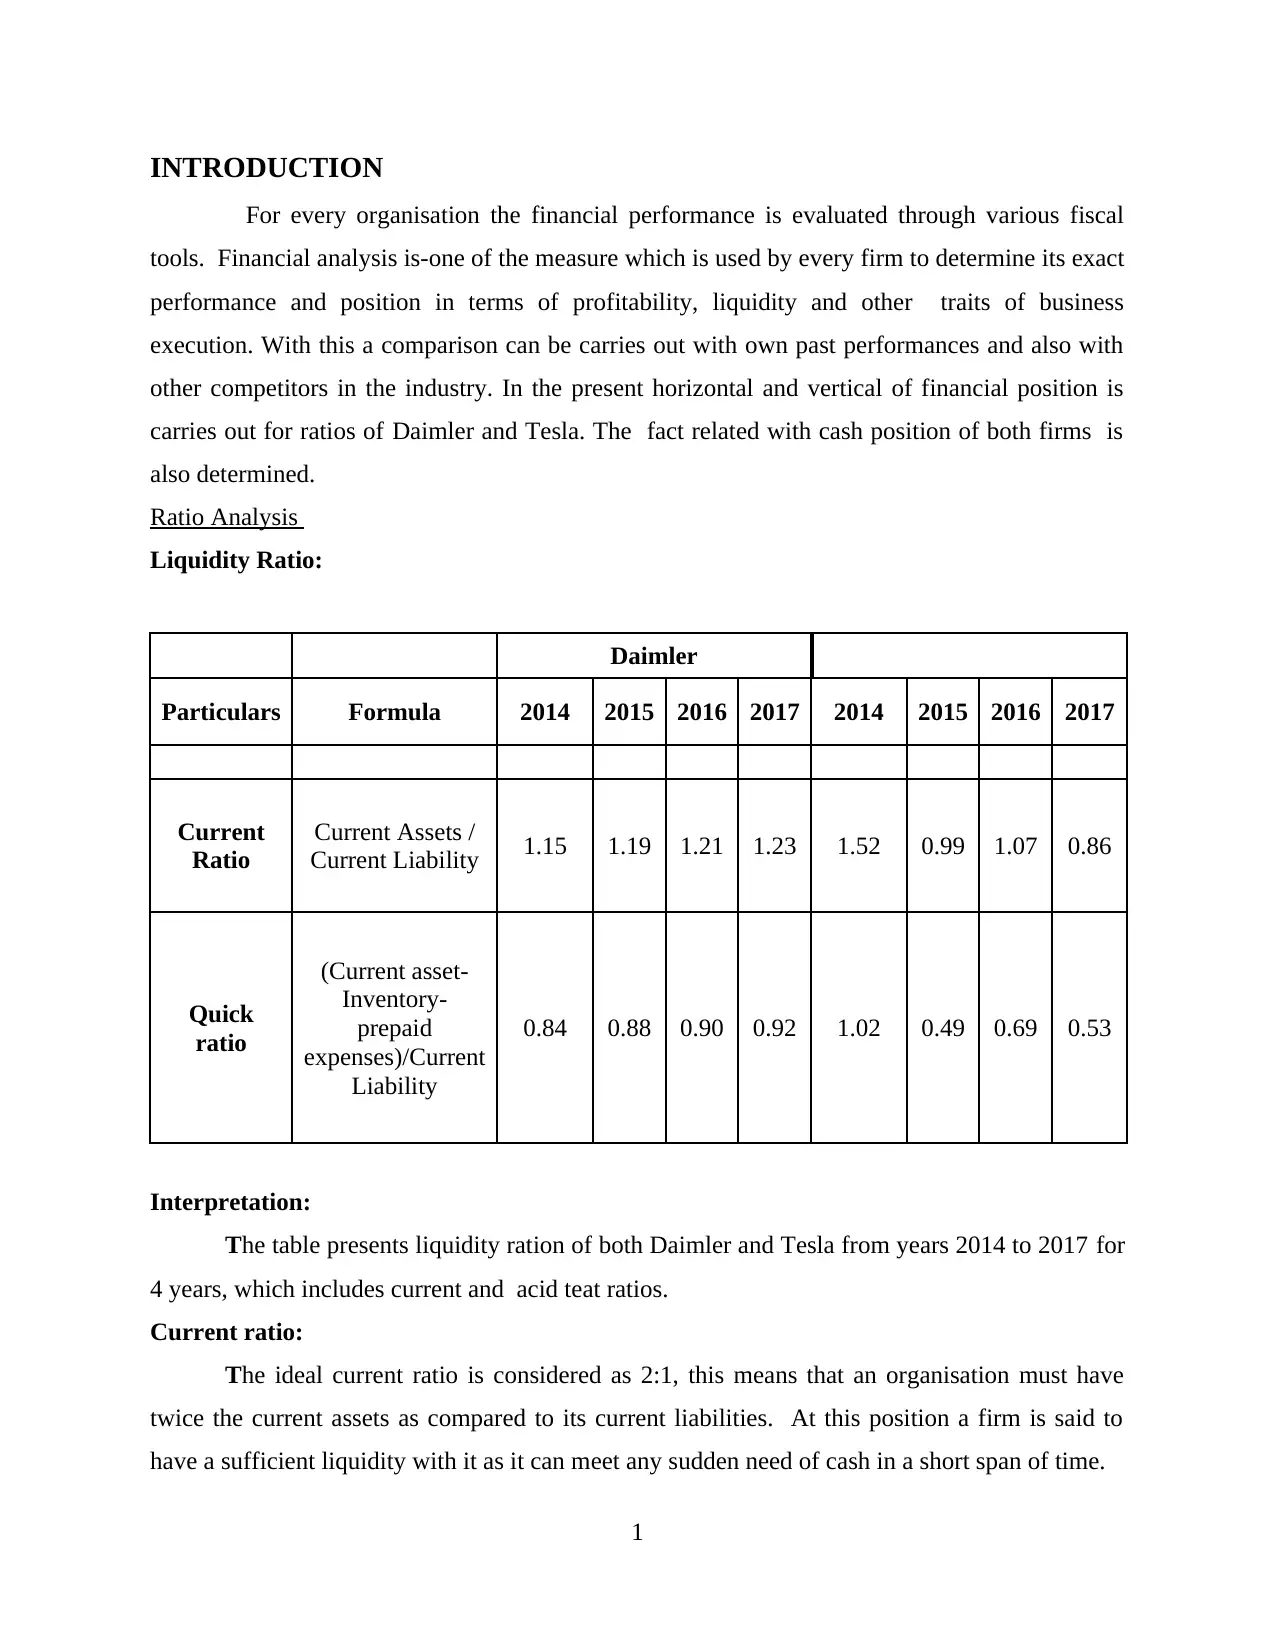
Interpretation:
The table presents liquidity ration of both Daimler and Tesla from years 2014 to 2017 for
4 years, which includes current and acid teat ratios.
Current ratio:
The ideal current ratio is considered as 2:1, this means that an organisation must have
twice the current assets as compared to its current liabilities. At this position a firm is said to
have a sufficient liquidity with it as it can meet any sudden need of cash in a short span of time.
1
For every organisation the financial performance is evaluated through various fiscal
tools. Financial analysis is-one of the measure which is used by every firm to determine its exact
performance and position in terms of profitability, liquidity and other traits of business
execution. With this a comparison can be carries out with own past performances and also with
other competitors in the industry. In the present horizontal and vertical of financial position is
carries out for ratios of Daimler and Tesla. The fact related with cash position of both firms is
also determined.
Ratio Analysis
Liquidity Ratio:
Daimler
Particulars Formula 2014 2015 2016 2017 2014 2015 2016 2017
Current
Ratio
Current Assets /
Current Liability 1.15 1.19 1.21 1.23 1.52 0.99 1.07 0.86
Quick
ratio
(Current asset-
Inventory-
prepaid
expenses)/Current
Liability
0.84 0.88 0.90 0.92 1.02 0.49 0.69 0.53
Interpretation:
The table presents liquidity ration of both Daimler and Tesla from years 2014 to 2017 for
4 years, which includes current and acid teat ratios.
Current ratio:
The ideal current ratio is considered as 2:1, this means that an organisation must have
twice the current assets as compared to its current liabilities. At this position a firm is said to
have a sufficient liquidity with it as it can meet any sudden need of cash in a short span of time.
1
⊘ This is a preview!⊘
Do you want full access?
Subscribe today to unlock all pages.
Trusted by 1+ million students worldwide
For Daimler it can be seen that the ratio have seen a downfall from 2014 to 2017. Yet is
can reach the idea ratio in time frame of 4 years. But the fact is that has been in a good liquidity
position as it has more current assets than this current liability that shows that after repaying its
all current liabilities it will still be left with some amount of cash. On the other hand Tesla is not
in a good liquidity position as it can be seen from the table that the current ration is below 1 for 2
years for 2015 and 2017 and this is not a good indicator of the firm. The organization do not
have sufficient funds to meet all its current abilities.
Quick ratio:
The ideal acid test ration is considered as 1:1, this means a firm must have cash and cash
equivalents to meet its immediate current liabilities. For Daimler it can be interpreted that it
does not have sufficient funds to meet its immediate current liabilities. On the contrary Tesla
had a good position in 2017 but in after year the ration falls down by 5% in next two years it
has gained a growth but is still not near the ideal ratio.
With a comparison it can be stated that for both the ratios Daimler is at front foot as its have
better liquidity position as compared to Tesla.
Profitability Ratio
Daimler
Particula
rs 2014 2015 2016 2017 2014 2015 2016 2017
Gross
profit
ratio
(GPR)
(GP /
Sales)*1
00 21.70
%
21.27
%
20.85
%
20.89
%
27.58
%
22.84
%
22.84
%
18.90
%
Return on
Asset
(ROA)
NP /
Total
Assets
3.70% 3.90% 3.50% 4.10% -
5.00%
-
11.00
%
-
3.00%
-
6.80%
Return on
capital
employed
(ROCE)
Net
operating
profit /
Capital
employe
d)
7.70% 9.00% 7.60% 7.70% -
5.00%
-
13.60
%
-
4.00%
-
7.80%
Return on Profit / 15.90 15.70 14.70 16.40 - - - -
1
Paraphrase This Document
Need a fresh take? Get an instant paraphrase of this document with our AI Paraphraser
Equity
(ROE)
Net
worth % % % % 32.20
%
81.60
%
14.20
%
46.30
%
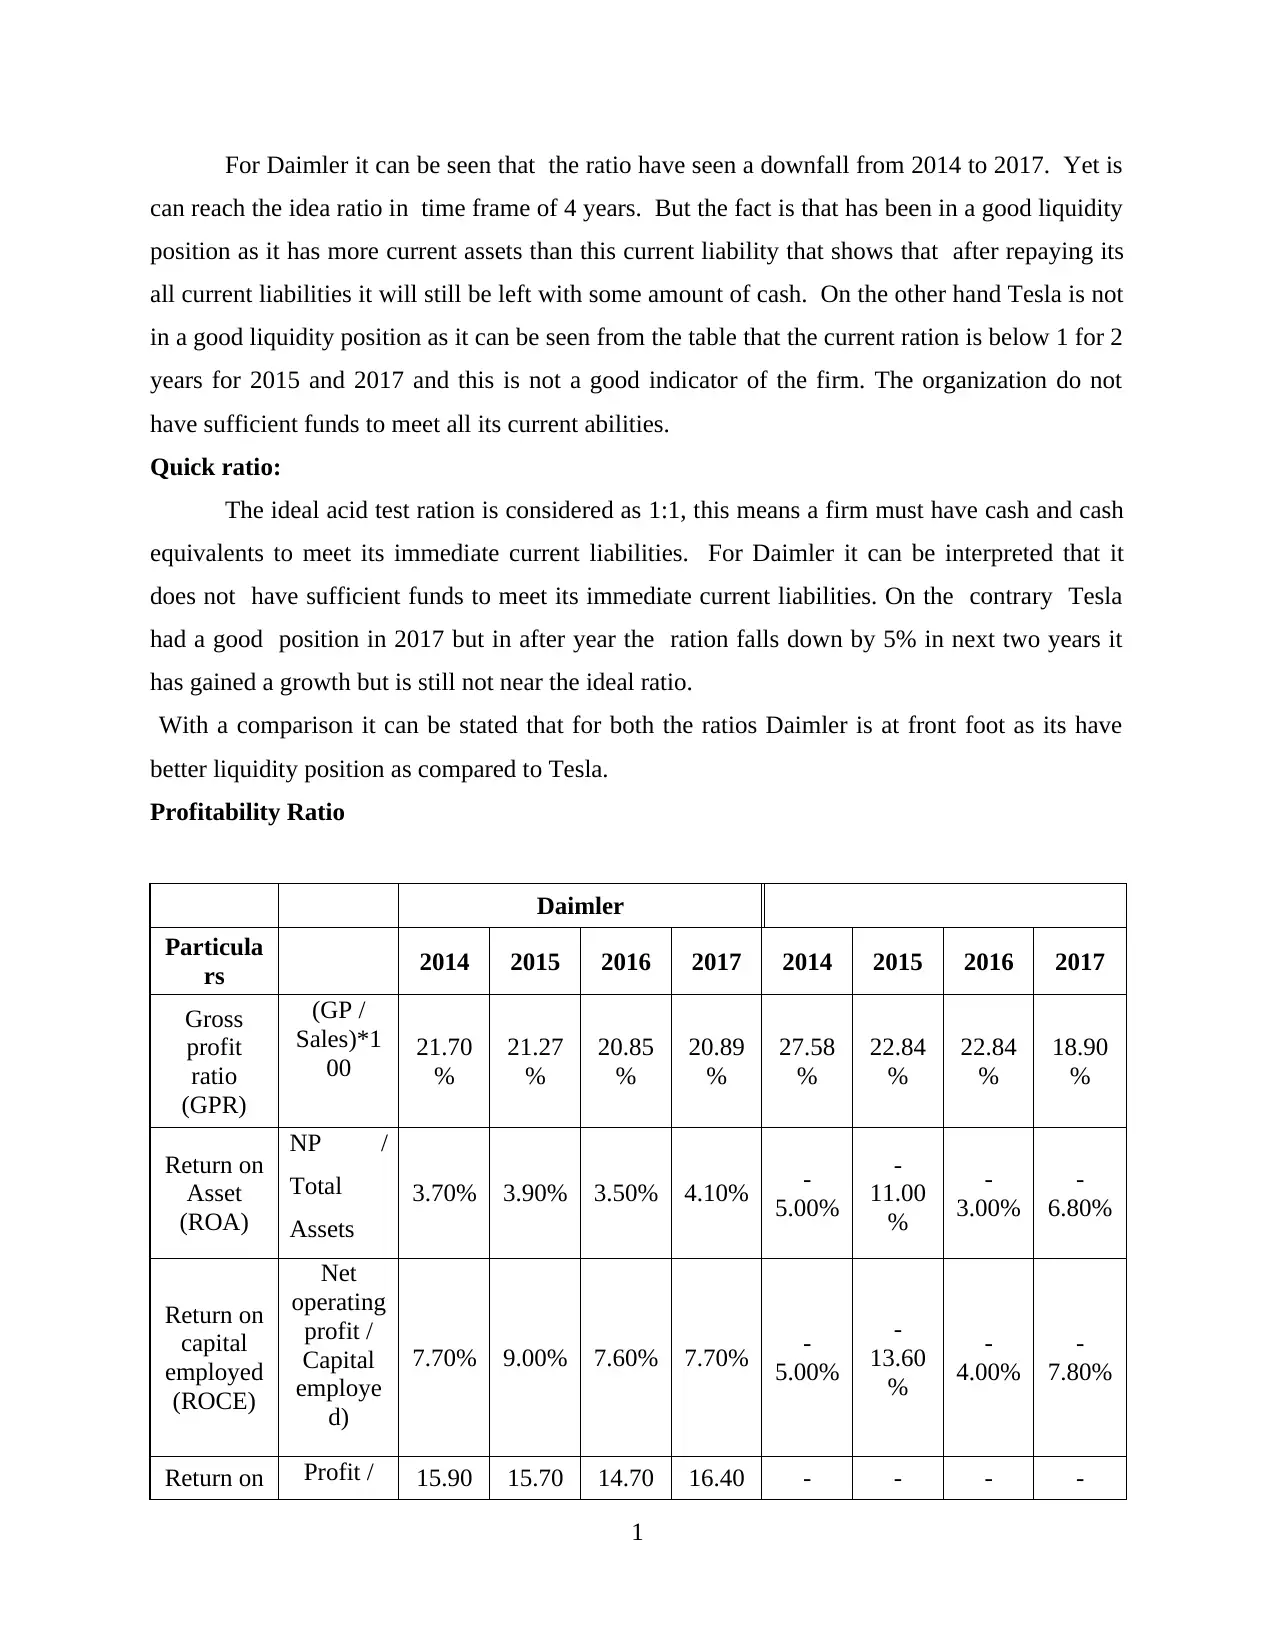
Interpretation:
These are the profits which determines the profitable Profitableness of an organisation.
The reflation is presented on what percentage of return are earned ion each investment made by
firm such as capital employed, total assets, equity etc.
Gross profit ratio:
This is the ratio which defines the operation performance of the organisation. This is
computed with context of net sales. For Daimler this ratio was huge for all 4 years the earning
on sales fall in category of 20-21%m, this indicated that company is in a good profitability
condition over its sales. On the other hand Tesla is in even better position as compared to
Daimler. The ration for 2014 was 27.58% which is tremendous for an organization but in next
three years it has seen a regular down fall. For 2015 and 2016 the ratio was at same level with a
reached to 18.896% in 2017 with a fall of 4 %.
Return on capital employed (ROCE):
This ratio defines the efficiency of an organisation in generation profit by comparing the
net profits with capital employed. For Daimler it can be seen that the ration was same for 2014
and 2017 with as rise in 2015 and a fall in 2016. With this is can be articulated that firm is
earning revenues on this capital employed and this reflects strong financial position of the firm.
For Tesla, the ration is negative for all 4 years and this stated that organization in not earning any
penny over it capital employed and the fall in the ration is increasing with each passing year
which is not a good indicator for business's profitability.
Return on Asset ROA
This ratio measures the net income produced by total assets during a period by
compassion of net profit with average total assets. Daimler is earning average amount of return
of the assets this shows that the company is using its assets optimally to genera revenues. On the
contrary for Tesla it can be seen that for a period of 4 year company have not earned returns on
its assets. The investment in asset is not getting any profits in return. The assets are not used in
efficient manner and are incapable to generate any revenues for themselves.
Return on Equity (ROE):
This ratio determines that how much profits is earned by the company with each
monetary unit of shareholders' equity. For Daimler it can be sen that firm had earned good reruns
1
(ROE)
Net
worth % % % % 32.20
%
81.60
%
14.20
%
46.30
%
Interpretation:
These are the profits which determines the profitable Profitableness of an organisation.
The reflation is presented on what percentage of return are earned ion each investment made by
firm such as capital employed, total assets, equity etc.
Gross profit ratio:
This is the ratio which defines the operation performance of the organisation. This is
computed with context of net sales. For Daimler this ratio was huge for all 4 years the earning
on sales fall in category of 20-21%m, this indicated that company is in a good profitability
condition over its sales. On the other hand Tesla is in even better position as compared to
Daimler. The ration for 2014 was 27.58% which is tremendous for an organization but in next
three years it has seen a regular down fall. For 2015 and 2016 the ratio was at same level with a
reached to 18.896% in 2017 with a fall of 4 %.
Return on capital employed (ROCE):
This ratio defines the efficiency of an organisation in generation profit by comparing the
net profits with capital employed. For Daimler it can be seen that the ration was same for 2014
and 2017 with as rise in 2015 and a fall in 2016. With this is can be articulated that firm is
earning revenues on this capital employed and this reflects strong financial position of the firm.
For Tesla, the ration is negative for all 4 years and this stated that organization in not earning any
penny over it capital employed and the fall in the ration is increasing with each passing year
which is not a good indicator for business's profitability.
Return on Asset ROA
This ratio measures the net income produced by total assets during a period by
compassion of net profit with average total assets. Daimler is earning average amount of return
of the assets this shows that the company is using its assets optimally to genera revenues. On the
contrary for Tesla it can be seen that for a period of 4 year company have not earned returns on
its assets. The investment in asset is not getting any profits in return. The assets are not used in
efficient manner and are incapable to generate any revenues for themselves.
Return on Equity (ROE):
This ratio determines that how much profits is earned by the company with each
monetary unit of shareholders' equity. For Daimler it can be sen that firm had earned good reruns
1
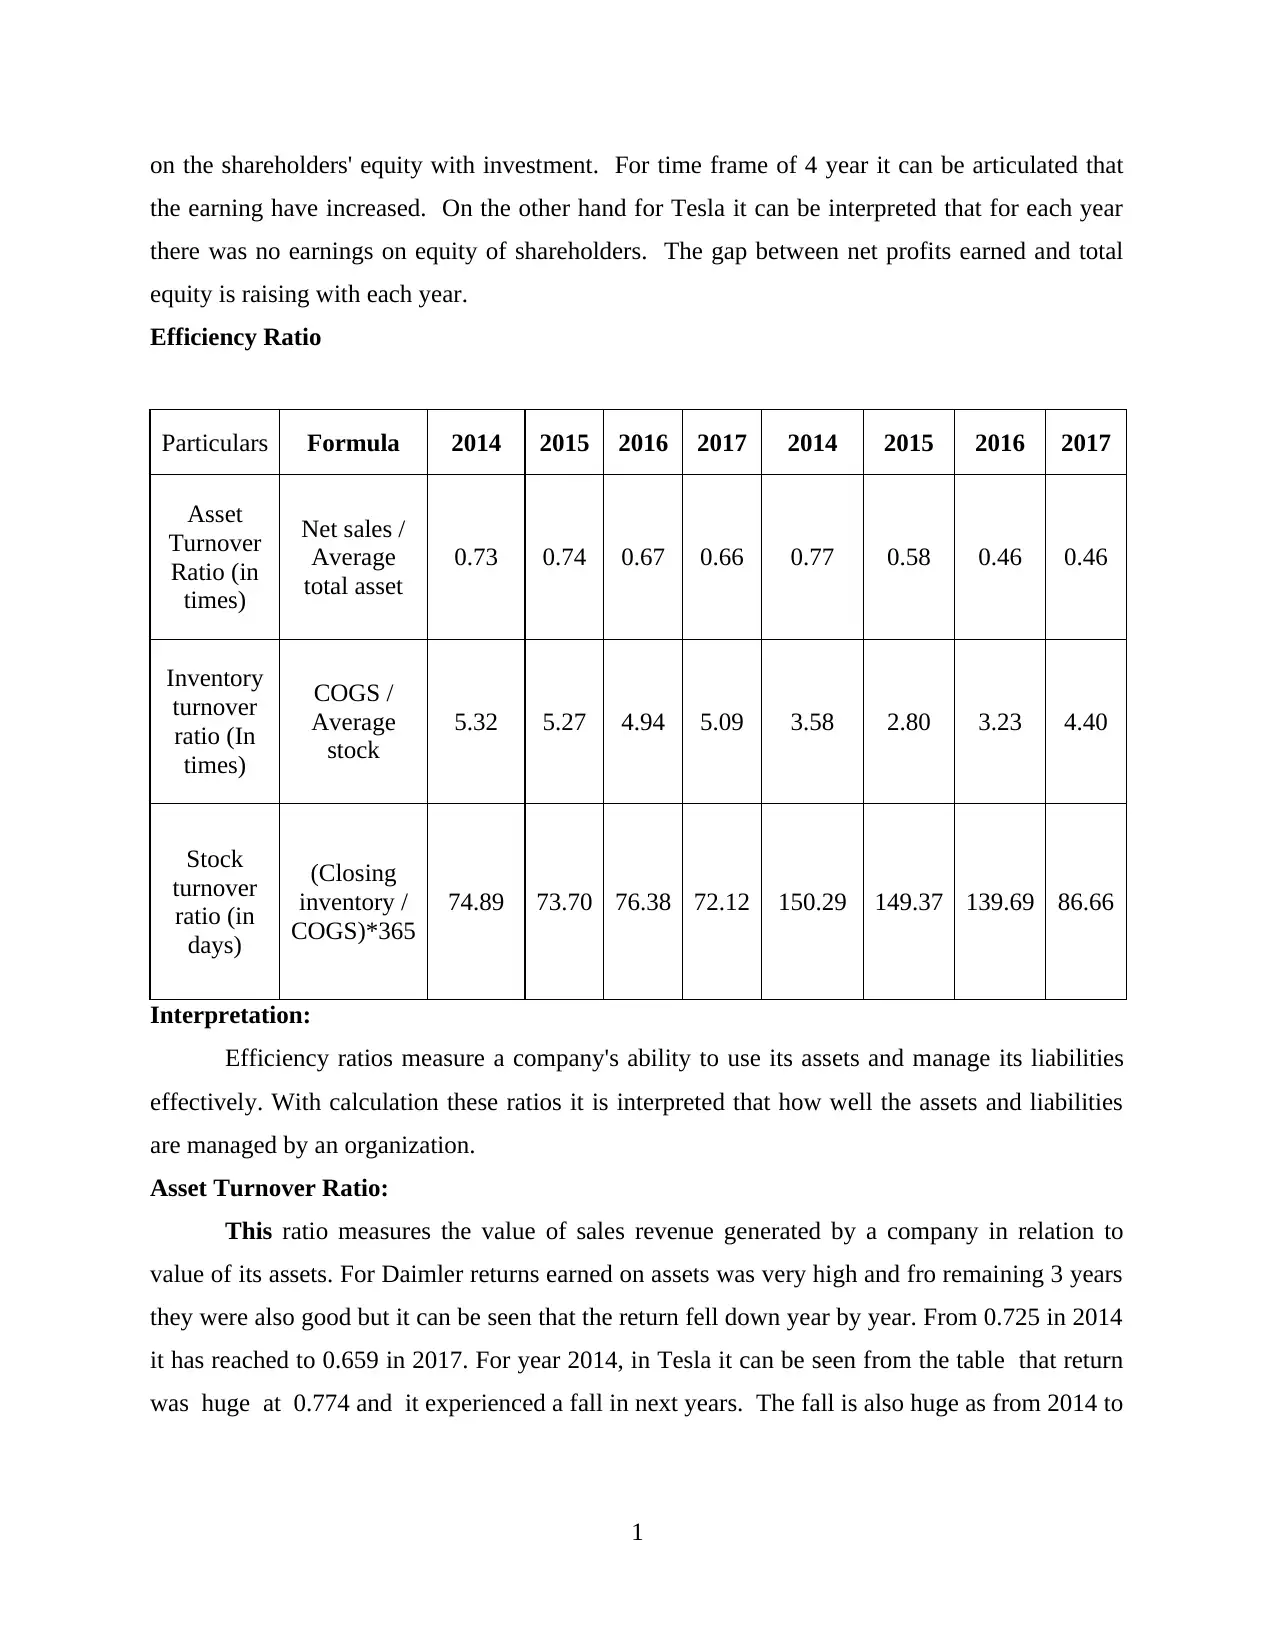
on the shareholders' equity with investment. For time frame of 4 year it can be articulated that
the earning have increased. On the other hand for Tesla it can be interpreted that for each year
there was no earnings on equity of shareholders. The gap between net profits earned and total
equity is raising with each year.
Efficiency Ratio
Particulars Formula 2014 2015 2016 2017 2014 2015 2016 2017
Asset
Turnover
Ratio (in
times)
Net sales /
Average
total asset
0.73 0.74 0.67 0.66 0.77 0.58 0.46 0.46
Inventory
turnover
ratio (In
times)
COGS /
Average
stock
5.32 5.27 4.94 5.09 3.58 2.80 3.23 4.40
Stock
turnover
ratio (in
days)
(Closing
inventory /
COGS)*365
74.89 73.70 76.38 72.12 150.29 149.37 139.69 86.66
Interpretation:
Efficiency ratios measure a company's ability to use its assets and manage its liabilities
effectively. With calculation these ratios it is interpreted that how well the assets and liabilities
are managed by an organization.
Asset Turnover Ratio:
This ratio measures the value of sales revenue generated by a company in relation to
value of its assets. For Daimler returns earned on assets was very high and fro remaining 3 years
they were also good but it can be seen that the return fell down year by year. From 0.725 in 2014
it has reached to 0.659 in 2017. For year 2014, in Tesla it can be seen from the table that return
was huge at 0.774 and it experienced a fall in next years. The fall is also huge as from 2014 to
1
⊘ This is a preview!⊘
Do you want full access?
Subscribe today to unlock all pages.
Trusted by 1+ million students worldwide
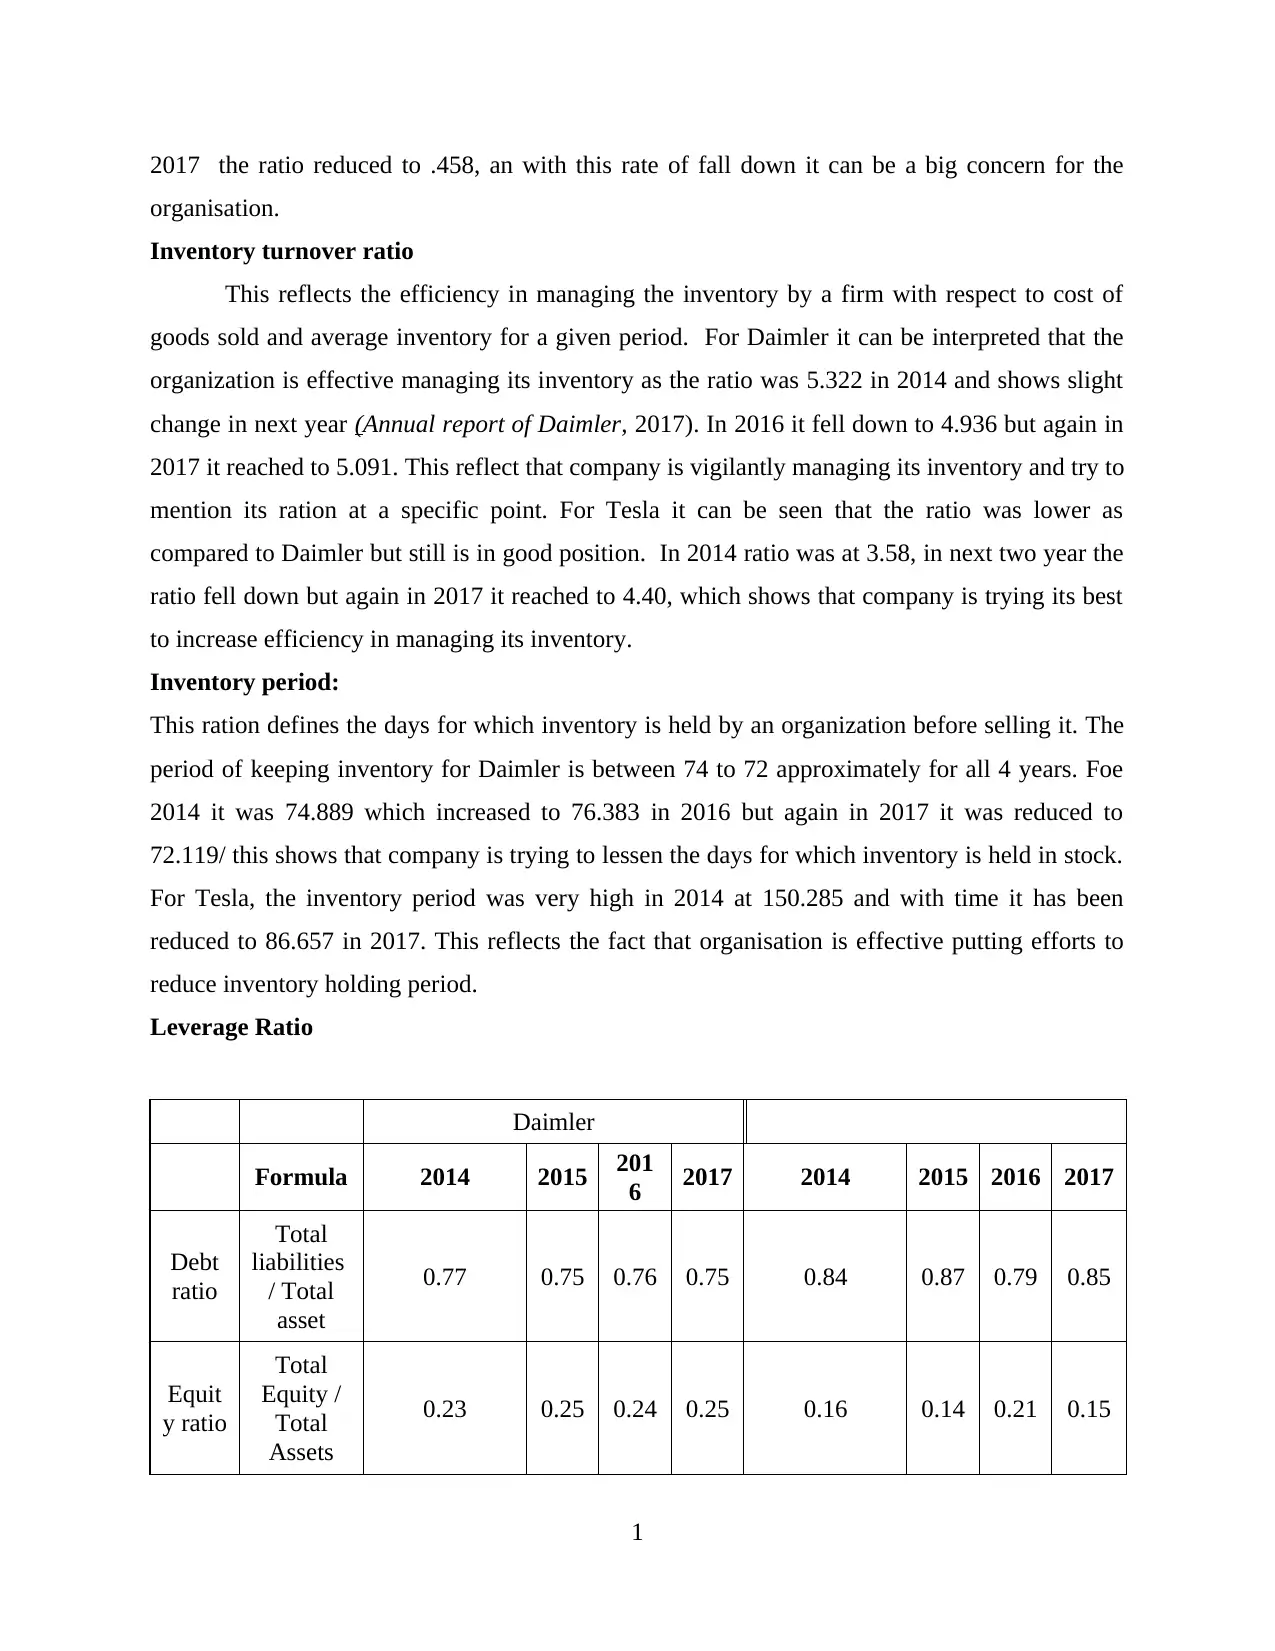
2017 the ratio reduced to .458, an with this rate of fall down it can be a big concern for the
organisation.
Inventory turnover ratio
This reflects the efficiency in managing the inventory by a firm with respect to cost of
goods sold and average inventory for a given period. For Daimler it can be interpreted that the
organization is effective managing its inventory as the ratio was 5.322 in 2014 and shows slight
change in next year (Annual report of Daimler, 2017). In 2016 it fell down to 4.936 but again in
2017 it reached to 5.091. This reflect that company is vigilantly managing its inventory and try to
mention its ration at a specific point. For Tesla it can be seen that the ratio was lower as
compared to Daimler but still is in good position. In 2014 ratio was at 3.58, in next two year the
ratio fell down but again in 2017 it reached to 4.40, which shows that company is trying its best
to increase efficiency in managing its inventory.
Inventory period:
This ration defines the days for which inventory is held by an organization before selling it. The
period of keeping inventory for Daimler is between 74 to 72 approximately for all 4 years. Foe
2014 it was 74.889 which increased to 76.383 in 2016 but again in 2017 it was reduced to
72.119/ this shows that company is trying to lessen the days for which inventory is held in stock.
For Tesla, the inventory period was very high in 2014 at 150.285 and with time it has been
reduced to 86.657 in 2017. This reflects the fact that organisation is effective putting efforts to
reduce inventory holding period.
Leverage Ratio
Daimler
Formula 2014 2015 201
6 2017 2014 2015 2016 2017
Debt
ratio
Total
liabilities
/ Total
asset
0.77 0.75 0.76 0.75 0.84 0.87 0.79 0.85
Equit
y ratio
Total
Equity /
Total
Assets
0.23 0.25 0.24 0.25 0.16 0.14 0.21 0.15
1
Paraphrase This Document
Need a fresh take? Get an instant paraphrase of this document with our AI Paraphraser
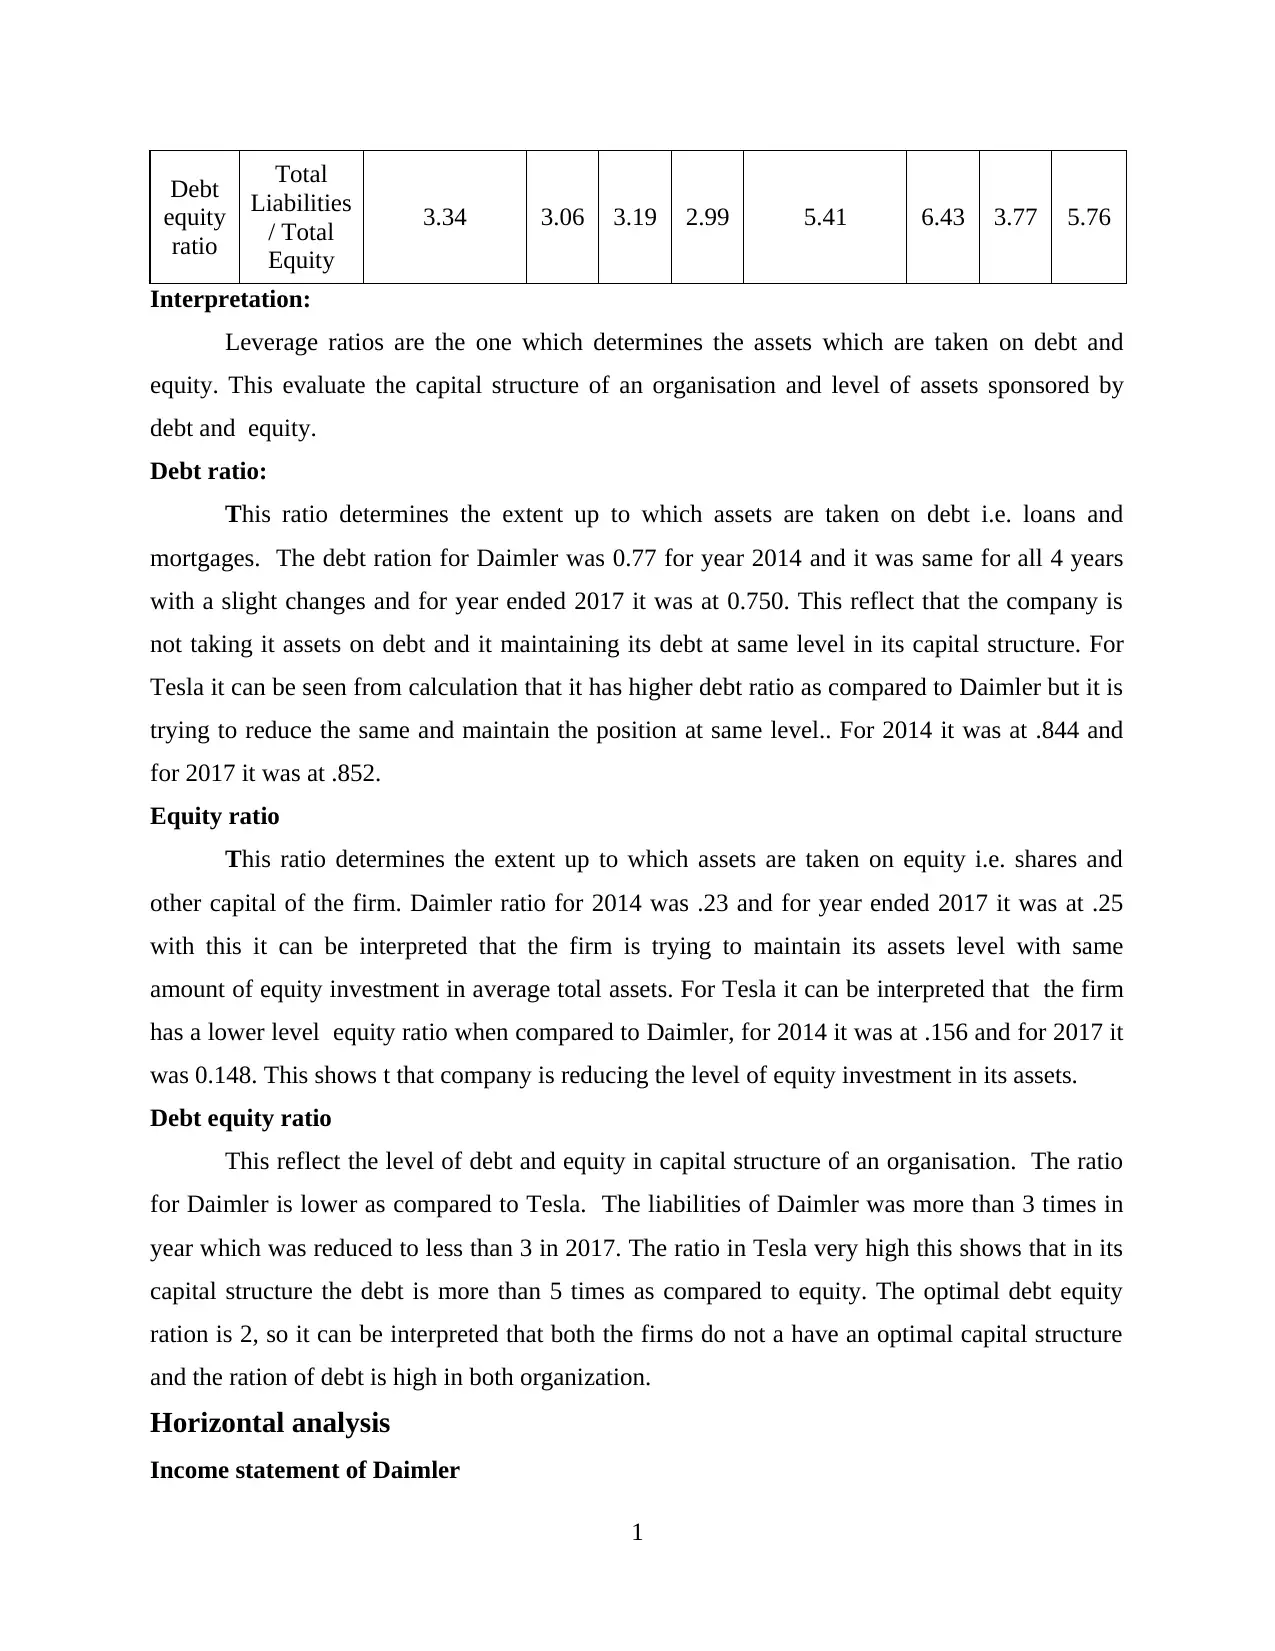
Debt
equity
ratio
Total
Liabilities
/ Total
Equity
3.34 3.06 3.19 2.99 5.41 6.43 3.77 5.76
Interpretation:
Leverage ratios are the one which determines the assets which are taken on debt and
equity. This evaluate the capital structure of an organisation and level of assets sponsored by
debt and equity.
Debt ratio:
This ratio determines the extent up to which assets are taken on debt i.e. loans and
mortgages. The debt ration for Daimler was 0.77 for year 2014 and it was same for all 4 years
with a slight changes and for year ended 2017 it was at 0.750. This reflect that the company is
not taking it assets on debt and it maintaining its debt at same level in its capital structure. For
Tesla it can be seen from calculation that it has higher debt ratio as compared to Daimler but it is
trying to reduce the same and maintain the position at same level.. For 2014 it was at .844 and
for 2017 it was at .852.
Equity ratio
This ratio determines the extent up to which assets are taken on equity i.e. shares and
other capital of the firm. Daimler ratio for 2014 was .23 and for year ended 2017 it was at .25
with this it can be interpreted that the firm is trying to maintain its assets level with same
amount of equity investment in average total assets. For Tesla it can be interpreted that the firm
has a lower level equity ratio when compared to Daimler, for 2014 it was at .156 and for 2017 it
was 0.148. This shows t that company is reducing the level of equity investment in its assets.
Debt equity ratio
This reflect the level of debt and equity in capital structure of an organisation. The ratio
for Daimler is lower as compared to Tesla. The liabilities of Daimler was more than 3 times in
year which was reduced to less than 3 in 2017. The ratio in Tesla very high this shows that in its
capital structure the debt is more than 5 times as compared to equity. The optimal debt equity
ration is 2, so it can be interpreted that both the firms do not a have an optimal capital structure
and the ration of debt is high in both organization.
Horizontal analysis
Income statement of Daimler
1
Interpretation:
The percentage change in sales revenue from 2014 to 2015 was 15.09%. For next two
year it was 2.54% and 7.22%. This change shows the increment is sales and revenue generated
by Daimler over years. The major jump in sales was seen in year 2015, and the lowest was in
2016 with an increment of just 2.54%. The gross profit % changes was 12.852 for 2015 and for
2017 it was 7.41. This fall in percentage change was due to the fact that with increment the sales
revenue cost good sold also increased but with a higher rate this resulted in increase in gross
profit with lesser amount. The net profit was loses in year 2015 though sales revenue and gross
profits were highest in this year. Reason being high level expenditure in other expenses.
Financial statement of Daimler
Interpretation
The percentage change in current asset for 2015 was 19.06%, this is a huge change and
this was due increment in prepaid expenses which increased by 50%, for net two year the
increment was 11.11% and 4.59% only. Th change in current liabilities was 15.09% for 2015
and for 2017 it was 3.14. The major change in 2015 was due to increase in other current
liabilities. For year 2015 total asset and liability percentage change was 14.52% and 12.08%
repetitively.
Income statement of Tesla:
Interpretation:
The sales revenue percentage change is huge in Tesla as there was high level of sales
with every changing year. With a hike in sales revenue the cost of good sold also jumped from a
percentage change of 34.8% to 76.6% in 20174 and 20417 respectively the operation, R&D,
sales, general and administrative expenses increment was a reason for this much hike in cost of
goods sold. Net profit percentage change was 202.4% to 190.7% in 2014 and 2017 receptively.
With an increase in sales revenue there is still a falling net profits, the reason being that company
do not have effective control over its administrative ans operating expenses.
Financial statement of Tesla :
Interpretation:
Total current assets saw a major fluctuation in this 4 years as in 2015 there was reduction
by 12.75% and again in 2016 it took a sum by 124.18%. This was due to increase in cash and
1
⊘ This is a preview!⊘
Do you want full access?
Subscribe today to unlock all pages.
Trusted by 1+ million students worldwide

cash equivalents. The total asset percentage change decreased from 383.32% in 2014 to 26.44%
in 2017, this was due to decrease in total non current asset from 99.96% to 34.63%.
Vertical analysis
Income statement of Daimler
Interpretation:
The cost of good sold for year 2014 and 2015 was almost same and maintained at a level
of near 78% of the sales revenue. For 20165 the is an increment in 1 % in cogs this can be due
increase in price of direct material or labor rates. The company had maintained a control over its
operating expense have decreased over years. The expanses of taxes also have reduces over a
period of 4 years. This reflects the fact that company have gained a control over its operating and
administrative expanses and this resulted in increment of the profits of the firm over years.
Financial statement of Daimler
Interpretation:
Under vertical analysis all item do assets side are calculated as a % of total asset. In 2015
the current assets were 40.68% of the total assets and in year 2017 it was 42%. There was an
increment of 2|% and this was due the fact that total assets increased by almost 60000 and total
current asset increased by 30000 approx. this resulted in increment in percentage of current asset
over total asset of Daimler. Current liability as % of total was 35.32% in 2014 and for 2017 it
was 34.76%, here also an increment of 2% can be observed. The non current liability percentage
did not see a major change as for 2014 and 2017 it was 41.66% and 41.39% respectively. There
was nothing much change in equity percentage as to total liability and equity. For 2014 it was
23.03% and for 2017 it was 23.85%. A slight increment is due to increase in retained earnings.
Income statement of Tesla
Interpretation:
The cost of good sole as a percentage of total sales was 72.5% in 2015 which increased to
77.2% in 2017 and this decreased the percentage of gross profit to sales from 27.55 in 2014 to
22.8% in 2017. The reason for increment in cost of goods sold over years was rise in both Sales,
general and administrative and R&D cost. The net profit to percentage of sales was in negative
for all years. The reason behind this is that operating expenses are always higher than the gross
profits so net profits always negative.
Financial statement of Tesla
1
Paraphrase This Document
Need a fresh take? Get an instant paraphrase of this document with our AI Paraphraser
Interpretation:
There is a huge reduction in total current assets as percentage of total asset for 2015 and
2017 as 54.69% to 27.62%. The major reduction was due to rise in the value of total assets as
there was not major changes in values of items of current assets. The total current liability a
percentage of total liability and equity also reduced from 2014 to 2017 for 2014 it was 36.02%
and fro 2017 it was 25.71%. This reduction was due to the fact that total value increased from
5849 to 28655 in 2014 to 2017 respectively. The reason for this was increment in paid up share
capital of the firm by 6833. with this it can be interpreted that Tesla has maintained its position
for current assets and liabilities but increased its capital and equity.
Cash position of both the organisation
Interpretation:
The cash position of Daimler can be stated as in incremental position as the cash with
organisation was $16706 million in 2014 which reached to $23491 million in 2017, so this states
that firm is in significantly earning good profits. Tesla do not have good cash position in both at
personal and industrial level. The cash with firm was $1906 million in 2017 and $3368 million
in 2017, though there is an increment butt when compared to Daimler this is not considered at
better cash position for business.
CONCLUSION
From the above report it can be concluded that Daimler is in better position as compared
to Tesla. For the year 2014 Tesla was in a good financial position but in coming year it
experienced a down fall. Daimler is operating in a profitable condition and with interpretation of
ratios it can be significantly stated that its is at a good financial position in cortex of profits and
liquidity.
1

REFERENCES
ONLINE
Annual report of Daimler. 2017. [Online]. Available through
<https://www.daimler.com/downloads/en/>.
Annual report of Tesla. 2017. [Online]. Available through <http://ir.tesla.com/financial-
information/quarterly-results>.
1
ONLINE
Annual report of Daimler. 2017. [Online]. Available through
<https://www.daimler.com/downloads/en/>.
Annual report of Tesla. 2017. [Online]. Available through <http://ir.tesla.com/financial-
information/quarterly-results>.
1
⊘ This is a preview!⊘
Do you want full access?
Subscribe today to unlock all pages.
Trusted by 1+ million students worldwide
1 out of 31
Related Documents


Your All-in-One AI-Powered Toolkit for Academic Success.
+13062052269
info@desklib.com
Available 24*7 on WhatsApp / Email
![[object Object]](/_next/static/media/star-bottom.7253800d.svg)
Unlock your academic potential
Copyright © 2020–2026 A2Z Services. All Rights Reserved. Developed and managed by ZUCOL.