Comprehensive Financial Analysis Project Report: Data#3 LTD
VerifiedAdded on 2020/03/16
|15
|3747
|68
Project
AI Summary
This project report presents a comprehensive financial analysis of Data#3 LTD, an Australian information and communication technology company. The report delves into various aspects of the company's financial health, including debt valuation, share valuation, cost of capital, and market analysis. The debt valuation section examines the company's long-term and short-term debt positions, comparing them with a competitor's. It calculates the cost of debt and assesses the debt levels. The share valuation component utilizes the dividend discount model and P/E model to determine the cost of equity and intrinsic value of the shares, evaluating the company's turnover and earnings over the past five years. The weighted average cost of capital (WACC) is calculated, considering the cost of debt and equity, and analyzing the company's capital structure in comparison to industry standards. The report concludes with a market analysis, highlighting the company's positive performance and potential for future growth, referencing various financial publications and expressing the need for optimal capital structure management. The report suggests that the company should make some changes in capital structure to manage the cost of capital and risk factors.
Running Head: Finance
1
Project Report: Finance
1
Project Report: Finance
Paraphrase This Document
Need a fresh take? Get an instant paraphrase of this document with our AI Paraphraser
Finance
2
Contents
Introduction.......................................................................................................................3
Debt valuation...................................................................................................................3
Share valuation.................................................................................................................4
Cost of capital...................................................................................................................6
Market analysis.................................................................................................................8
Conclusion........................................................................................................................8
References.........................................................................................................................9
Finance
3
Introduction:
Investors are the main stakeholders of a company. Investors help a company to
enhance the funds for new projects and investment plan of the company. It is said by
everyone that investor are required to investigate and analyze the entire factors and aspect of
the country, economy, industry and company before invest their savings and amount into the
company. In this report, DATA#3 LTD company has been taken into the context. For
identifying the worth of the company, various tools and techniques have bene analyzed.
Mainly, a study has been conducted over the debt valuation in which cost of debt of the
company has been analyzed, next, share valuation has been done and cost of equity has been
analyzed. Further, cost of capital, market analysis etc has been done.
Data# 3 limited is an Australian company which has been registered in the ASX. The
head office of the company is in Brisbane. It is an information and communication
technology company. This company has been founded in 1984 and currently this company is
enhancing its revenue rapidly.
Debt valuation:
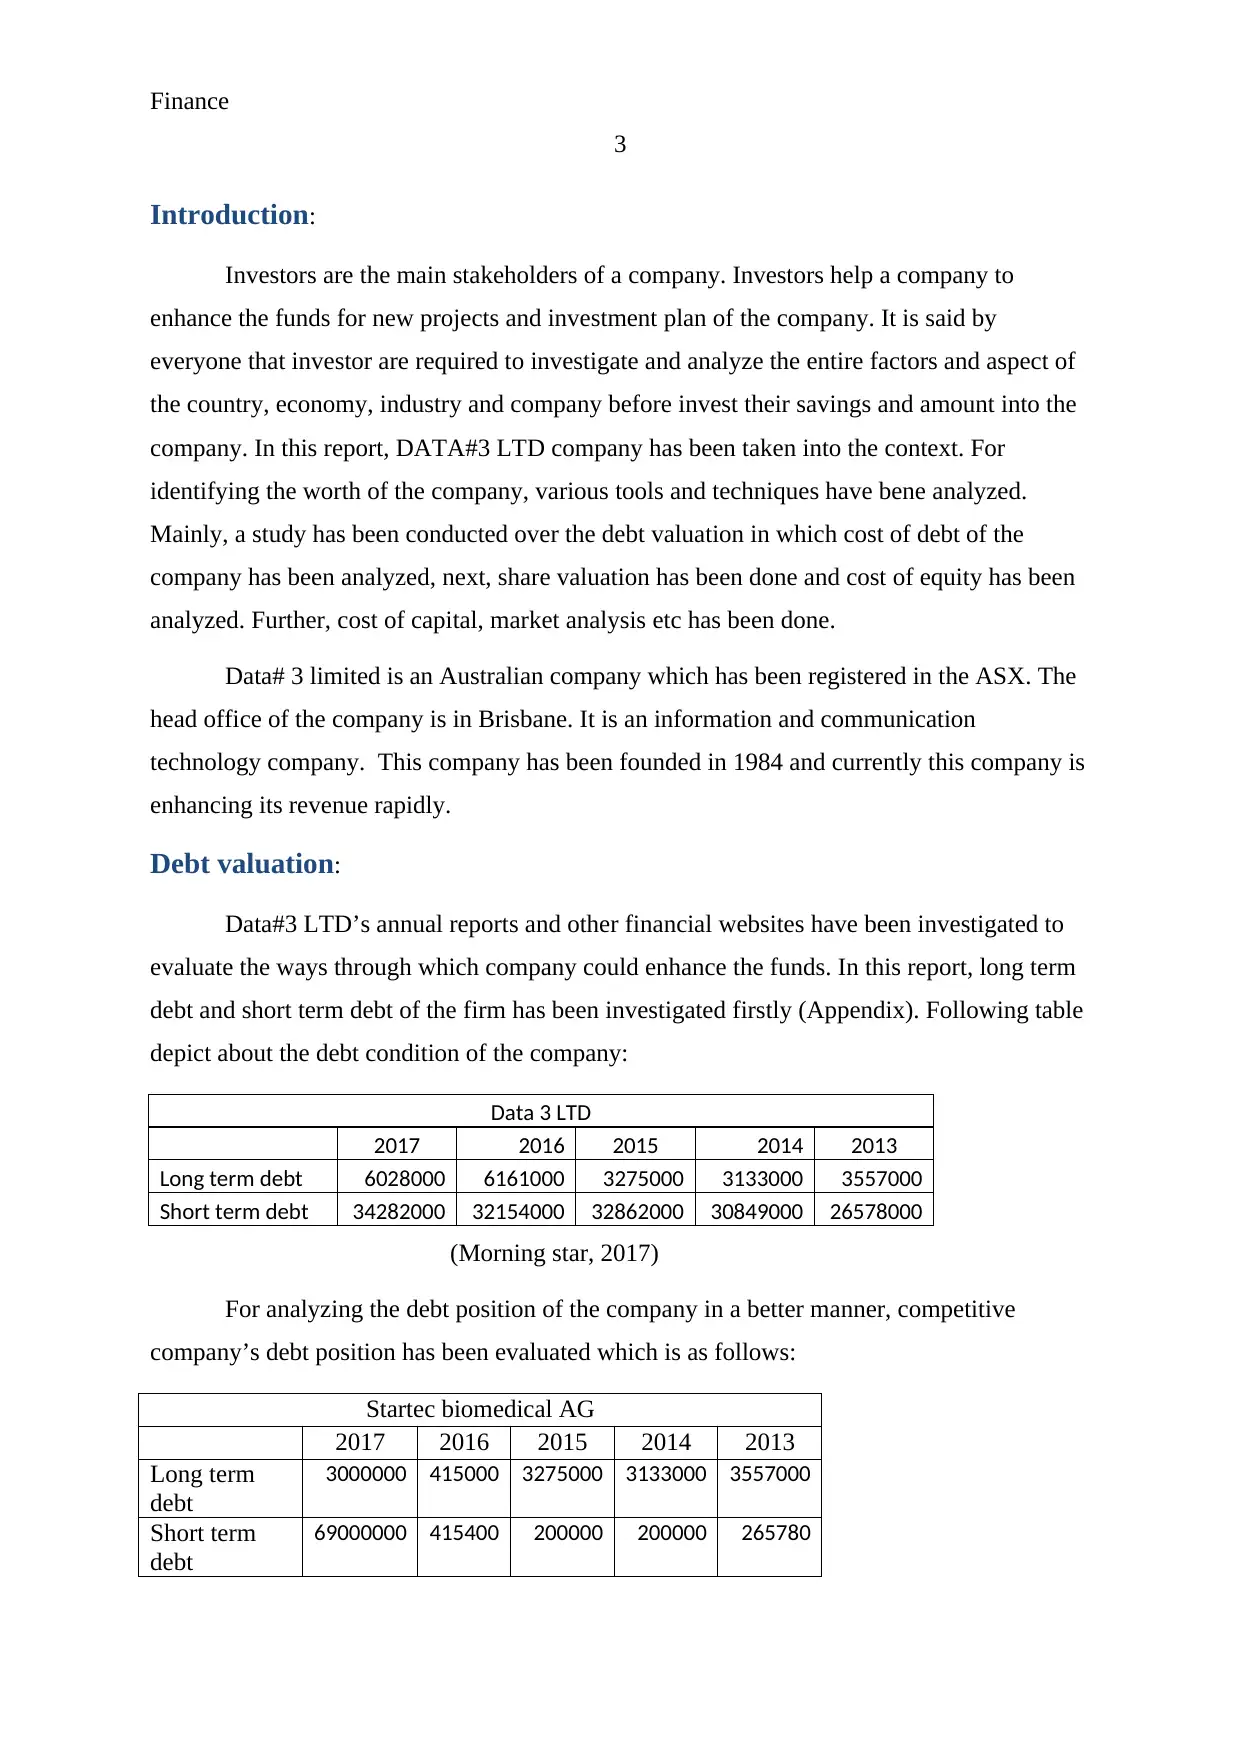
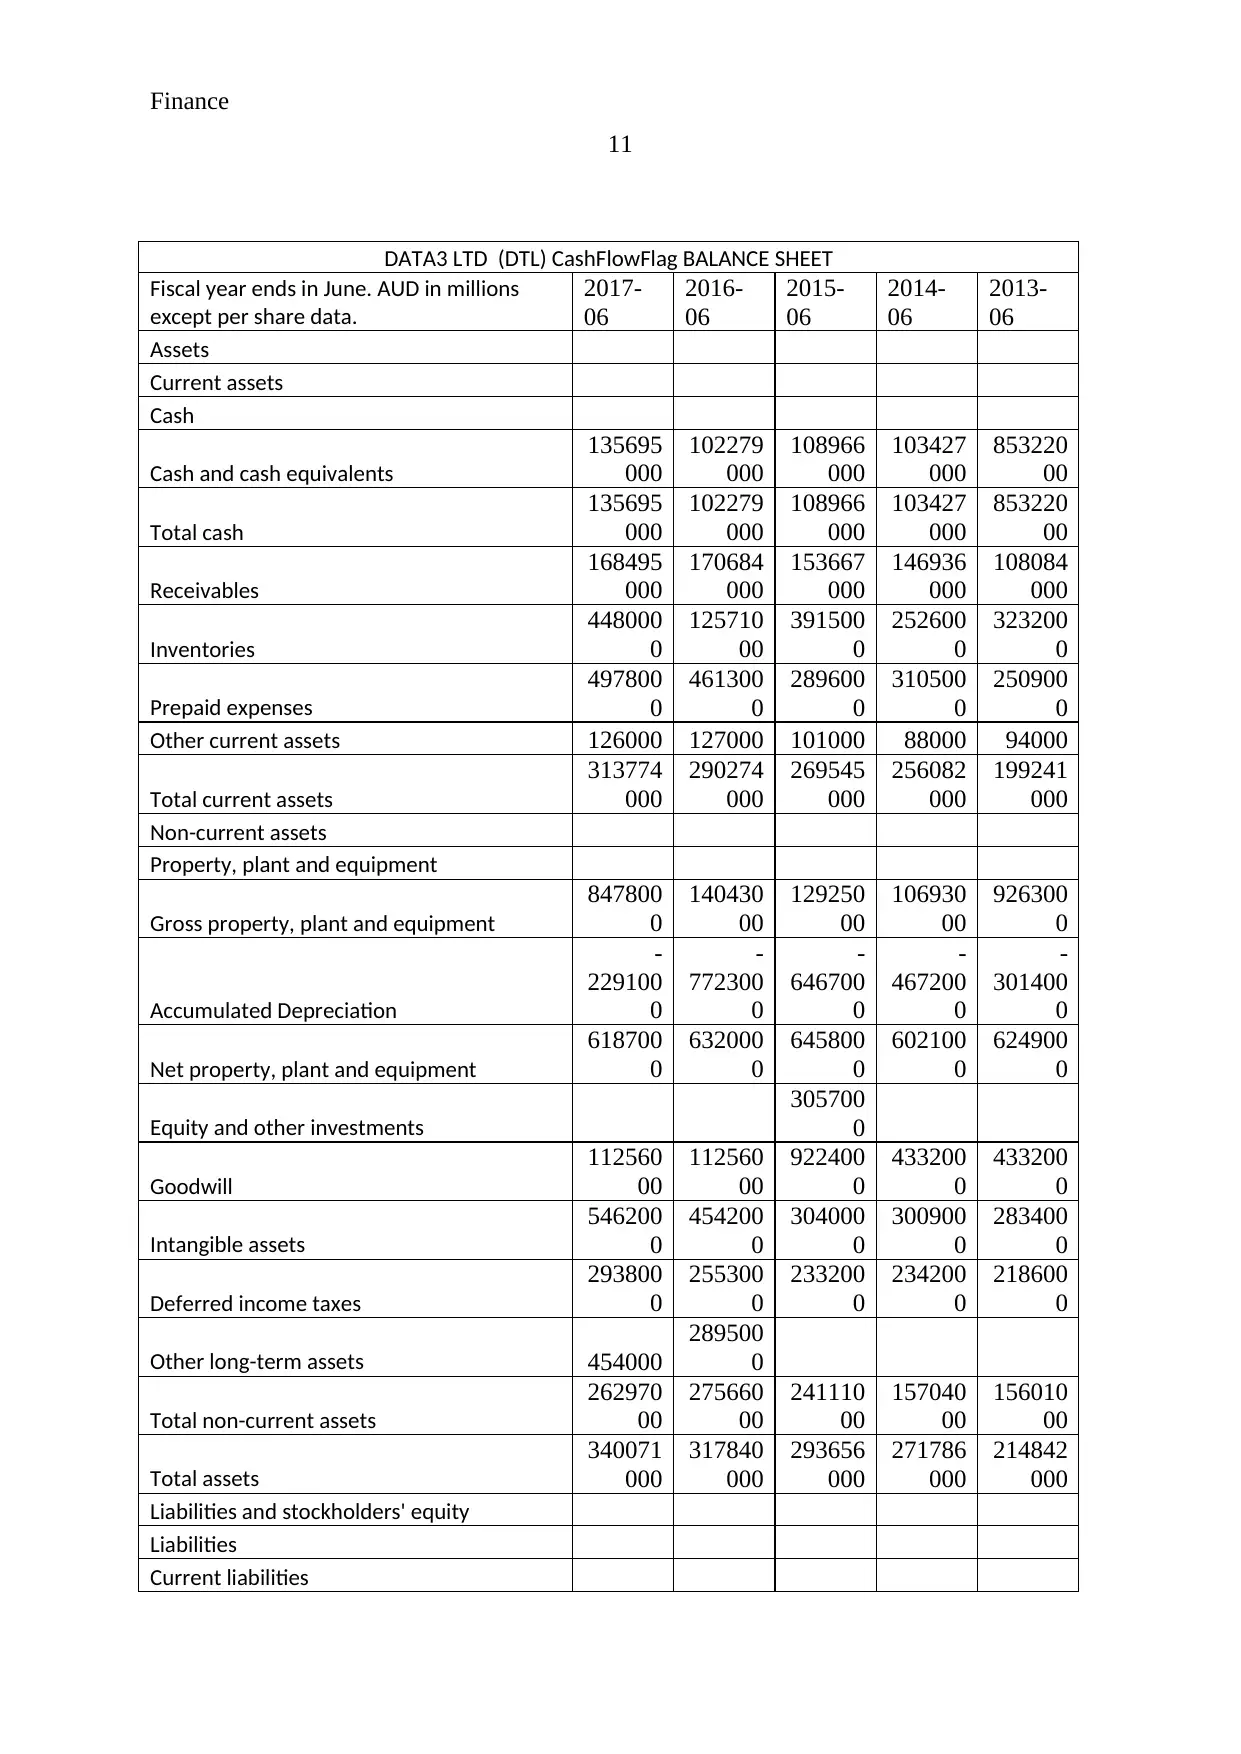
Data#3 LTD’s annual reports and other financial websites have been investigated to
evaluate the ways through which company could enhance the funds. In this report, long term
debt and short term debt of the firm has been investigated firstly (Appendix). Following table
depict about the debt condition of the company:
Data 3 LTD
2017 2016 2015 2014 2013
Long term debt 6028000 6161000 3275000 3133000 3557000
Short term debt 34282000 32154000 32862000 30849000 26578000
(Morning star, 2017)
For analyzing the debt position of the company in a better manner, competitive
company’s debt position has been evaluated which is as follows:
Startec biomedical AG
2017 2016 2015 2014 2013
Long term
debt
3000000 415000 3275000 3133000 3557000
Short term
debt
69000000 415400 200000 200000 265780
3
Introduction:
Investors are the main stakeholders of a company. Investors help a company to
enhance the funds for new projects and investment plan of the company. It is said by
everyone that investor are required to investigate and analyze the entire factors and aspect of
the country, economy, industry and company before invest their savings and amount into the
company. In this report, DATA#3 LTD company has been taken into the context. For
identifying the worth of the company, various tools and techniques have bene analyzed.
Mainly, a study has been conducted over the debt valuation in which cost of debt of the
company has been analyzed, next, share valuation has been done and cost of equity has been
analyzed. Further, cost of capital, market analysis etc has been done.
Data# 3 limited is an Australian company which has been registered in the ASX. The
head office of the company is in Brisbane. It is an information and communication
technology company. This company has been founded in 1984 and currently this company is
enhancing its revenue rapidly.
Debt valuation:
Data#3 LTD’s annual reports and other financial websites have been investigated to
evaluate the ways through which company could enhance the funds. In this report, long term
debt and short term debt of the firm has been investigated firstly (Appendix). Following table
depict about the debt condition of the company:
Data 3 LTD
2017 2016 2015 2014 2013
Long term debt 6028000 6161000 3275000 3133000 3557000
Short term debt 34282000 32154000 32862000 30849000 26578000
(Morning star, 2017)
For analyzing the debt position of the company in a better manner, competitive
company’s debt position has been evaluated which is as follows:
Startec biomedical AG
2017 2016 2015 2014 2013
Long term
debt
3000000 415000 3275000 3133000 3557000
Short term
debt
69000000 415400 200000 200000 265780
⊘ This is a preview!⊘
Do you want full access?
Subscribe today to unlock all pages.
Trusted by 1+ million students worldwide
Finance
4
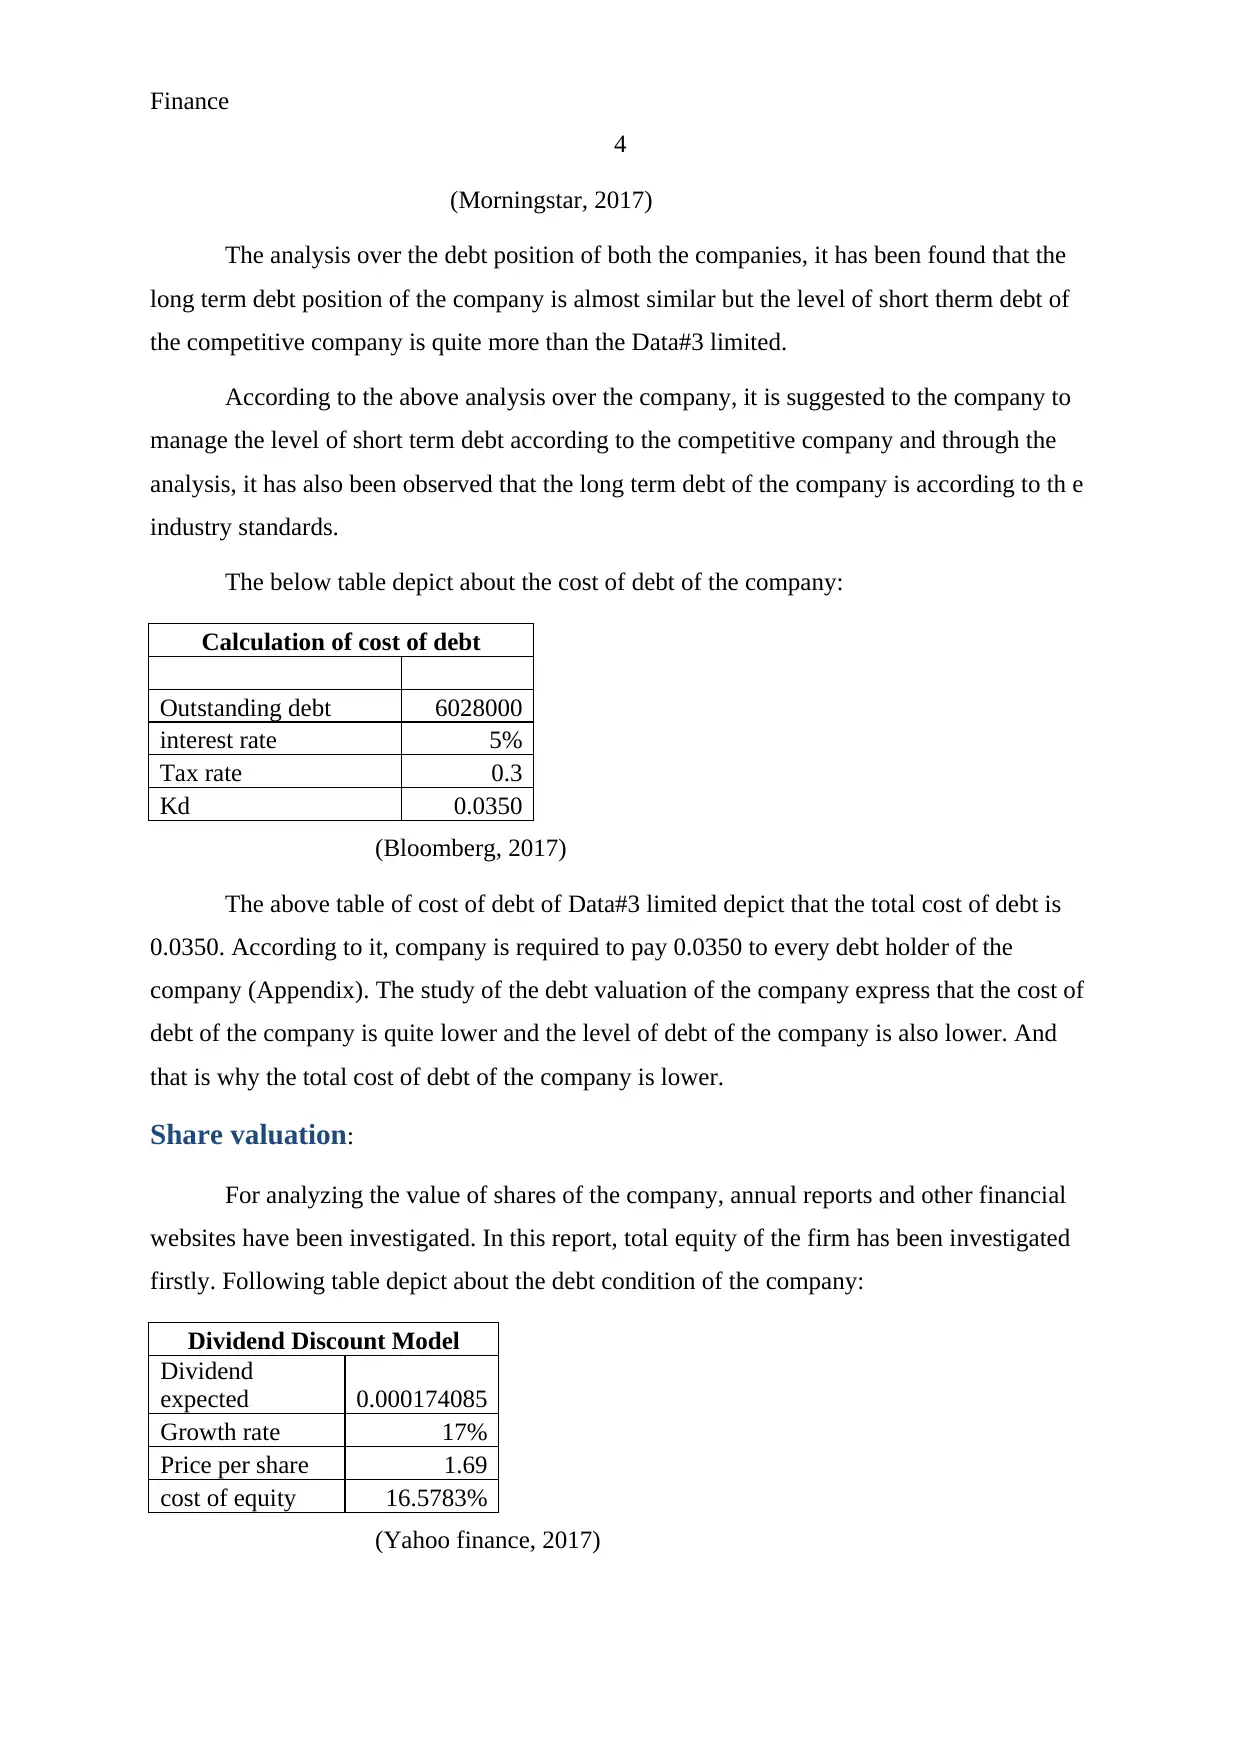
(Morningstar, 2017)
The analysis over the debt position of both the companies, it has been found that the
long term debt position of the company is almost similar but the level of short therm debt of
the competitive company is quite more than the Data#3 limited.
According to the above analysis over the company, it is suggested to the company to
manage the level of short term debt according to the competitive company and through the
analysis, it has also been observed that the long term debt of the company is according to th e
industry standards.
The below table depict about the cost of debt of the company:
Calculation of cost of debt
Outstanding debt 6028000
interest rate 5%
Tax rate 0.3
Kd 0.0350
(Bloomberg, 2017)
The above table of cost of debt of Data#3 limited depict that the total cost of debt is
0.0350. According to it, company is required to pay 0.0350 to every debt holder of the
company (Appendix). The study of the debt valuation of the company express that the cost of
debt of the company is quite lower and the level of debt of the company is also lower. And
that is why the total cost of debt of the company is lower.
Share valuation:
For analyzing the value of shares of the company, annual reports and other financial
websites have been investigated. In this report, total equity of the firm has been investigated
firstly. Following table depict about the debt condition of the company:
Dividend Discount Model
Dividend
expected 0.000174085
Growth rate 17%
Price per share 1.69
cost of equity 16.5783%
(Yahoo finance, 2017)
4
(Morningstar, 2017)
The analysis over the debt position of both the companies, it has been found that the
long term debt position of the company is almost similar but the level of short therm debt of
the competitive company is quite more than the Data#3 limited.
According to the above analysis over the company, it is suggested to the company to
manage the level of short term debt according to the competitive company and through the
analysis, it has also been observed that the long term debt of the company is according to th e
industry standards.
The below table depict about the cost of debt of the company:
Calculation of cost of debt
Outstanding debt 6028000
interest rate 5%
Tax rate 0.3
Kd 0.0350
(Bloomberg, 2017)
The above table of cost of debt of Data#3 limited depict that the total cost of debt is
0.0350. According to it, company is required to pay 0.0350 to every debt holder of the
company (Appendix). The study of the debt valuation of the company express that the cost of
debt of the company is quite lower and the level of debt of the company is also lower. And
that is why the total cost of debt of the company is lower.
Share valuation:
For analyzing the value of shares of the company, annual reports and other financial
websites have been investigated. In this report, total equity of the firm has been investigated
firstly. Following table depict about the debt condition of the company:
Dividend Discount Model
Dividend
expected 0.000174085
Growth rate 17%
Price per share 1.69
cost of equity 16.5783%
(Yahoo finance, 2017)
Paraphrase This Document
Need a fresh take? Get an instant paraphrase of this document with our AI Paraphraser
Finance
5
According to the dividend discount model evaluation over the cost of equity of the
company, it has been found that the total cost of equity of the company is 16.5783% which
express that company is required to pay 16.57% of total profit to every share holder of the
company.
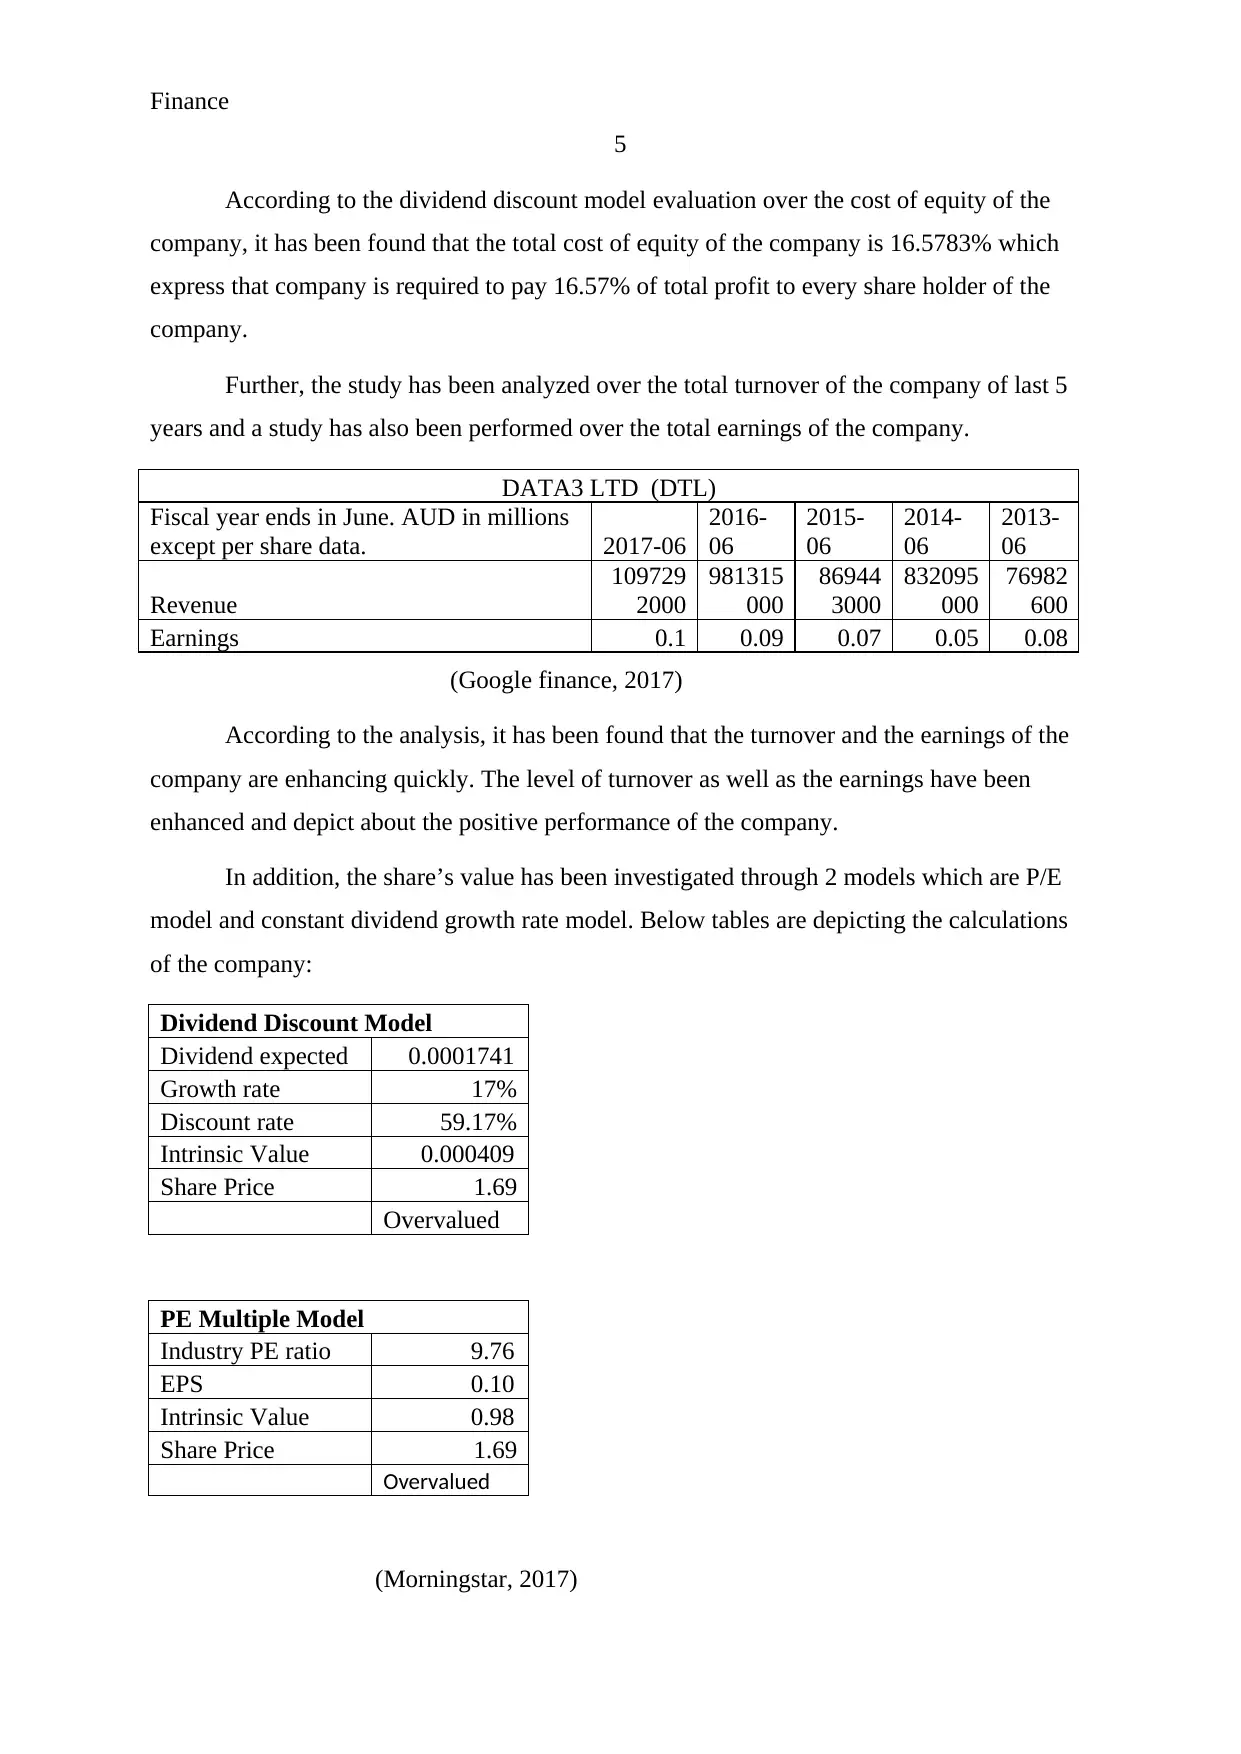
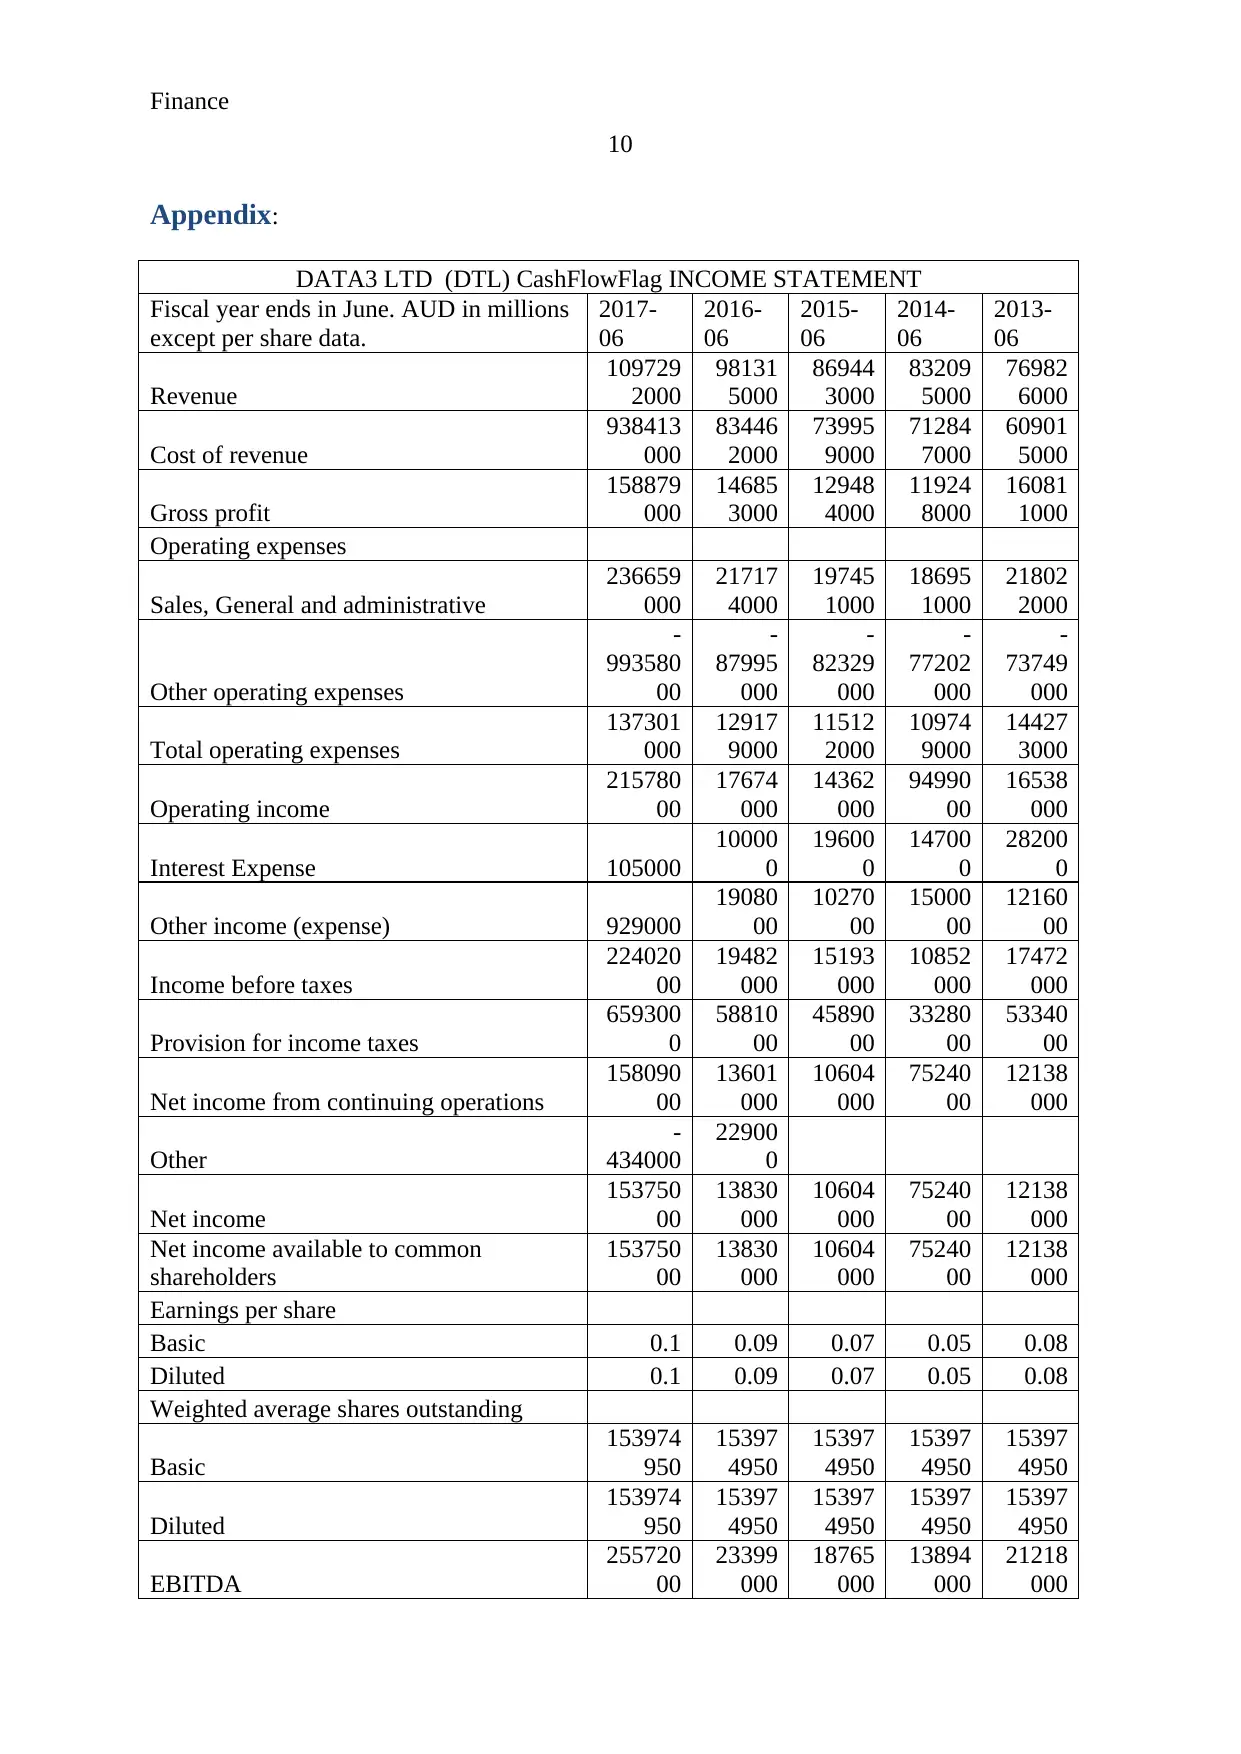
Further, the study has been analyzed over the total turnover of the company of last 5
years and a study has also been performed over the total earnings of the company.
DATA3 LTD (DTL)
Fiscal year ends in June. AUD in millions
except per share data. 2017-06
2016-
06
2015-
06
2014-
06
2013-
06
Revenue
109729
2000
981315
000
86944
3000
832095
000
76982
600
Earnings 0.1 0.09 0.07 0.05 0.08
(Google finance, 2017)
According to the analysis, it has been found that the turnover and the earnings of the
company are enhancing quickly. The level of turnover as well as the earnings have been
enhanced and depict about the positive performance of the company.
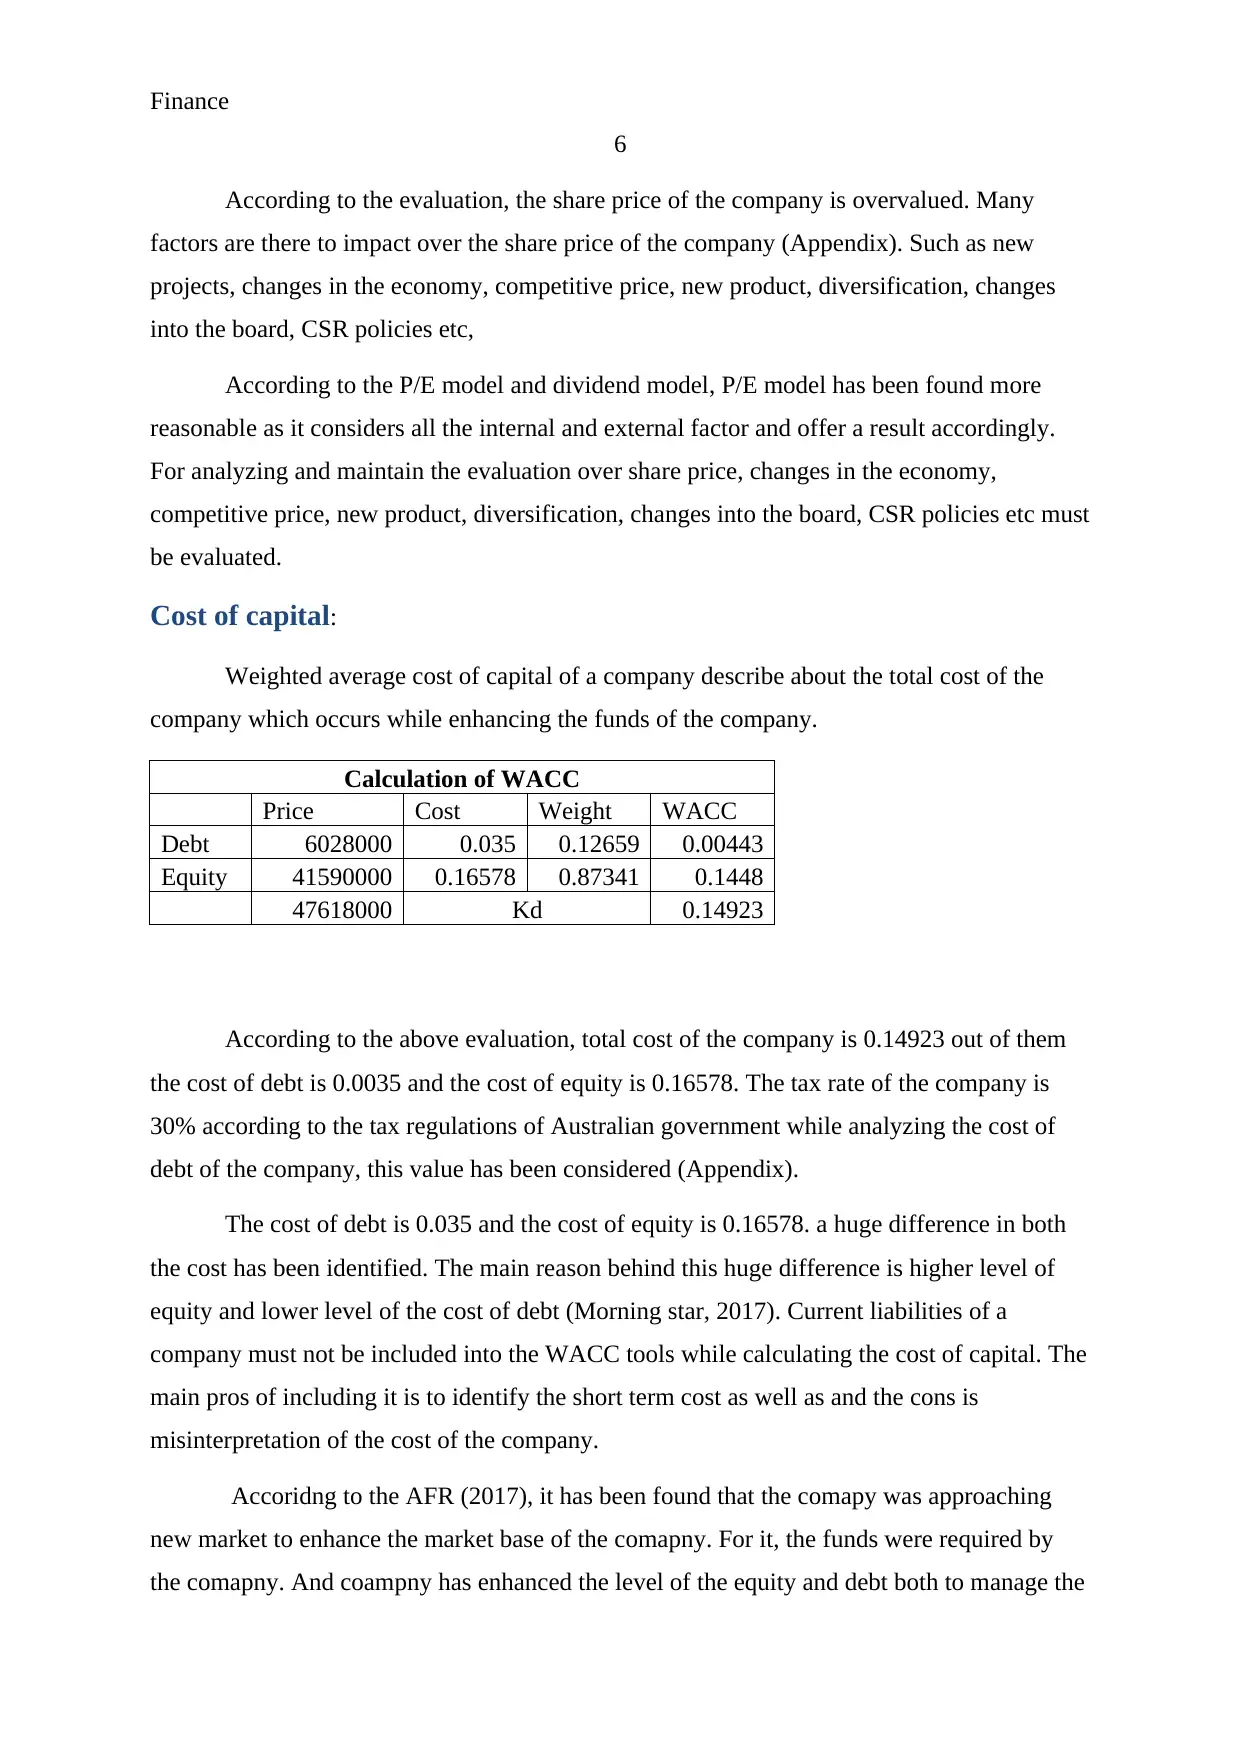
In addition, the share’s value has been investigated through 2 models which are P/E
model and constant dividend growth rate model. Below tables are depicting the calculations
of the company:
Dividend Discount Model
Dividend expected 0.0001741
Growth rate 17%
Discount rate 59.17%
Intrinsic Value 0.000409
Share Price 1.69
Overvalued
PE Multiple Model
Industry PE ratio 9.76
EPS 0.10
Intrinsic Value 0.98
Share Price 1.69
Overvalued
(Morningstar, 2017)
5
According to the dividend discount model evaluation over the cost of equity of the
company, it has been found that the total cost of equity of the company is 16.5783% which
express that company is required to pay 16.57% of total profit to every share holder of the
company.
Further, the study has been analyzed over the total turnover of the company of last 5
years and a study has also been performed over the total earnings of the company.
DATA3 LTD (DTL)
Fiscal year ends in June. AUD in millions
except per share data. 2017-06
2016-
06
2015-
06
2014-
06
2013-
06
Revenue
109729
2000
981315
000
86944
3000
832095
000
76982
600
Earnings 0.1 0.09 0.07 0.05 0.08
(Google finance, 2017)
According to the analysis, it has been found that the turnover and the earnings of the
company are enhancing quickly. The level of turnover as well as the earnings have been
enhanced and depict about the positive performance of the company.
In addition, the share’s value has been investigated through 2 models which are P/E
model and constant dividend growth rate model. Below tables are depicting the calculations
of the company:
Dividend Discount Model
Dividend expected 0.0001741
Growth rate 17%
Discount rate 59.17%
Intrinsic Value 0.000409
Share Price 1.69
Overvalued
PE Multiple Model
Industry PE ratio 9.76
EPS 0.10
Intrinsic Value 0.98
Share Price 1.69
Overvalued
(Morningstar, 2017)
Finance
6
According to the evaluation, the share price of the company is overvalued. Many
factors are there to impact over the share price of the company (Appendix). Such as new
projects, changes in the economy, competitive price, new product, diversification, changes
into the board, CSR policies etc,
According to the P/E model and dividend model, P/E model has been found more
reasonable as it considers all the internal and external factor and offer a result accordingly.
For analyzing and maintain the evaluation over share price, changes in the economy,
competitive price, new product, diversification, changes into the board, CSR policies etc must
be evaluated.
Cost of capital:
Weighted average cost of capital of a company describe about the total cost of the
company which occurs while enhancing the funds of the company.
Calculation of WACC
Price Cost Weight WACC
Debt 6028000 0.035 0.12659 0.00443
Equity 41590000 0.16578 0.87341 0.1448
47618000 Kd 0.14923
According to the above evaluation, total cost of the company is 0.14923 out of them
the cost of debt is 0.0035 and the cost of equity is 0.16578. The tax rate of the company is
30% according to the tax regulations of Australian government while analyzing the cost of
debt of the company, this value has been considered (Appendix).
The cost of debt is 0.035 and the cost of equity is 0.16578. a huge difference in both
the cost has been identified. The main reason behind this huge difference is higher level of
equity and lower level of the cost of debt (Morning star, 2017). Current liabilities of a
company must not be included into the WACC tools while calculating the cost of capital. The
main pros of including it is to identify the short term cost as well as and the cons is
misinterpretation of the cost of the company.
Accoridng to the AFR (2017), it has been found that the comapy was approaching
new market to enhance the market base of the comapny. For it, the funds were required by
the comapny. And coampny has enhanced the level of the equity and debt both to manage the
⊘ This is a preview!⊘
Do you want full access?
Subscribe today to unlock all pages.
Trusted by 1+ million students worldwide
Finance
7
industry standard and the cost of the comapny (Appendix). At the same time, new technology
has also been adopted by the comapny and for that, debt level has been enahnced.
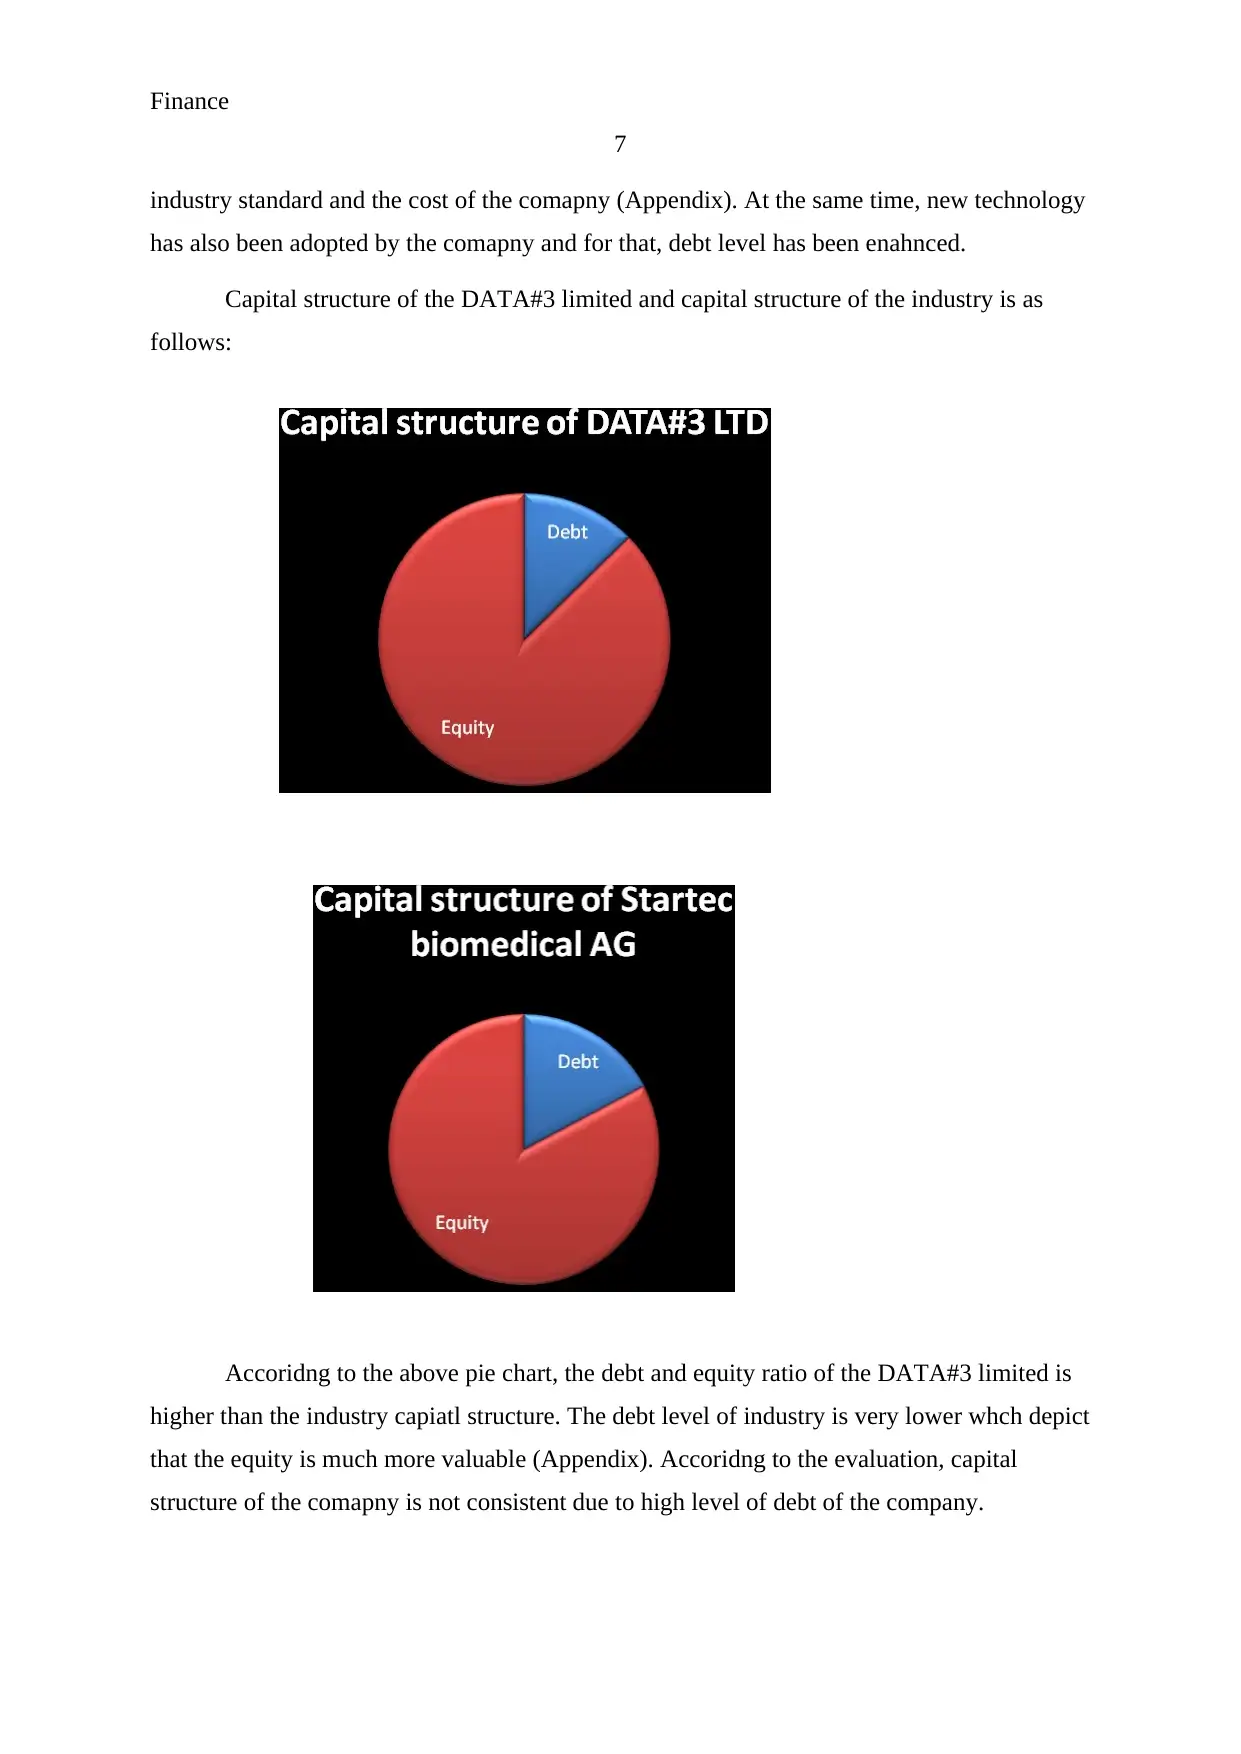
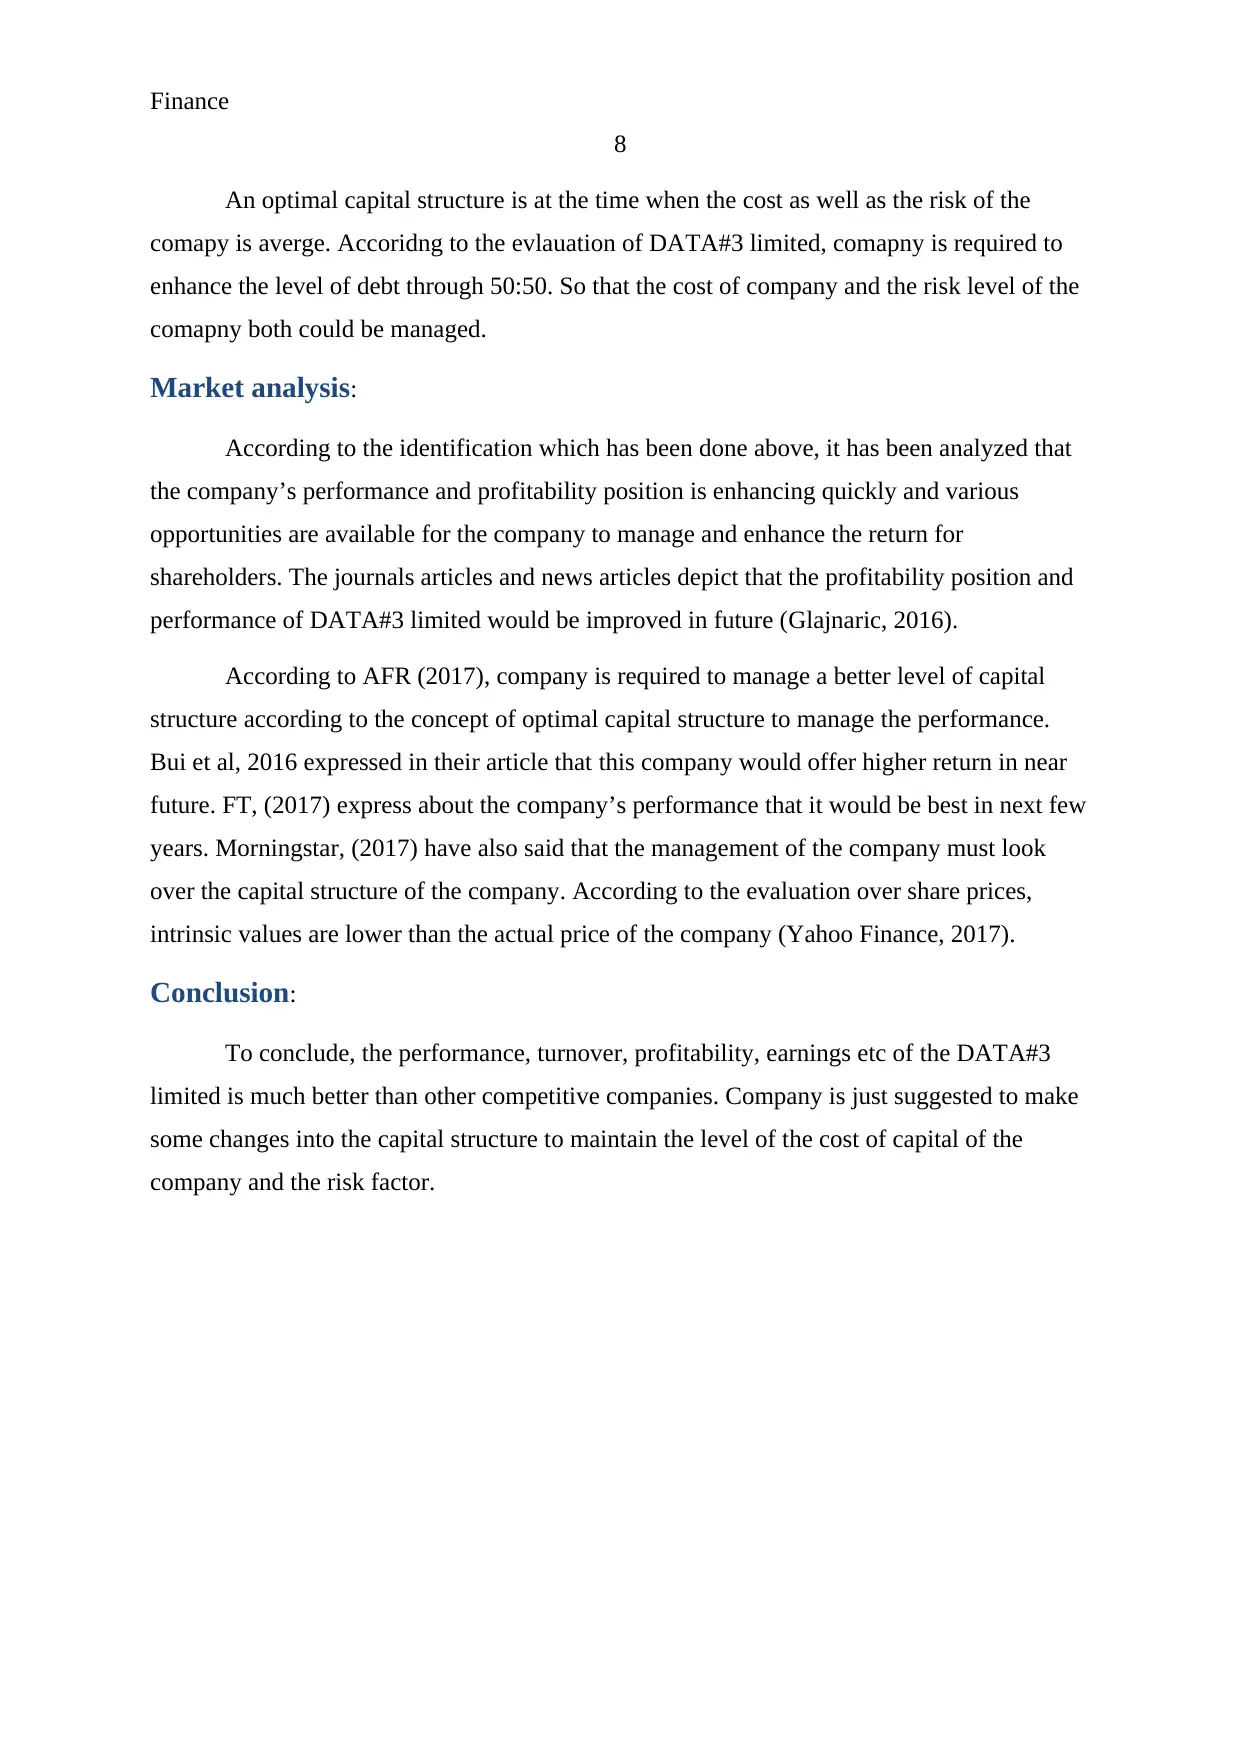
Capital structure of the DATA#3 limited and capital structure of the industry is as
follows:
Accoridng to the above pie chart, the debt and equity ratio of the DATA#3 limited is
higher than the industry capiatl structure. The debt level of industry is very lower whch depict
that the equity is much more valuable (Appendix). Accoridng to the evaluation, capital
structure of the comapny is not consistent due to high level of debt of the company.
7
industry standard and the cost of the comapny (Appendix). At the same time, new technology
has also been adopted by the comapny and for that, debt level has been enahnced.
Capital structure of the DATA#3 limited and capital structure of the industry is as
follows:
Accoridng to the above pie chart, the debt and equity ratio of the DATA#3 limited is
higher than the industry capiatl structure. The debt level of industry is very lower whch depict
that the equity is much more valuable (Appendix). Accoridng to the evaluation, capital
structure of the comapny is not consistent due to high level of debt of the company.
Paraphrase This Document
Need a fresh take? Get an instant paraphrase of this document with our AI Paraphraser
Finance
8
An optimal capital structure is at the time when the cost as well as the risk of the
comapy is averge. Accoridng to the evlauation of DATA#3 limited, comapny is required to
enhance the level of debt through 50:50. So that the cost of company and the risk level of the
comapny both could be managed.
Market analysis:
According to the identification which has been done above, it has been analyzed that
the company’s performance and profitability position is enhancing quickly and various
opportunities are available for the company to manage and enhance the return for
shareholders. The journals articles and news articles depict that the profitability position and
performance of DATA#3 limited would be improved in future (Glajnaric, 2016).
According to AFR (2017), company is required to manage a better level of capital
structure according to the concept of optimal capital structure to manage the performance.
Bui et al, 2016 expressed in their article that this company would offer higher return in near
future. FT, (2017) express about the company’s performance that it would be best in next few
years. Morningstar, (2017) have also said that the management of the company must look
over the capital structure of the company. According to the evaluation over share prices,
intrinsic values are lower than the actual price of the company (Yahoo Finance, 2017).
Conclusion:
To conclude, the performance, turnover, profitability, earnings etc of the DATA#3
limited is much better than other competitive companies. Company is just suggested to make
some changes into the capital structure to maintain the level of the cost of capital of the
company and the risk factor.
Finance
9
References:
AFR. 2017. Data 3 LTD. Retrieved from http://www.afr.com/research-tools/DTL/company-
profile/operational-history available on 7th Oct 2017.
Bloomberg. 2017. Data 3 LTD. Retrieved from https://www.bloomberg.com/quote/DTL:AU
available on 3rd Oct 2017.
Glajnaric, M., 2016. The importance of dividend paying stocks. Equity, 30(2), p.6.
Google finance. 2017. Data#3 LTD. Retrieved from http://finance.google.com/finance?
q=ASX:DTL available on 7th Oct 2017.
Home. 2017. DTL#3 limited. Retrieved from http://www.data3.com/ available on 7th Oct
2017.
Morningstar. 2017. Data#3 LTD. Reterived from http://financials.morningstar.com/cash-
flow/cf.html?t=DTL®ion=aus&culture=en-US available on 7th Oct 2017.
Morningstar. 2017. STARTEC Biomedical AG. Retrieved from
http://financials.morningstar.com/balance-sheet/bs.html?t=SBMAF®ion=usa&culture=en-
US available on 7th Oct 2017.
FT. 2017. Data#3 limited. Retrieved from
https://markets.ft.com/data/equities/tearsheet/historical?s=DTL:ASX available on 3rd Oct
2017.
⊘ This is a preview!⊘
Do you want full access?
Subscribe today to unlock all pages.
Trusted by 1+ million students worldwide
Finance
10
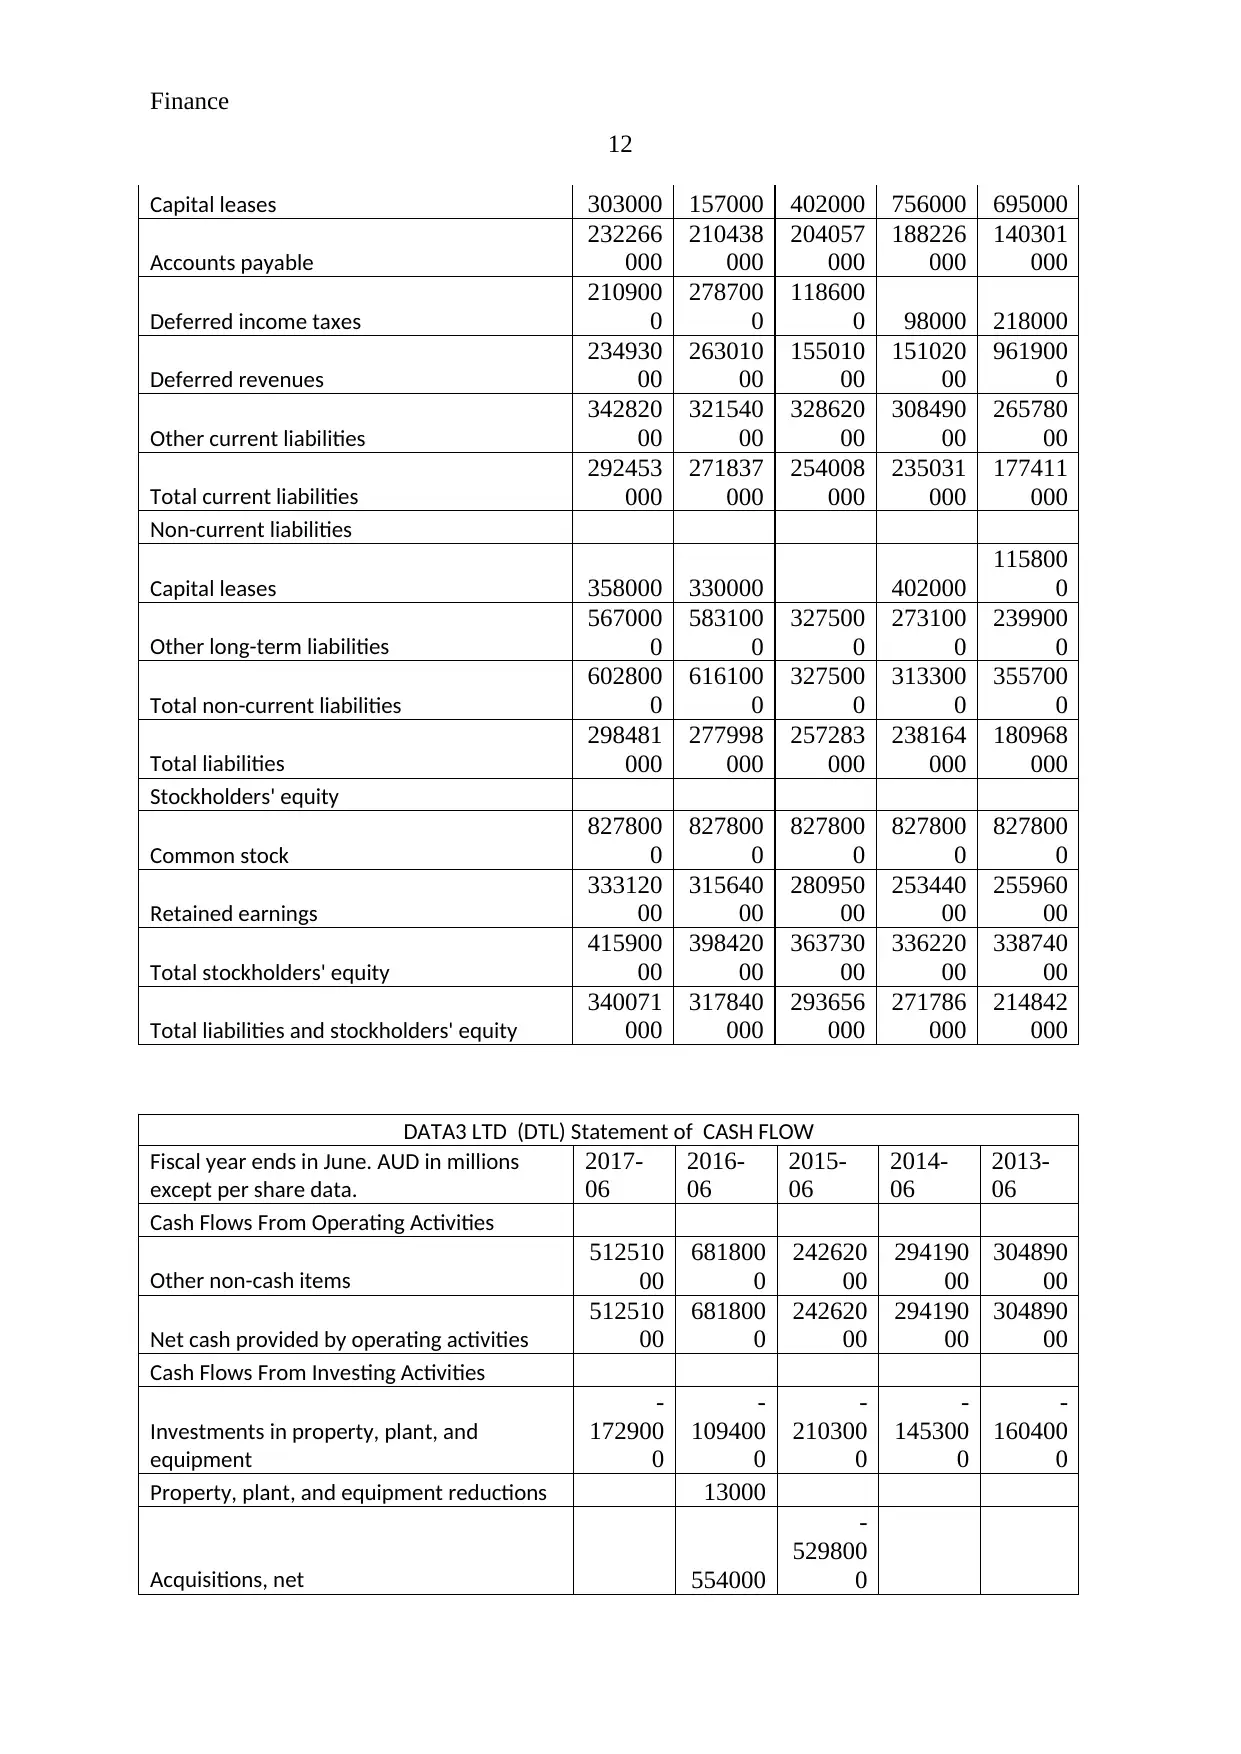
Appendix:
DATA3 LTD (DTL) CashFlowFlag INCOME STATEMENT
Fiscal year ends in June. AUD in millions
except per share data.
2017-
06
2016-
06
2015-
06
2014-
06
2013-
06
Revenue
109729
2000
98131
5000
86944
3000
83209
5000
76982
6000
Cost of revenue
938413
000
83446
2000
73995
9000
71284
7000
60901
5000
Gross profit
158879
000
14685
3000
12948
4000
11924
8000
16081
1000
Operating expenses
Sales, General and administrative
236659
000
21717
4000
19745
1000
18695
1000
21802
2000
Other operating expenses
-
993580
00
-
87995
000
-
82329
000
-
77202
000
-
73749
000
Total operating expenses
137301
000
12917
9000
11512
2000
10974
9000
14427
3000
Operating income
215780
00
17674
000
14362
000
94990
00
16538
000
Interest Expense 105000
10000
0
19600
0
14700
0
28200
0
Other income (expense) 929000
19080
00
10270
00
15000
00
12160
00
Income before taxes
224020
00
19482
000
15193
000
10852
000
17472
000
Provision for income taxes
659300
0
58810
00
45890
00
33280
00
53340
00
Net income from continuing operations
158090
00
13601
000
10604
000
75240
00
12138
000
Other
-
434000
22900
0
Net income
153750
00
13830
000
10604
000
75240
00
12138
000
Net income available to common
shareholders
153750
00
13830
000
10604
000
75240
00
12138
000
Earnings per share
Basic 0.1 0.09 0.07 0.05 0.08
Diluted 0.1 0.09 0.07 0.05 0.08
Weighted average shares outstanding
Basic
153974
950
15397
4950
15397
4950
15397
4950
15397
4950
Diluted
153974
950
15397
4950
15397
4950
15397
4950
15397
4950
EBITDA
255720
00
23399
000
18765
000
13894
000
21218
000
10
Appendix:
DATA3 LTD (DTL) CashFlowFlag INCOME STATEMENT
Fiscal year ends in June. AUD in millions
except per share data.
2017-
06
2016-
06
2015-
06
2014-
06
2013-
06
Revenue
109729
2000
98131
5000
86944
3000
83209
5000
76982
6000
Cost of revenue
938413
000
83446
2000
73995
9000
71284
7000
60901
5000
Gross profit
158879
000
14685
3000
12948
4000
11924
8000
16081
1000
Operating expenses
Sales, General and administrative
236659
000
21717
4000
19745
1000
18695
1000
21802
2000
Other operating expenses
-
993580
00
-
87995
000
-
82329
000
-
77202
000
-
73749
000
Total operating expenses
137301
000
12917
9000
11512
2000
10974
9000
14427
3000
Operating income
215780
00
17674
000
14362
000
94990
00
16538
000
Interest Expense 105000
10000
0
19600
0
14700
0
28200
0
Other income (expense) 929000
19080
00
10270
00
15000
00
12160
00
Income before taxes
224020
00
19482
000
15193
000
10852
000
17472
000
Provision for income taxes
659300
0
58810
00
45890
00
33280
00
53340
00
Net income from continuing operations
158090
00
13601
000
10604
000
75240
00
12138
000
Other
-
434000
22900
0
Net income
153750
00
13830
000
10604
000
75240
00
12138
000
Net income available to common
shareholders
153750
00
13830
000
10604
000
75240
00
12138
000
Earnings per share
Basic 0.1 0.09 0.07 0.05 0.08
Diluted 0.1 0.09 0.07 0.05 0.08
Weighted average shares outstanding
Basic
153974
950
15397
4950
15397
4950
15397
4950
15397
4950
Diluted
153974
950
15397
4950
15397
4950
15397
4950
15397
4950
EBITDA
255720
00
23399
000
18765
000
13894
000
21218
000
Paraphrase This Document
Need a fresh take? Get an instant paraphrase of this document with our AI Paraphraser
Finance
11
DATA3 LTD (DTL) CashFlowFlag BALANCE SHEET
Fiscal year ends in June. AUD in millions
except per share data.
2017-
06
2016-
06
2015-
06
2014-
06
2013-
06
Assets
Current assets
Cash
Cash and cash equivalents
135695
000
102279
000
108966
000
103427
000
853220
00
Total cash
135695
000
102279
000
108966
000
103427
000
853220
00
Receivables
168495
000
170684
000
153667
000
146936
000
108084
000
Inventories
448000
0
125710
00
391500
0
252600
0
323200
0
Prepaid expenses
497800
0
461300
0
289600
0
310500
0
250900
0
Other current assets 126000 127000 101000 88000 94000
Total current assets
313774
000
290274
000
269545
000
256082
000
199241
000
Non-current assets
Property, plant and equipment
Gross property, plant and equipment
847800
0
140430
00
129250
00
106930
00
926300
0
Accumulated Depreciation
-
229100
0
-
772300
0
-
646700
0
-
467200
0
-
301400
0
Net property, plant and equipment
618700
0
632000
0
645800
0
602100
0
624900
0
Equity and other investments
305700
0
Goodwill
112560
00
112560
00
922400
0
433200
0
433200
0
Intangible assets
546200
0
454200
0
304000
0
300900
0
283400
0
Deferred income taxes
293800
0
255300
0
233200
0
234200
0
218600
0
Other long-term assets 454000
289500
0
Total non-current assets
262970
00
275660
00
241110
00
157040
00
156010
00
Total assets
340071
000
317840
000
293656
000
271786
000
214842
000
Liabilities and stockholders' equity
Liabilities
Current liabilities
Finance
12
Capital leases 303000 157000 402000 756000 695000
Accounts payable
232266
000
210438
000
204057
000
188226
000
140301
000
Deferred income taxes
210900
0
278700
0
118600
0 98000 218000
Deferred revenues
234930
00
263010
00
155010
00
151020
00
961900
0
Other current liabilities
342820
00
321540
00
328620
00
308490
00
265780
00
Total current liabilities
292453
000
271837
000
254008
000
235031
000
177411
000
Non-current liabilities
Capital leases 358000 330000 402000
115800
0
Other long-term liabilities
567000
0
583100
0
327500
0
273100
0
239900
0
Total non-current liabilities
602800
0
616100
0
327500
0
313300
0
355700
0
Total liabilities
298481
000
277998
000
257283
000
238164
000
180968
000
Stockholders' equity
Common stock
827800
0
827800
0
827800
0
827800
0
827800
0
Retained earnings
333120
00
315640
00
280950
00
253440
00
255960
00
Total stockholders' equity
415900
00
398420
00
363730
00
336220
00
338740
00
Total liabilities and stockholders' equity
340071
000
317840
000
293656
000
271786
000
214842
000
DATA3 LTD (DTL) Statement of CASH FLOW
Fiscal year ends in June. AUD in millions
except per share data.
2017-
06
2016-
06
2015-
06
2014-
06
2013-
06
Cash Flows From Operating Activities
Other non-cash items
512510
00
681800
0
242620
00
294190
00
304890
00
Net cash provided by operating activities
512510
00
681800
0
242620
00
294190
00
304890
00
Cash Flows From Investing Activities
Investments in property, plant, and
equipment
-
172900
0
-
109400
0
-
210300
0
-
145300
0
-
160400
0
Property, plant, and equipment reductions 13000
Acquisitions, net 554000
-
529800
0
⊘ This is a preview!⊘
Do you want full access?
Subscribe today to unlock all pages.
Trusted by 1+ million students worldwide
1 out of 15
Related Documents


Your All-in-One AI-Powered Toolkit for Academic Success.
+13062052269
info@desklib.com
Available 24*7 on WhatsApp / Email
![[object Object]](/_next/static/media/star-bottom.7253800d.svg)
Unlock your academic potential
Copyright © 2020–2026 A2Z Services. All Rights Reserved. Developed and managed by ZUCOL.