FINM036 - DBS Bank: Financial Performance and Analysis Report

Verified

Added on  2023/04/25

|39
|6458
|102
Report
AI Summary
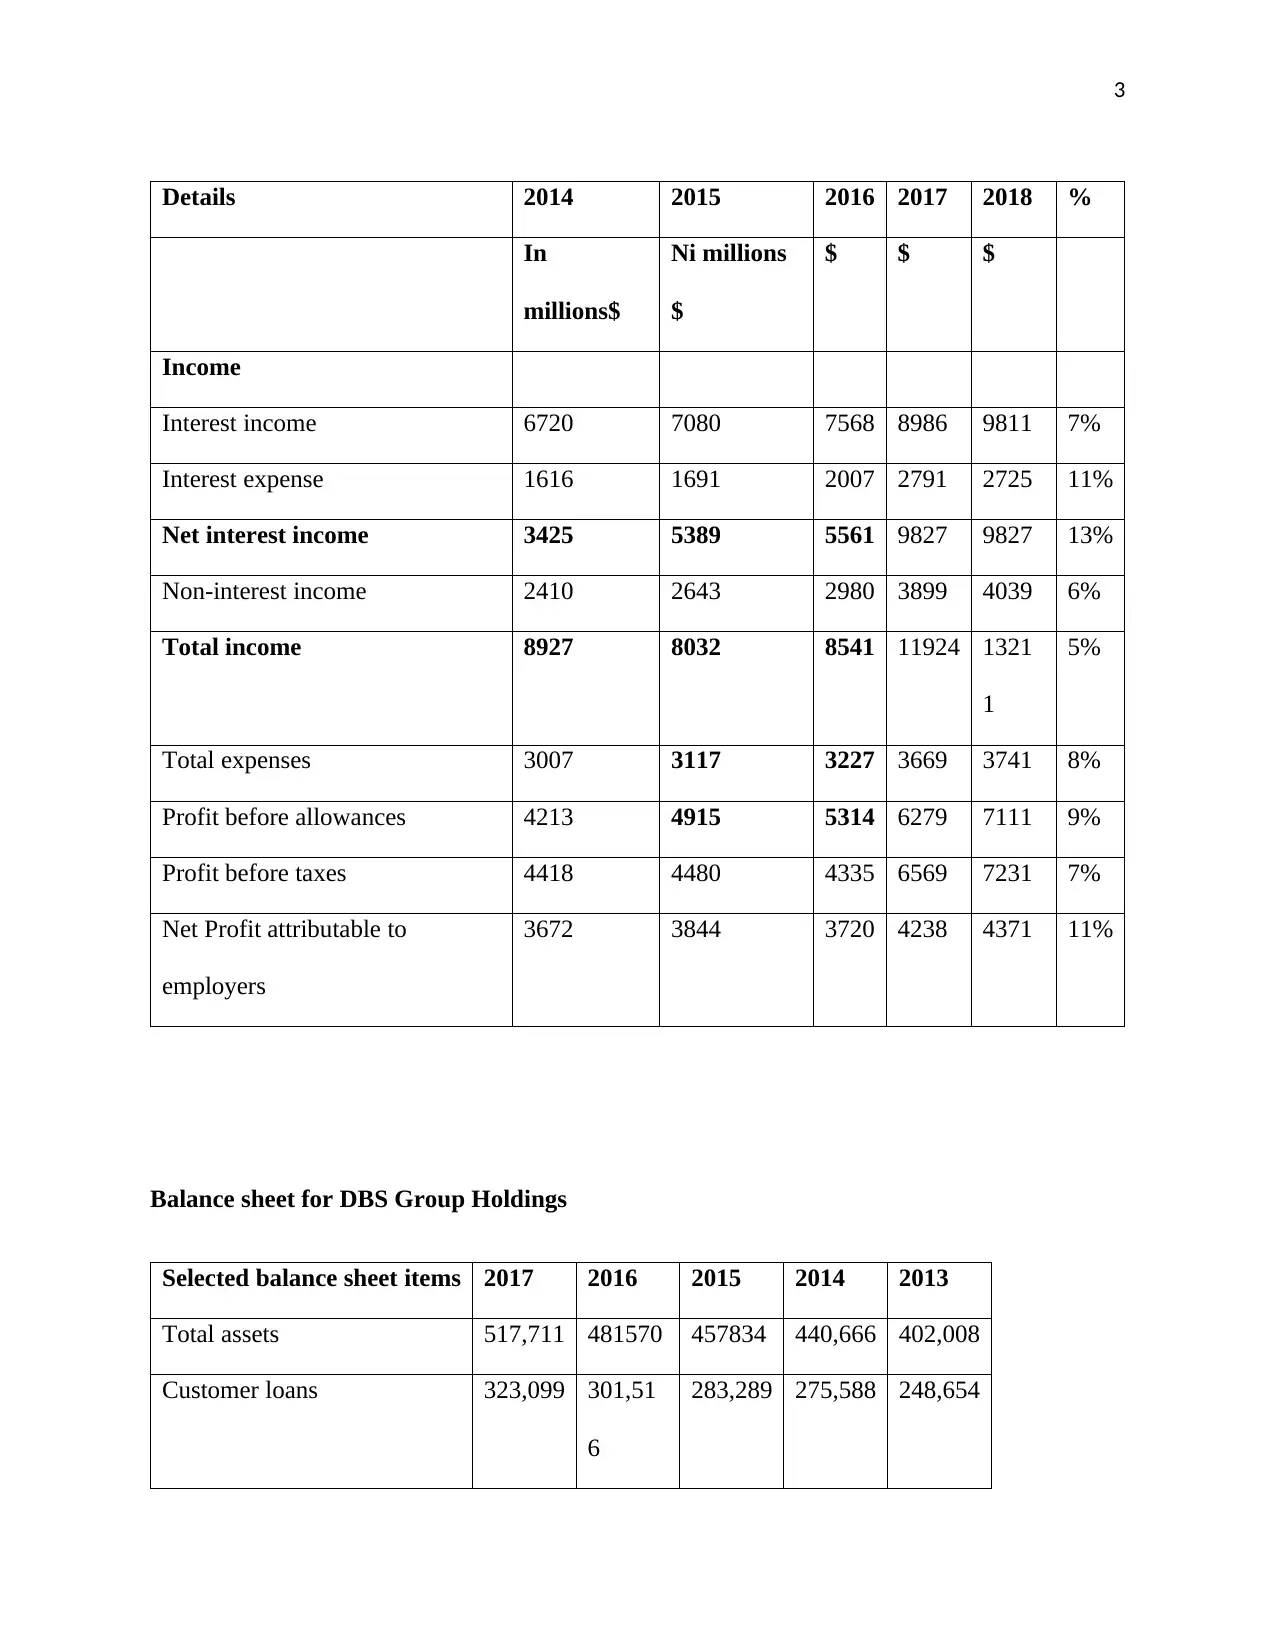
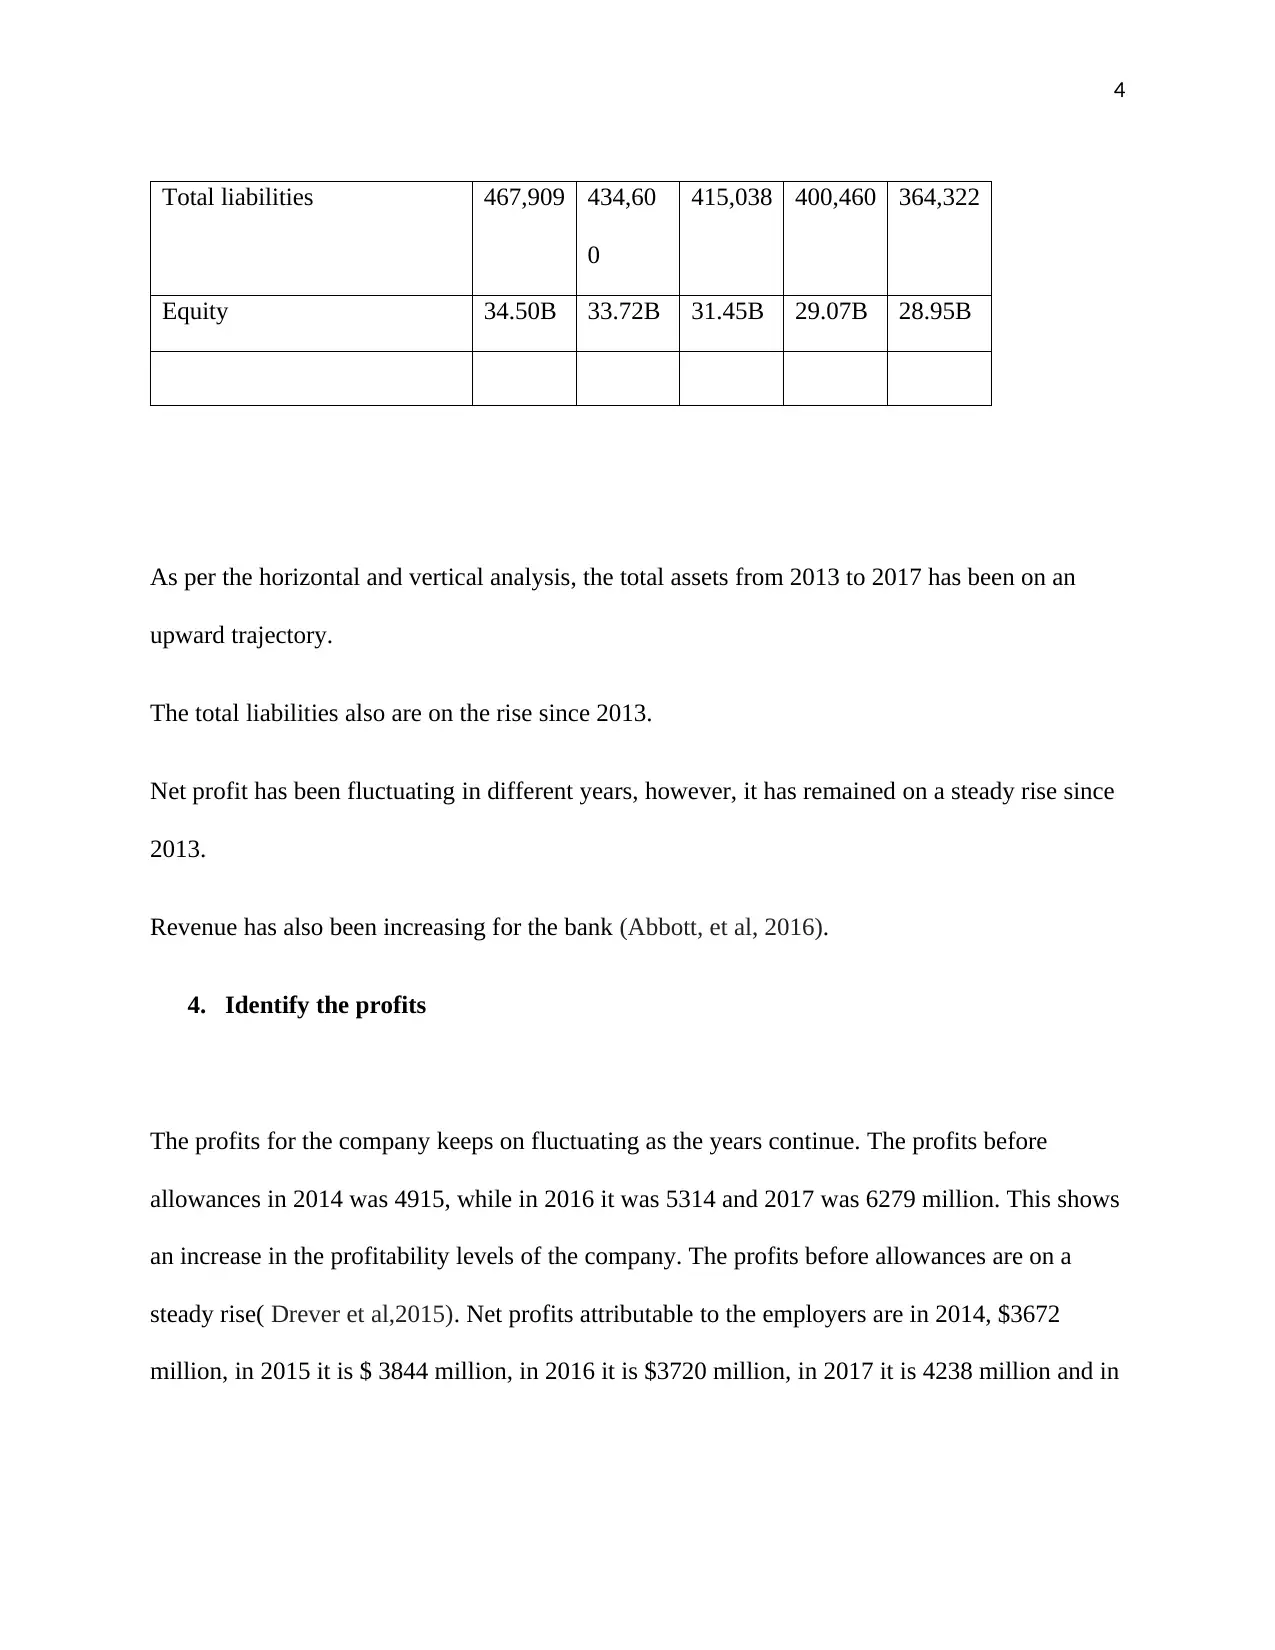
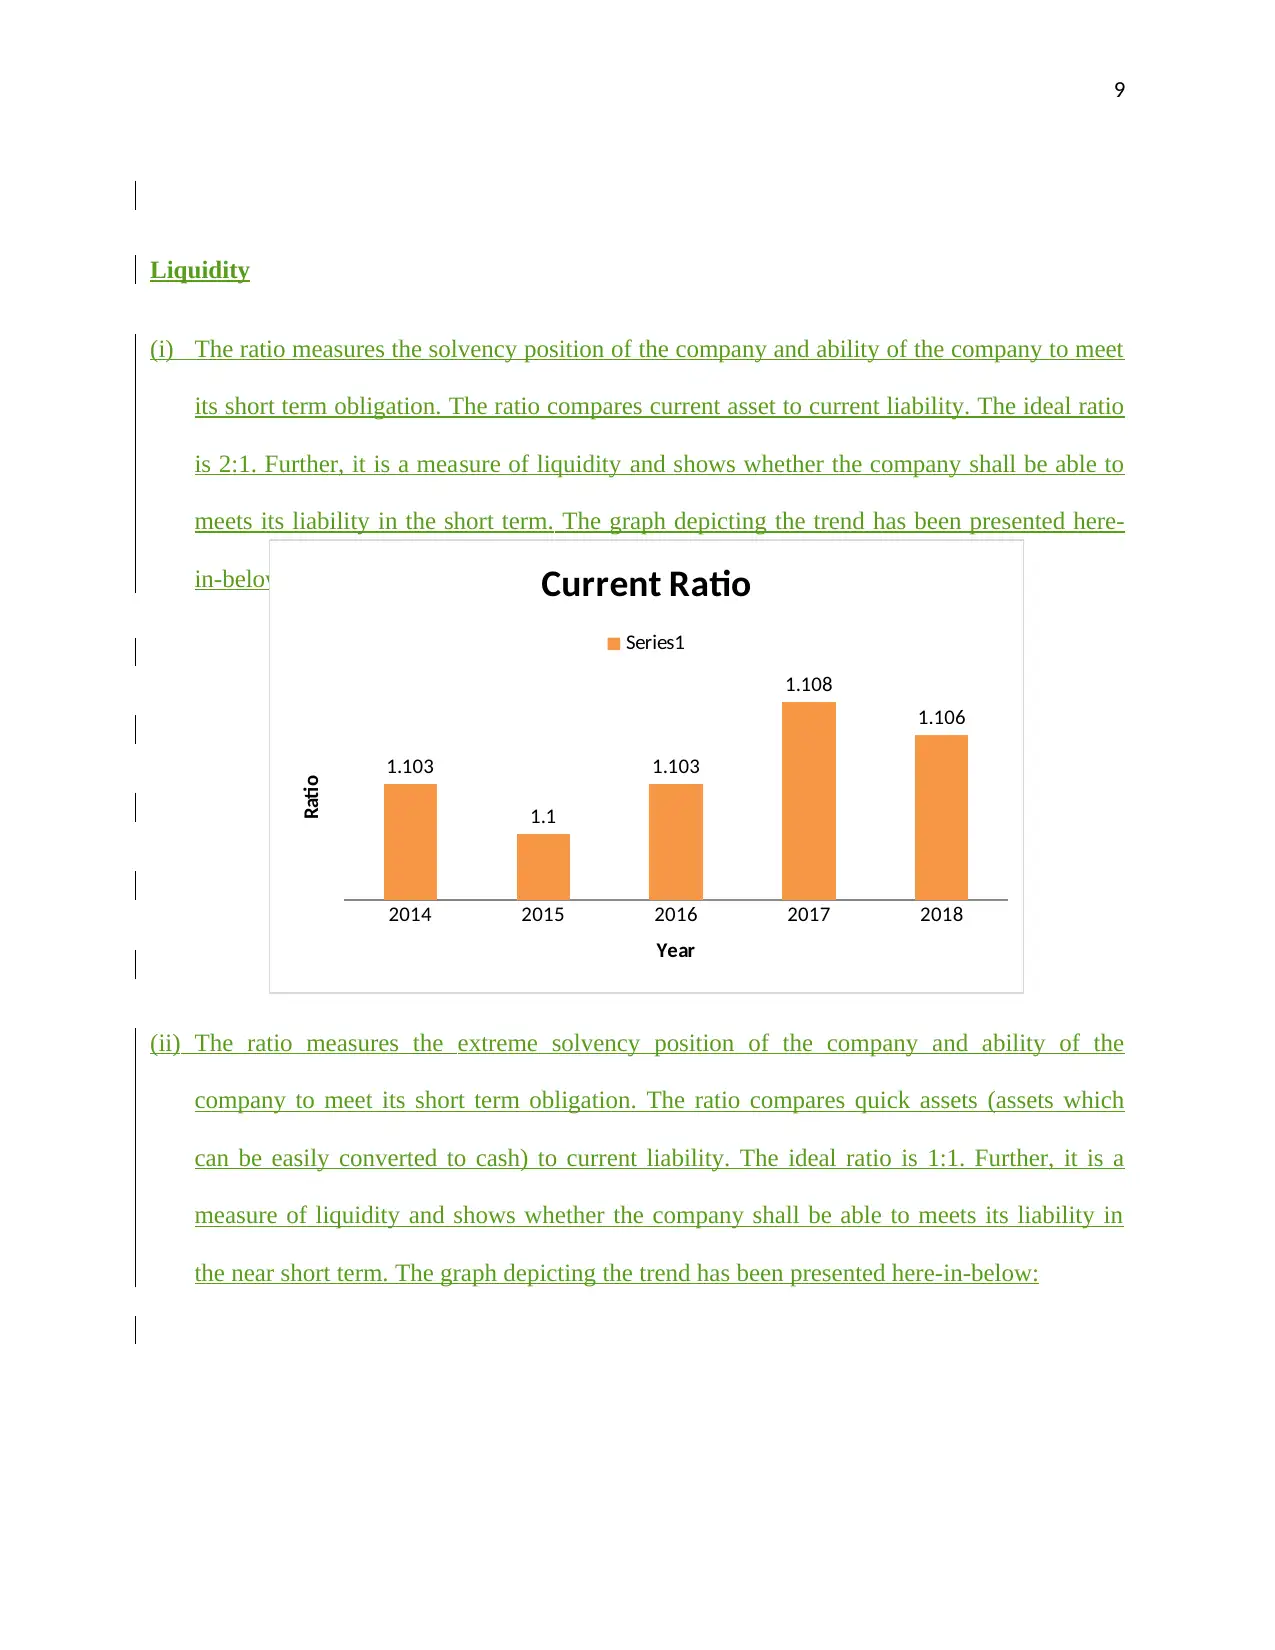
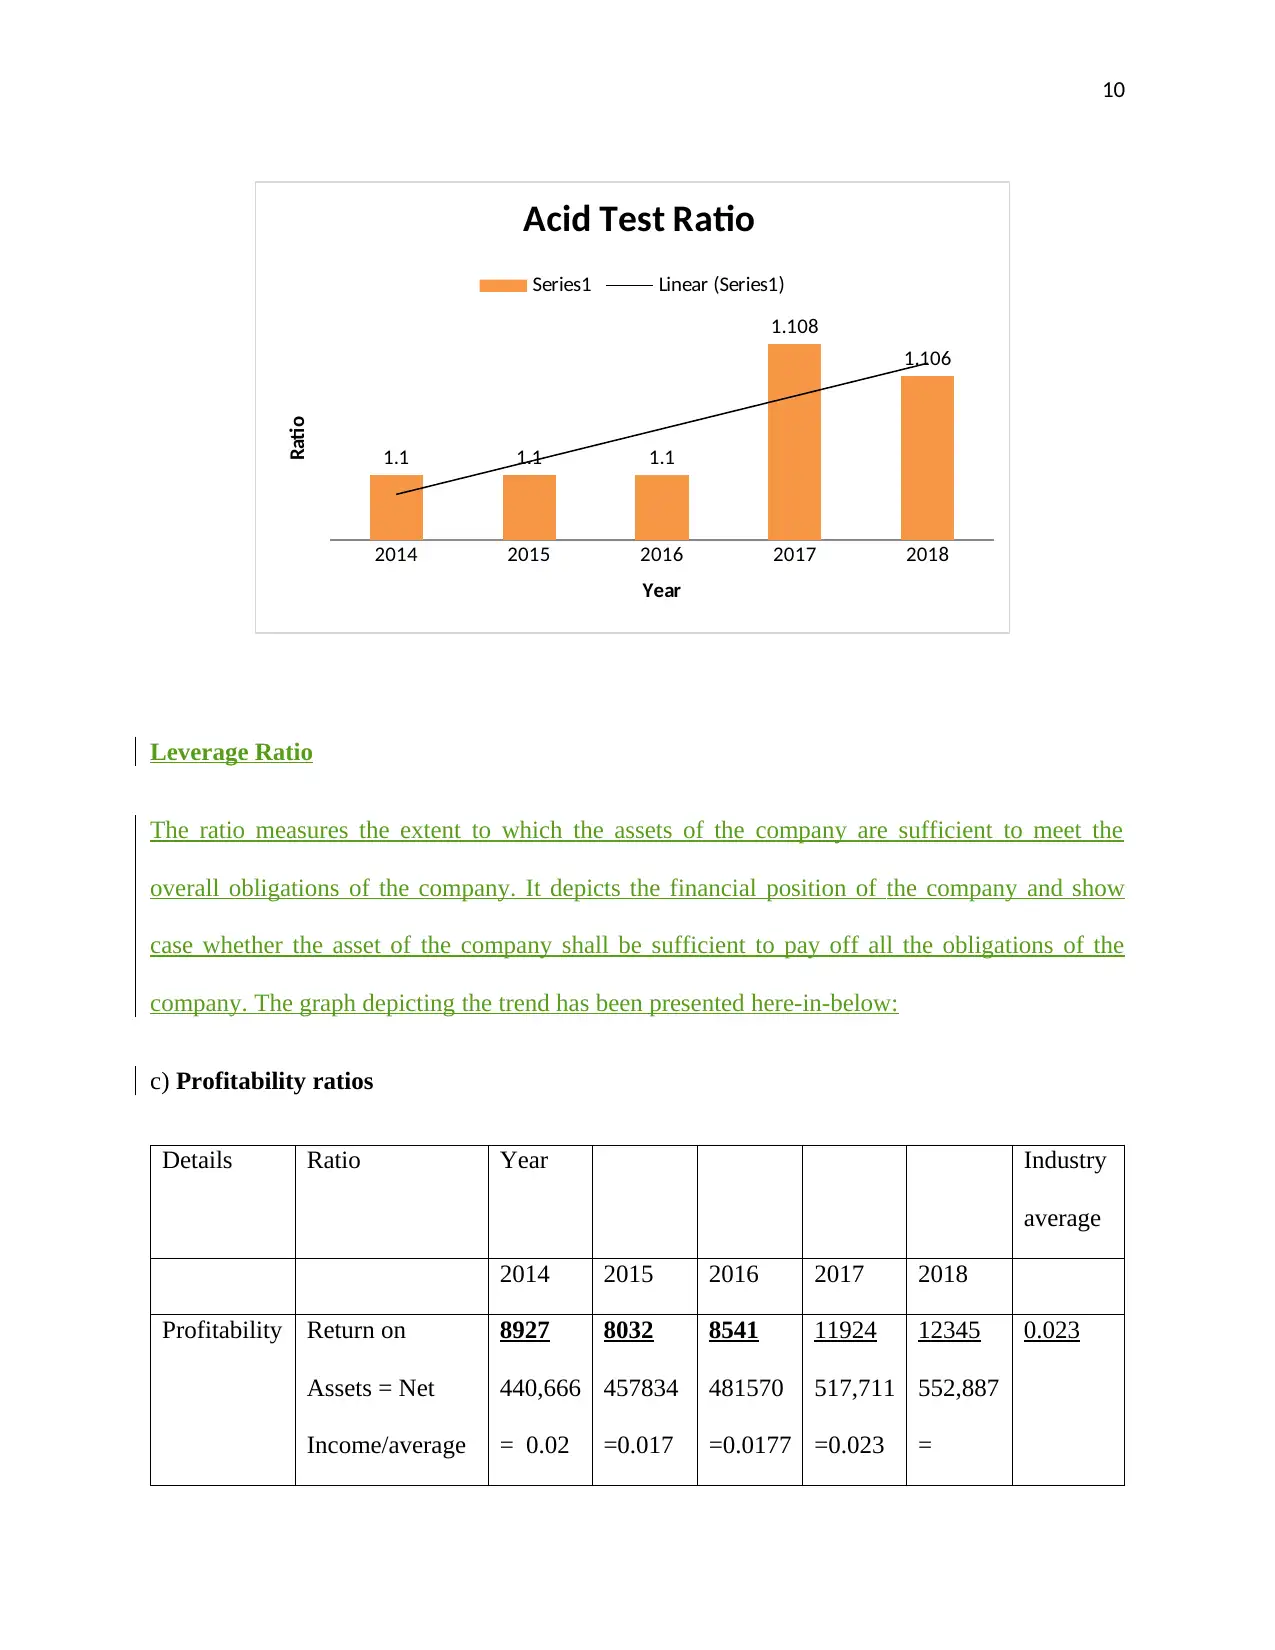
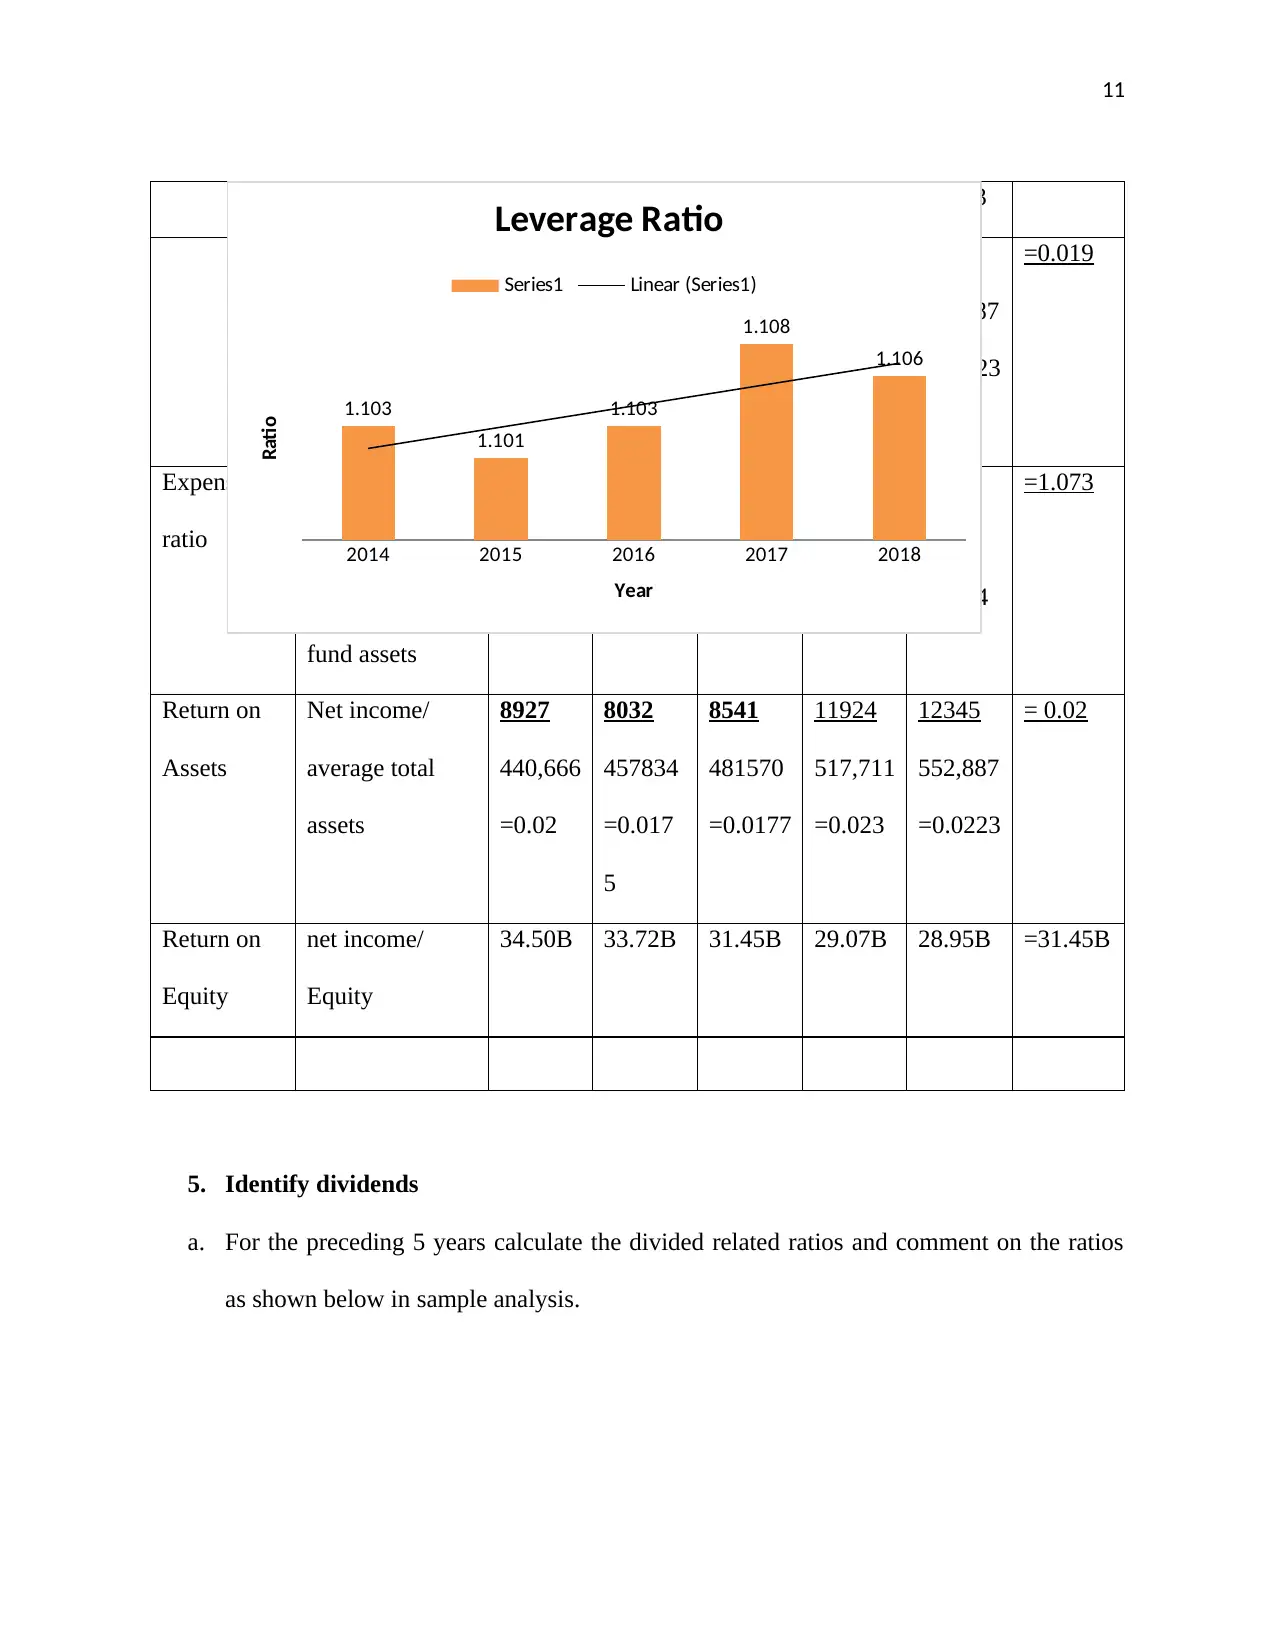
This report provides a thorough financial analysis of DBS Group Holdings Ltd. (DBS Bank), a prominent financial services provider in Singapore. The analysis encompasses horizontal and vertical analysis of the company's profit and loss statements and balance sheets from 2014 to 2018, identifying key trends in interest income, expenses, and net profits. The report examines the economic conditions of the financial sector in Singapore and calculates various financial ratios, including profitability, liquidity, and leverage ratios, to assess DBS Bank's performance. Furthermore, it delves into dividend-related ratios, such as dividend yield and payout ratios, providing insights into the company's dividend policies. The report also includes comments on the company's financial health, including profitability and liquidity, and compares certain ratios to industry averages, offering a comprehensive overview of DBS Bank's financial standing and performance over the specified period. The report is prepared for the board of directors as part of an interview process to assess the candidate's knowledge and understanding of key accounting and corporate finance concepts.
Document Page
1
Name:
Course
Professor’s name
University name
City, State
Date of submission
tabler-icon-diamond-filled.svg

Paraphrase This Document

Need a fresh take? Get an instant paraphrase of this document with our AI Paraphraser
Document Page
2
SECTION A
1. DBS GROUP HOLDINGS LTD
2. Company Background
DBS Bank is a financial services provider and a multi-national bank headquartered in Marina
Bay in Singapore. It was established in 1968 by the government of Singapore as a takeover bid
for the industrial financing of Economic Development Board. It was previously known as
Development Bank of Singapore Limited before the name was changed in 2003. This was
because it was changing its role as a regional bank. It has its activities mostly in South East Asia
with key people being Peter Seah Lim as the chairman of the Board and Piyush Gupta as the
chief Executive Officer (CEO). It is the largest bank in South East Asia by asset base with an
equivalent of $518 billion as at 31 Dec 2017. Its revenue in 2016 was a rise to $ 10.28 billion.
The operating income in 2016 was $ 6.517 billion and this was a marginal increase of $470
million from the year 2015. The net income dropped in 2016 to $ 3.07 billion. The number of
employees by 2017 was at 24,174 which is among the biggest taskforce in financial and banking
service providers in south East Asia. Some of the major competitors are Bank of Singapore,
United overseas bank and OCBC Bank (Bonsall et al, 2017).
3. Horizontal and Vertical analysis of DBS bank
Horizontal analysis – Profit and Loss for 2014-2018
Horizontal analysis for profit and loss for 5 years beginning in 2014 to 2018.
Document Page
3
Details 2014 2015 2016 2017 2018 %
In
millions$
Ni millions
$
$ $ $
Income
Interest income 6720 7080 7568 8986 9811 7%
Interest expense 1616 1691 2007 2791 2725 11%
Net interest income 3425 5389 5561 9827 9827 13%
Non-interest income 2410 2643 2980 3899 4039 6%
Total income 8927 8032 8541 11924 1321
1
5%
Total expenses 3007 3117 3227 3669 3741 8%
Profit before allowances 4213 4915 5314 6279 7111 9%
Profit before taxes 4418 4480 4335 6569 7231 7%
Net Profit attributable to
employers
3672 3844 3720 4238 4371 11%
Balance sheet for DBS Group Holdings
Selected balance sheet items 2017 2016 2015 2014 2013
Total assets 517,711 481570 457834 440,666 402,008
Customer loans 323,099 301,51
6
283,289 275,588 248,654
Document Page
4
Total liabilities 467,909 434,60
0
415,038 400,460 364,322
Equity 34.50B 33.72B 31.45B 29.07B 28.95B
As per the horizontal and vertical analysis, the total assets from 2013 to 2017 has been on an
upward trajectory.
The total liabilities also are on the rise since 2013.
Net profit has been fluctuating in different years, however, it has remained on a steady rise since
2013.
Revenue has also been increasing for the bank (Abbott, et al, 2016).
4. Identify the profits
The profits for the company keeps on fluctuating as the years continue. The profits before
allowances in 2014 was 4915, while in 2016 it was 5314 and 2017 was 6279 million. This shows
an increase in the profitability levels of the company. The profits before allowances are on a
steady rise( Drever et al,2015). Net profits attributable to the employers are in 2014, $3672
million, in 2015 it is $ 3844 million, in 2016 it is $3720 million, in 2017 it is 4238 million and in
tabler-icon-diamond-filled.svg

Paraphrase This Document

Need a fresh take? Get an instant paraphrase of this document with our AI Paraphraser
Document Page
5
2018 the profits are $4371 million. This is a good attribute to the company and is the best for the
investors (Acharya, and Ryan, 2016).
Net Profit
attributable
to
employers
3672 3844 3720 4238 4371
Profit
before
allowances
4321 4915 5314 6279 7655
a. Comment on the economic condition for the financial and banking sector in
Singapore
The economic condition for the financial and banking sector has been a good ride. Singapore has
seen a steady rise in its GDP buoyed by a number of sectors with leading being the banking and
financial industry. The financial and banking industry has seen a growth in loan uptake with
most banks recording an increase in profits for the five years from 2013-2018. Most of the banks
that have been listed in the stock market have witnessed a steady growth in the share price and
Document Page
6
capitalization value (Lapan, and Marcotte, 2015). It is important to note that the financial sector
plays a very important role in growth of the economy of Singapore acting as a facilitator and
mover of money.
b) Financial ratios for the 5 years
Details Ratio Year
2014 2015 2016 2017 2018
Profitability Return on
Assets = Net
Income/averag
e total assets
8927
440,666
= 0.0202
8032
457834
=0.0175
8541
481570
=0.0177
11924
517,711
=0.0230
12345
552,887
= 0.0223
Gross profit
rate=gross
profit/ net sales
4213
8927
=0.472
4915
8032
=0.611
5314
8541
=0.622
6279
11924
=0.5265
7111
12345
=0.576
Liquidity Current ratio=
current assets /
current
liabilities
402,008
364,322
= 1.103
440,666
400,460
=1.10
457834
415,038
=1.103
481570
434,600
=1.108
517,711
467,909
=1.106
Acid Test
Ratio= quick
assets / current
402,008
364,322
=1.1
440,666
400,460
=1.1
457834
415,038
=1.10
481570
434,600
=1.108
517,711
467,909
=1.106
Document Page
7
liabilities
Leverage
ratio
Debt ratio=
total liabilities /
total assets
402,008
364,322
=1.103
440,666
400,460
=1.101
457834
415,038
=1.103
481570
434,600
=1.108
517,711
467,909
=1.106
On perusal of the above, it can be inferred the following:
Profitability
(i) The profitability of the company has seen an uptrend. Further, the return on assets of the
company has seen an uptrend on year on year basis which is beneficial for the company. The
ratio symbolize that how well the company is utilizing its assets to generate revenue. The
graph depicting the trend has been presented here-in-below:
tabler-icon-diamond-filled.svg

Paraphrase This Document

Need a fresh take? Get an instant paraphrase of this document with our AI Paraphraser
Document Page
8
(ii) The profitability of the company has seen an uptrend. Further, the gross profit margin of the
company has seen an uptrend on year on year basis which is beneficial for the company. The
ratio symbolize that how well the company is maintain its direct cost. The higher the
margin, the better the company is taken care off. The graph depicting the trend has been
presented here-in-below:
2014 2015 2016 2017 2018
0.0202
0.0175 0.0177
0.023 0.0223
Return on Asset Ratio
Series1 Linear (Series1)
Year
%
2014 2015 2016 2017 2018
0.472
0.611 0.622
0.5265 0.576
Gross Profit Ratio
Series1 Linear (Series1)
Year
%
Document Page
9
Liquidity
(i) The ratio measures the solvency position of the company and ability of the company to meet
its short term obligation. The ratio compares current asset to current liability. The ideal ratio
is 2:1. Further, it is a measure of liquidity and shows whether the company shall be able to
meets its liability in the short term. The graph depicting the trend has been presented here-
in-below:
(ii) The ratio measures the extreme solvency position of the company and ability of the
company to meet its short term obligation. The ratio compares quick assets (assets which
can be easily converted to cash) to current liability. The ideal ratio is 1:1. Further, it is a
measure of liquidity and shows whether the company shall be able to meets its liability in
the near short term. The graph depicting the trend has been presented here-in-below:
2014 2015 2016 2017 2018
1.103
1.1
1.103
1.108
1.106
Current Ratio
Series1
Year
Ratio
Document Page
10
Leverage Ratio
The ratio measures the extent to which the assets of the company are sufficient to meet the
overall obligations of the company. It depicts the financial position of the company and show
case whether the asset of the company shall be sufficient to pay off all the obligations of the
company. The graph depicting the trend has been presented here-in-below:
c) Profitability ratios
Details Ratio Year Industry
average
2014 2015 2016 2017 2018
Profitability Return on
Assets = Net
Income/average
8927
440,666
= 0.02
8032
457834
=0.017
8541
481570
=0.0177
11924
517,711
=0.023
12345
552,887
=
0.023
2014 2015 2016 2017 2018
1.1 1.1 1.1
1.108
1.106
Acid Test Ratio
Series1 Linear (Series1)
Year
Ratio
tabler-icon-diamond-filled.svg

Paraphrase This Document

Need a fresh take? Get an instant paraphrase of this document with our AI Paraphraser
Document Page
11
total assets 5 0.0223
Gross profit
rate=gross
profit/ net sales
8927
440,666
=0.02
8032
457834
=0.017
5
8541
481570
=0.0177
11924
517,711
=0.023
12345
552,887
=0.0223
=0.019
Expense
ratio
Operating
expenses/
average value of
fund assets
3007
2895
=1.038
3117
2907
=1.072
3227
3145
=1.026
3669
3372
=1.088
3741
3450
=1.084
=1.073
Return on
Assets
Net income/
average total
assets
8927
440,666
=0.02
8032
457834
=0.017
5
8541
481570
=0.0177
11924
517,711
=0.023
12345
552,887
=0.0223
= 0.02
Return on
Equity
net income/
Equity
34.50B 33.72B 31.45B 29.07B 28.95B =31.45B
5. Identify dividends
a. For the preceding 5 years calculate the divided related ratios and comment on the ratios
as shown below in sample analysis.
2014 2015 2016 2017 2018
1.103
1.101
1.103
1.108
1.106
Leverage Ratio
Series1 Linear (Series1)
Year
Ratio
Document Page
12
Details Ratio Year
2014 2015 2016 2017 2018
Dividend
Ratio
Dividend yield ratio =
dividend paid/ total market
capitalization
402,00
8
364,32
2
= 1.103
440,666
400,460
=1.10
457834
415,038
=1.103
481570
434,600
=1.108
517,711
467,909
=1.106
Dividend payout ratio = total
dividends / net income
402,00
8
364,32
2
=1.1
440,666
400,460
=1.1
457834
415,038
=1.10
481570
434,600
=1.108
517,711
467,909
=1.106
Price earnings ratio= price /
earnings per share = net
income- preferred dividend/
weighted average number of
shares outstanding
402,00
8
364,32
2
=1.103
440,666
400,460
=1.101
457834
415,038
=1.103
481570
434,600
=1.108
517,711
467,909
=1.106
Earnings per share ratio= net 402,00 440,666 457834 481570 517,711
chevron_up_icon
1 out of 39
circle_padding
hide_on_mobile
zoom_out_icon
[object Object]