In-depth Financial Analysis and Decision-Making: Project Report
VerifiedAdded on 2023/06/18
|10
|2339
|64
Report
AI Summary
This report provides a comprehensive financial analysis and decision-making framework, covering key concepts such as the relationship between risk and expected return, systematic and unsystematic risk, and the meaning of beta value. It includes WACC calculation, net present value analysis, and straight-line depreciation computation. The report evaluates investment decisions based on NPV and price-to-earning ratios, comparing company performance to industry benchmarks. Furthermore, it calculates terminal value, company value, and fundamental stock value. The analysis concludes with a recommendation to invest in Fidelix Plc based on its financial performance and growth potential. Desklib offers a range of resources, including past papers and solved assignments, to support students in their studies.

FINANCIAL ANALYSIS
AND
DECISION MAKING
AND
DECISION MAKING
Paraphrase This Document
Need a fresh take? Get an instant paraphrase of this document with our AI Paraphraser
TABLE OF CONTENTS
INTRODUCTION...........................................................................................................................3
Question 1........................................................................................................................................3
(a)................................................................................................................................................3
(b)................................................................................................................................................3
(c)................................................................................................................................................4
(d)................................................................................................................................................4
Question 2........................................................................................................................................4
Question-3...................................................................................................................................5
(a) Calculation of Net Assets Value............................................................................................5
(b) Gordon Growth Model formula with theoretical perspective of price to earning ratio ........6
(c) Comparison of Fidelix Plc performance to industry performance.......................................6
Question 4...................................................................................................................................7
(a) present value of free cash flow..............................................................................................7
(b) calculation of terminal value.................................................................................................7
(c) Value of the company............................................................................................................7
(d) Calculation of fundamental stock value when market value of debt 80 million and
outstanding share is 7 million.....................................................................................................8
Conclusion.......................................................................................................................................8
References........................................................................................................................................8
INTRODUCTION
Financial analysis and decision-making is crucial for selecting and rejecting any project.
This report will discuss general relationship between risk and expected return, systematic and
unsystematic risk, meaning of beta value along with WACC calculation. Further, this report also
analyse Net present value and computation of straight line depreciation amount. Moreover, this
report will also cover decision-making part where decision can be taken on the basis on the basis
of NPV, price to earning ratio, comparison of company performance to industry performance. At
the end, this report also cover some calculation part where WACC, terminal value, value of the
company, fundamental value of stock is calculated.
Question 1
(a)Relationship between risk and expected return
Risk and return both the elements are interrelated with each other. This is a basic
description that the more risk is undertaken the more the return over the investment made is
gained. IN context to the investor point of view the return is proportionate with the risk taken by
the investor (Easton, Larocque and Sustersic Stevens, 2020). The more risk is taken by investor
the more possibilities are created to entertain return against the investment made in the
investment.
(b)brief about systematic risk and unsystematic risk
Unsystematic risk is a risk that is specific to any particular organisation. Systematic risk
on the other hand is identified as a risk identified on a general basis applicable to all the entities.
In context to the business point of view when the expected return are more than the estimations
investors likely to avoid the unsystematic risk. Only if the possible return are more than the
expected mark this risk is tended to avoid by the investor (Luong, Wrzus and Riediger, 2018 ).
All such situations when the return is more than the desirable value investors are ready to take on
the unsystematic risk. Also this risk take by the investor when the unsystematic risk is balanced
against the systematic risk.
⊘ This is a preview!⊘
Do you want full access?
Subscribe today to unlock all pages.
Trusted by 1+ million students worldwide
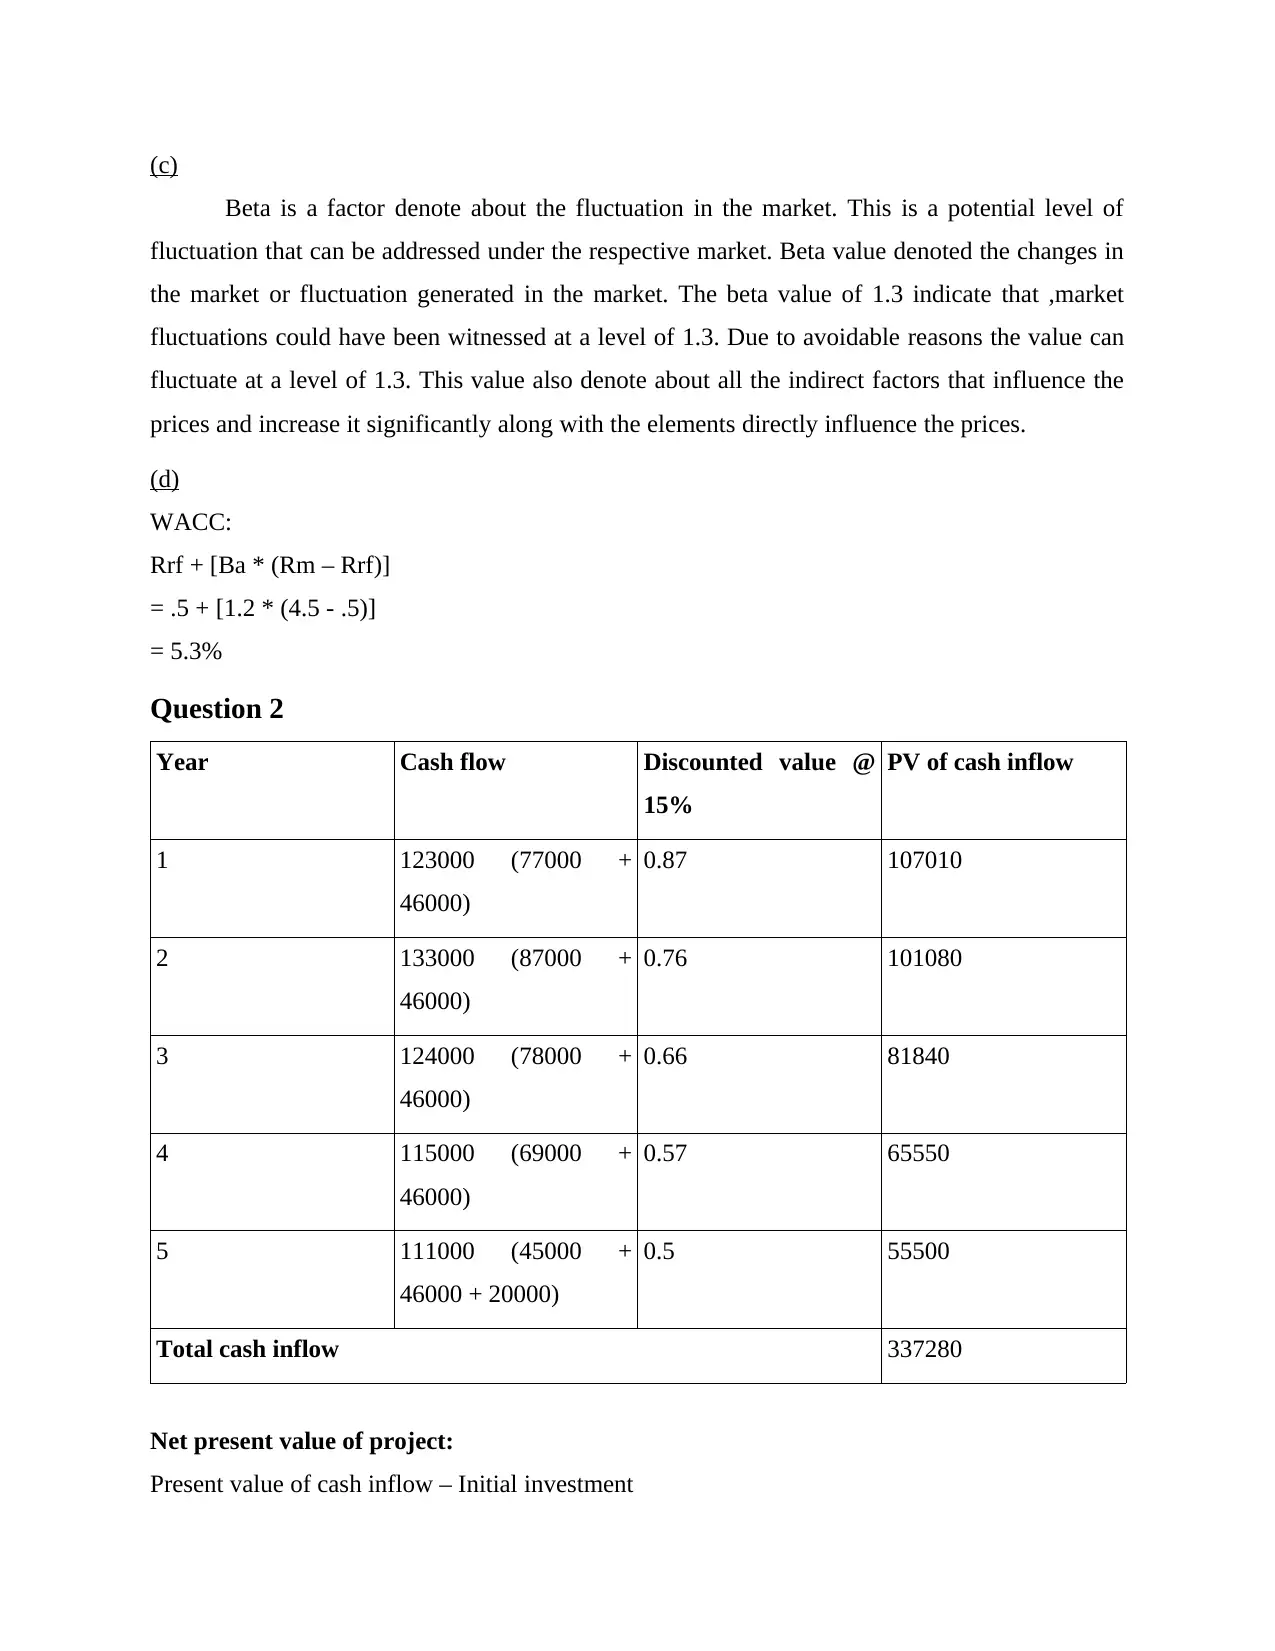
(c)
Beta is a factor denote about the fluctuation in the market. This is a potential level of
fluctuation that can be addressed under the respective market. Beta value denoted the changes in
the market or fluctuation generated in the market. The beta value of 1.3 indicate that ,market
fluctuations could have been witnessed at a level of 1.3. Due to avoidable reasons the value can
fluctuate at a level of 1.3. This value also denote about all the indirect factors that influence the
prices and increase it significantly along with the elements directly influence the prices.
(d)
WACC:
Rrf + [Ba * (Rm – Rrf)]
= .5 + [1.2 * (4.5 - .5)]
= 5.3%
Question 2
Year Cash flow Discounted value @
15%
PV of cash inflow
1 123000 (77000 +
46000)
0.87 107010
2 133000 (87000 +
46000)
0.76 101080
3 124000 (78000 +
46000)
0.66 81840
4 115000 (69000 +
46000)
0.57 65550
5 111000 (45000 +
46000 + 20000)
0.5 55500
Total cash inflow 337280
Net present value of project:
Present value of cash inflow – Initial investment
Paraphrase This Document
Need a fresh take? Get an instant paraphrase of this document with our AI Paraphraser
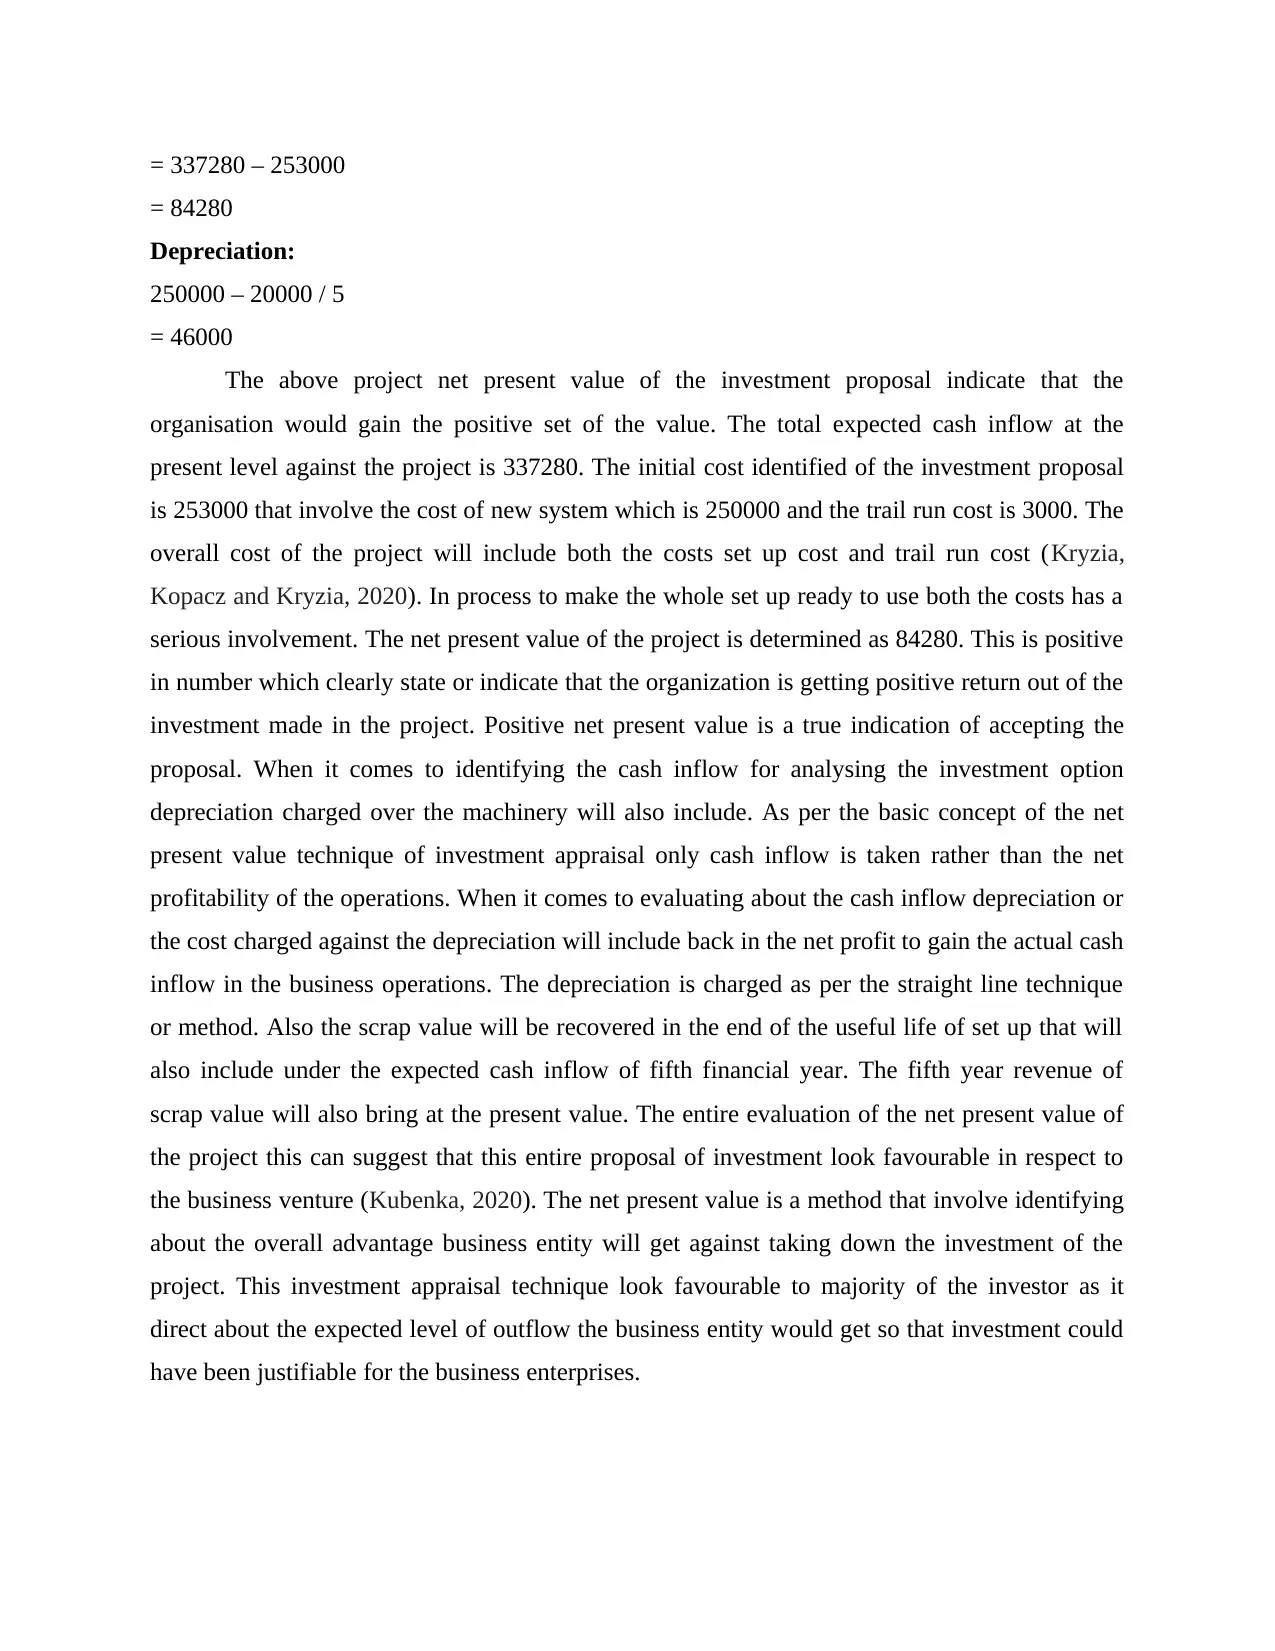
= 337280 – 253000
= 84280
Depreciation:
250000 – 20000 / 5
= 46000
The above project net present value of the investment proposal indicate that the
organisation would gain the positive set of the value. The total expected cash inflow at the
present level against the project is 337280. The initial cost identified of the investment proposal
is 253000 that involve the cost of new system which is 250000 and the trail run cost is 3000. The
overall cost of the project will include both the costs set up cost and trail run cost (Kryzia,
Kopacz and Kryzia, 2020). In process to make the whole set up ready to use both the costs has a
serious involvement. The net present value of the project is determined as 84280. This is positive
in number which clearly state or indicate that the organization is getting positive return out of the
investment made in the project. Positive net present value is a true indication of accepting the
proposal. When it comes to identifying the cash inflow for analysing the investment option
depreciation charged over the machinery will also include. As per the basic concept of the net
present value technique of investment appraisal only cash inflow is taken rather than the net
profitability of the operations. When it comes to evaluating about the cash inflow depreciation or
the cost charged against the depreciation will include back in the net profit to gain the actual cash
inflow in the business operations. The depreciation is charged as per the straight line technique
or method. Also the scrap value will be recovered in the end of the useful life of set up that will
also include under the expected cash inflow of fifth financial year. The fifth year revenue of
scrap value will also bring at the present value. The entire evaluation of the net present value of
the project this can suggest that this entire proposal of investment look favourable in respect to
the business venture (Kubenka, 2020). The net present value is a method that involve identifying
about the overall advantage business entity will get against taking down the investment of the
project. This investment appraisal technique look favourable to majority of the investor as it
direct about the expected level of outflow the business entity would get so that investment could
have been justifiable for the business enterprises.
Question-3
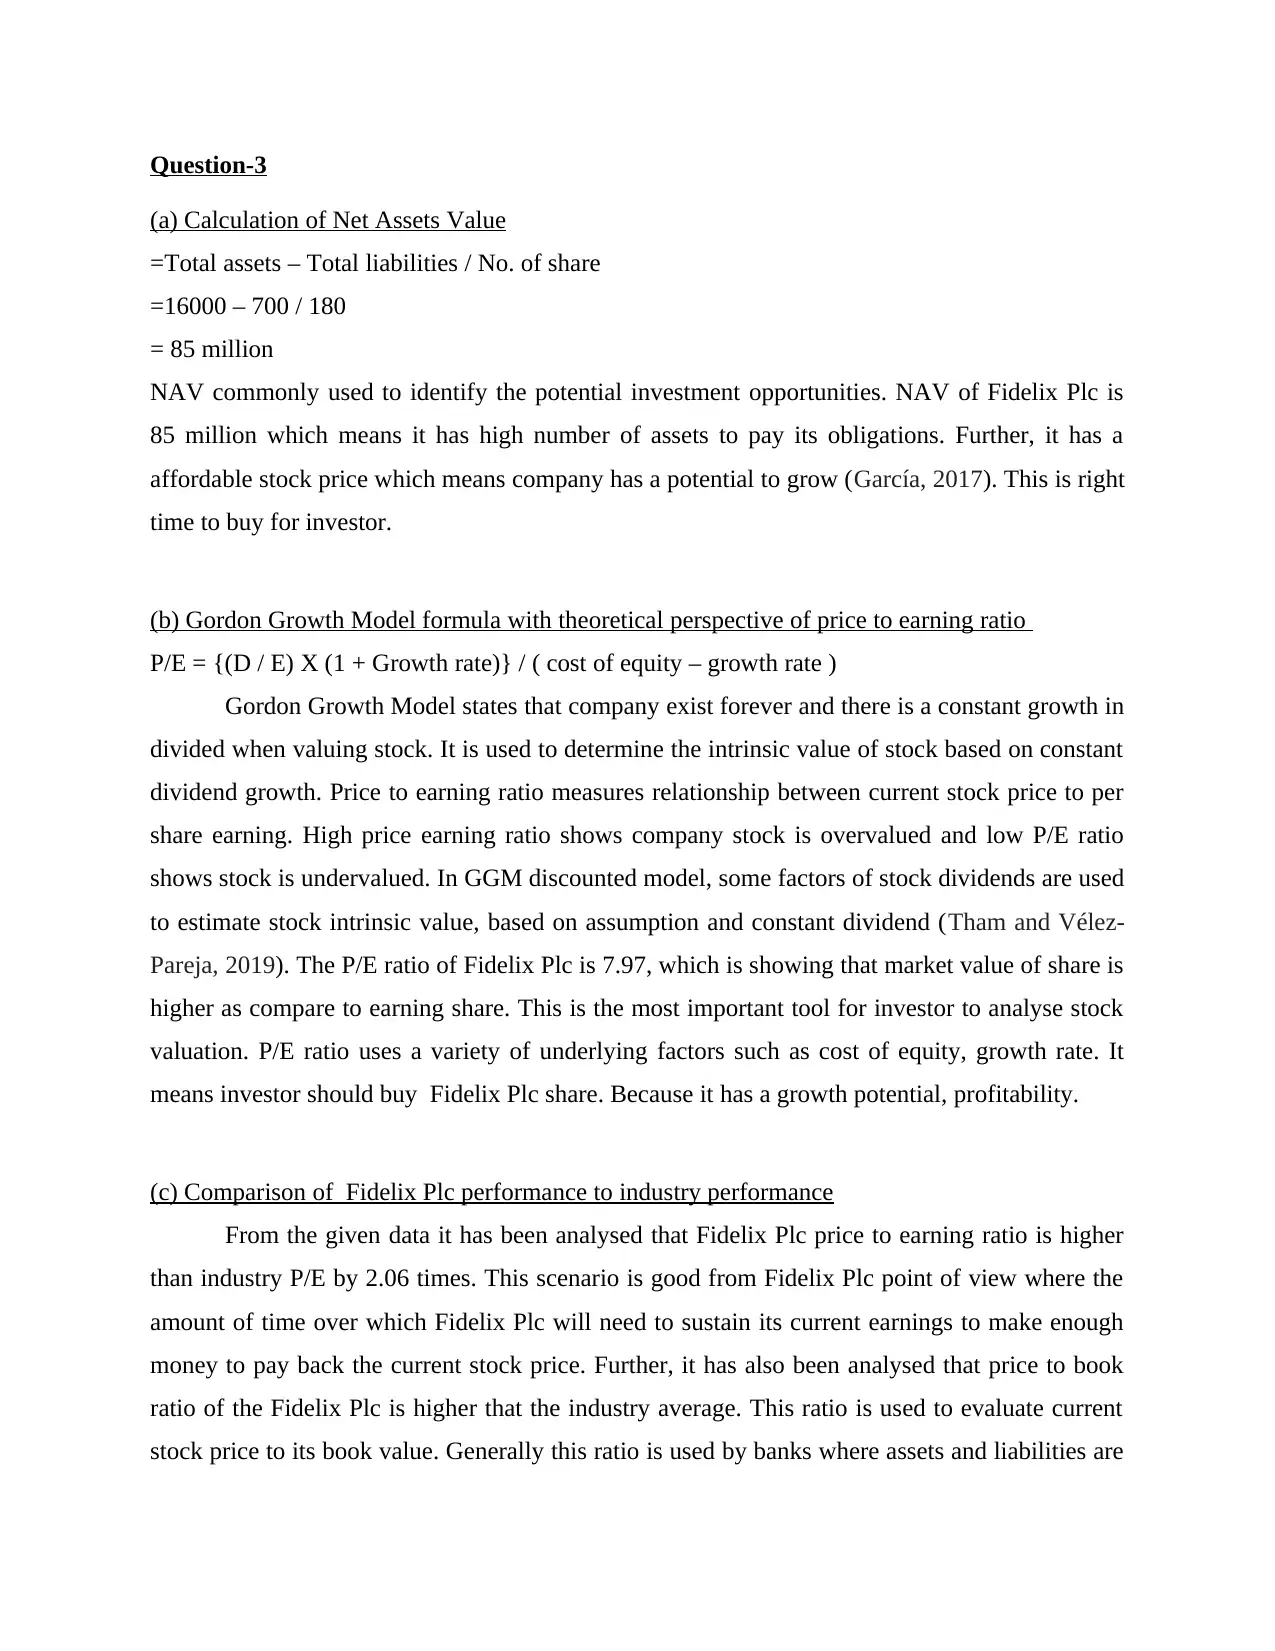
(a) Calculation of Net Assets Value
=Total assets – Total liabilities / No. of share
=16000 – 700 / 180
= 85 million
NAV commonly used to identify the potential investment opportunities. NAV of Fidelix Plc is
85 million which means it has high number of assets to pay its obligations. Further, it has a
affordable stock price which means company has a potential to grow (García, 2017). This is right
time to buy for investor.
(b) Gordon Growth Model formula with theoretical perspective of price to earning ratio
P/E = {(D / E) X (1 + Growth rate)} / ( cost of equity – growth rate )
Gordon Growth Model states that company exist forever and there is a constant growth in
divided when valuing stock. It is used to determine the intrinsic value of stock based on constant
dividend growth. Price to earning ratio measures relationship between current stock price to per
share earning. High price earning ratio shows company stock is overvalued and low P/E ratio
shows stock is undervalued. In GGM discounted model, some factors of stock dividends are used
to estimate stock intrinsic value, based on assumption and constant dividend (Tham and Vélez-
Pareja, 2019). The P/E ratio of Fidelix Plc is 7.97, which is showing that market value of share is
higher as compare to earning share. This is the most important tool for investor to analyse stock
valuation. P/E ratio uses a variety of underlying factors such as cost of equity, growth rate. It
means investor should buy Fidelix Plc share. Because it has a growth potential, profitability.
(c) Comparison of Fidelix Plc performance to industry performance
From the given data it has been analysed that Fidelix Plc price to earning ratio is higher
than industry P/E by 2.06 times. This scenario is good from Fidelix Plc point of view where the
amount of time over which Fidelix Plc will need to sustain its current earnings to make enough
money to pay back the current stock price. Further, it has also been analysed that price to book
ratio of the Fidelix Plc is higher that the industry average. This ratio is used to evaluate current
stock price to its book value. Generally this ratio is used by banks where assets and liabilities are
⊘ This is a preview!⊘
Do you want full access?
Subscribe today to unlock all pages.
Trusted by 1+ million students worldwide
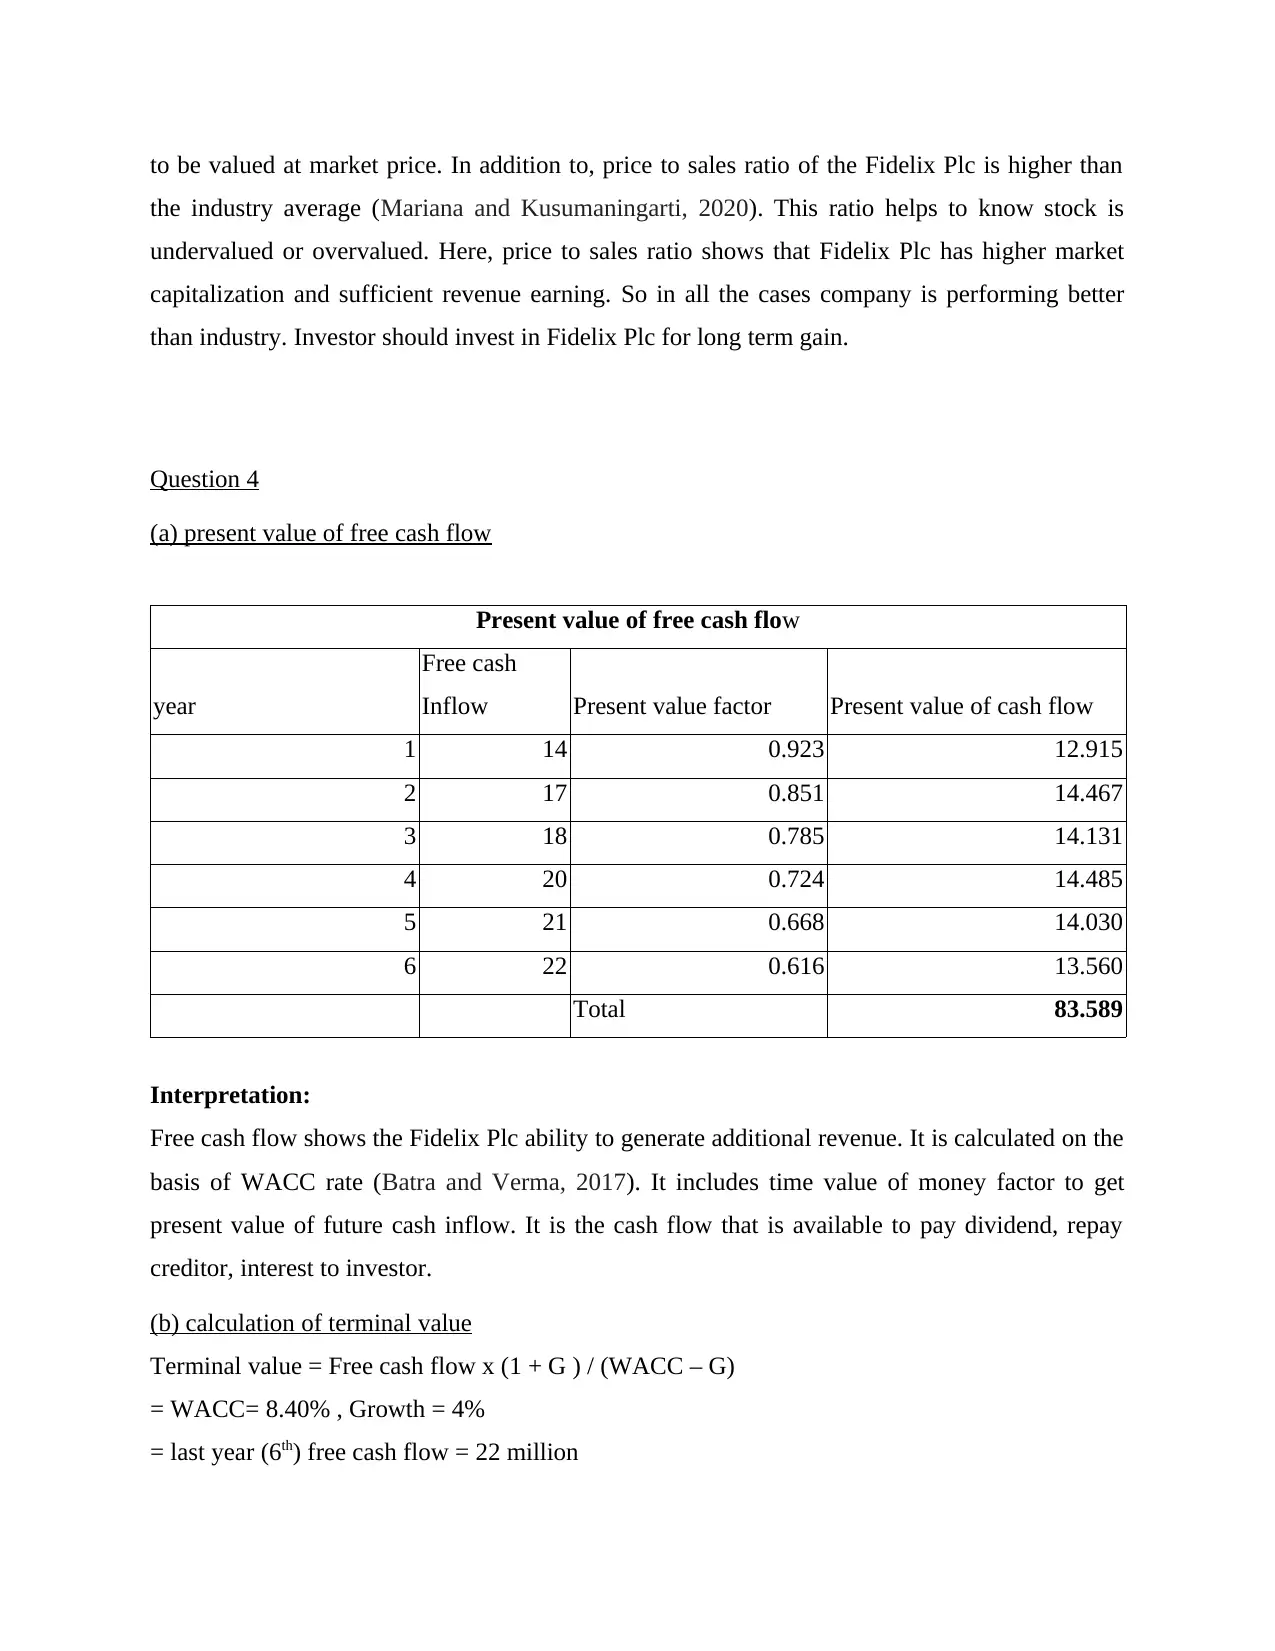
to be valued at market price. In addition to, price to sales ratio of the Fidelix Plc is higher than
the industry average (Mariana and Kusumaningarti, 2020). This ratio helps to know stock is
undervalued or overvalued. Here, price to sales ratio shows that Fidelix Plc has higher market
capitalization and sufficient revenue earning. So in all the cases company is performing better
than industry. Investor should invest in Fidelix Plc for long term gain.
Question 4
(a) present value of free cash flow
Present value of free cash flow
year
Free cash
Inflow Present value factor Present value of cash flow
1 14 0.923 12.915
2 17 0.851 14.467
3 18 0.785 14.131
4 20 0.724 14.485
5 21 0.668 14.030
6 22 0.616 13.560
Total 83.589
Interpretation:
Free cash flow shows the Fidelix Plc ability to generate additional revenue. It is calculated on the
basis of WACC rate (Batra and Verma, 2017). It includes time value of money factor to get
present value of future cash inflow. It is the cash flow that is available to pay dividend, repay
creditor, interest to investor.
(b) calculation of terminal value
Terminal value = Free cash flow x (1 + G ) / (WACC – G)
= WACC= 8.40% , Growth = 4%
= last year (6th) free cash flow = 22 million
Paraphrase This Document
Need a fresh take? Get an instant paraphrase of this document with our AI Paraphraser
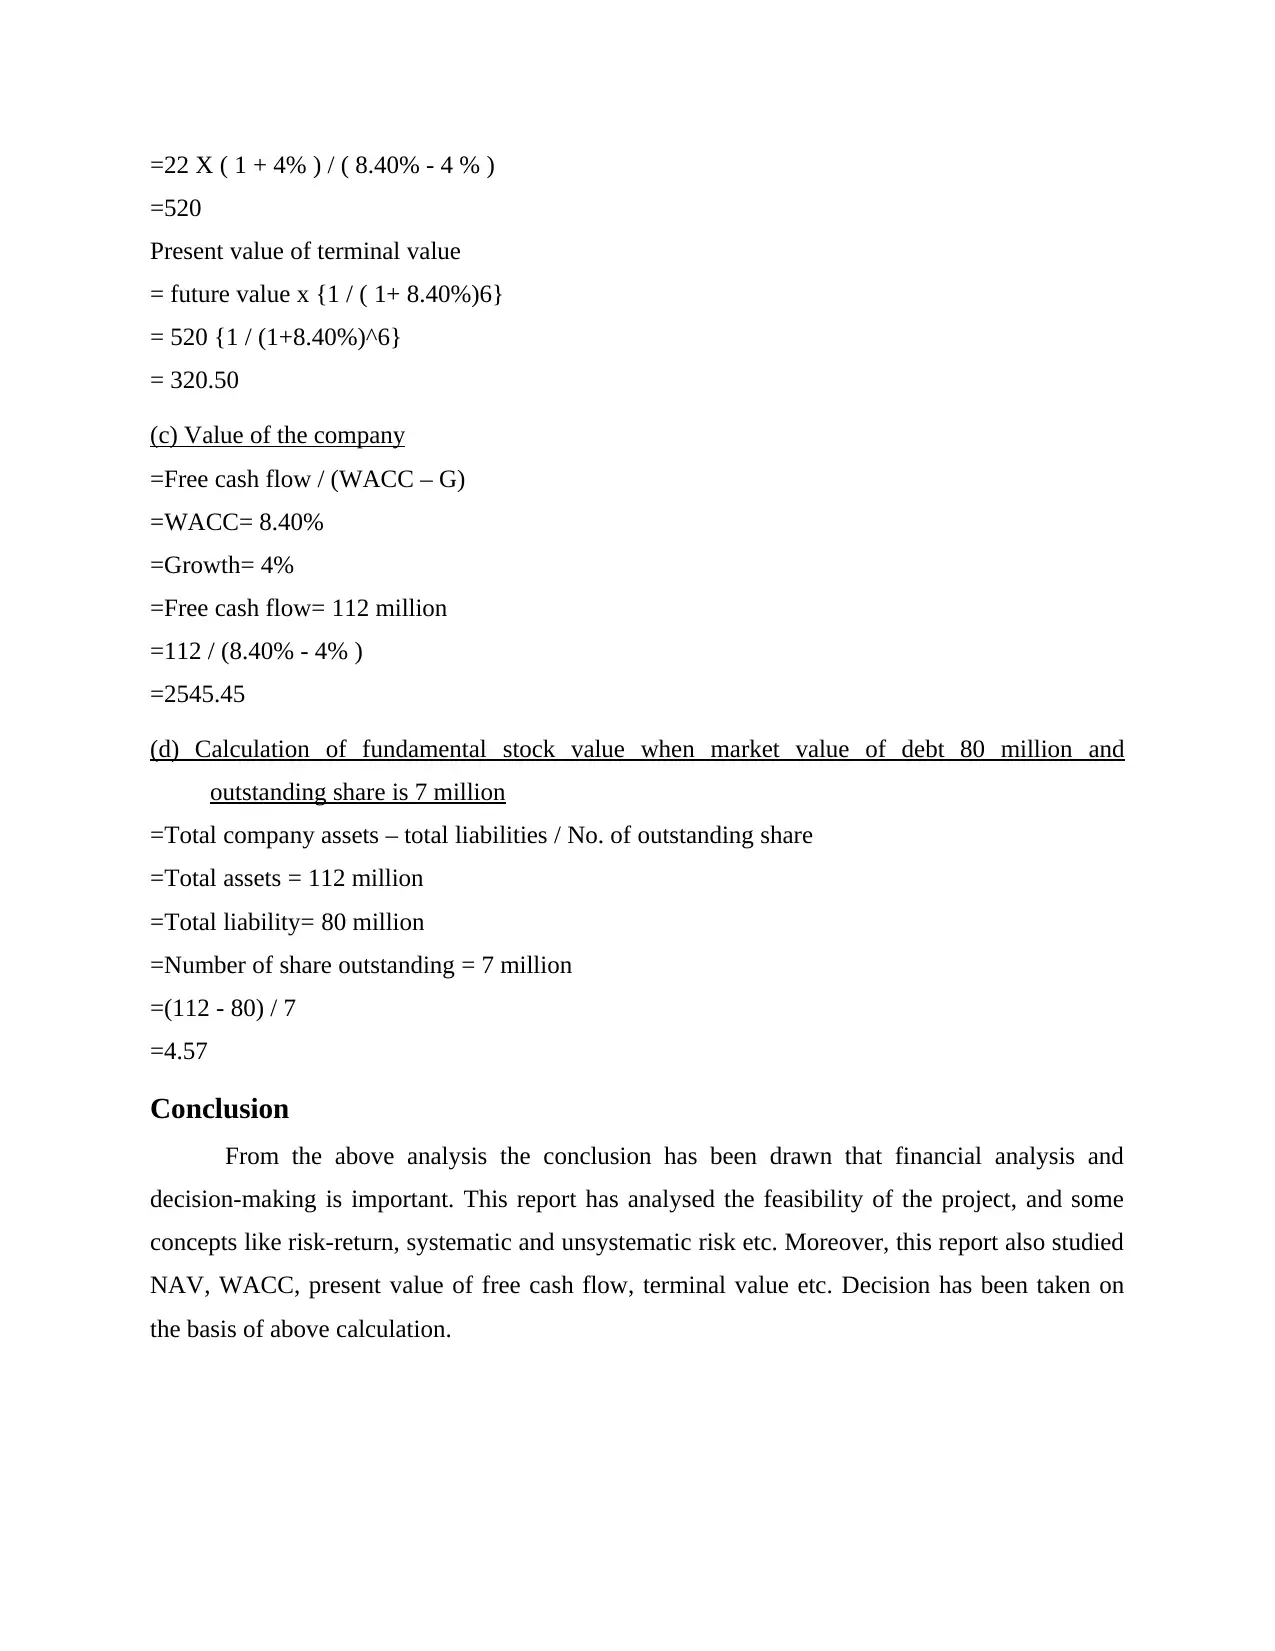
=22 X ( 1 + 4% ) / ( 8.40% - 4 % )
=520
Present value of terminal value
= future value x {1 / ( 1+ 8.40%)6}
= 520 {1 / (1+8.40%)^6}
= 320.50
(c) Value of the company
=Free cash flow / (WACC – G)
=WACC= 8.40%
=Growth= 4%
=Free cash flow= 112 million
=112 / (8.40% - 4% )
=2545.45
(d) Calculation of fundamental stock value when market value of debt 80 million and
outstanding share is 7 million
=Total company assets – total liabilities / No. of outstanding share
=Total assets = 112 million
=Total liability= 80 million
=Number of share outstanding = 7 million
=(112 - 80) / 7
=4.57
Conclusion
From the above analysis the conclusion has been drawn that financial analysis and
decision-making is important. This report has analysed the feasibility of the project, and some
concepts like risk-return, systematic and unsystematic risk etc. Moreover, this report also studied
NAV, WACC, present value of free cash flow, terminal value etc. Decision has been taken on
the basis of above calculation.
References
Books and journals
Batra, R. and Verma, S., 2017. Capital budgeting practices in Indian companies. IIMB
Management Review. 29(1). pp.29-44.
Easton, P.D., Larocque, S. and Sustersic Stevens, J., 2020. Private equity valuation before and
after ASC 820. Available at SSRN 3314992.
García, F.J.P., 2017. The WACC. In Financial risk management (pp. 345-351). Palgrave
Macmillan, Cham.
Kryzia, D., Kopacz, M. and Kryzia, K., 2020. The valuation of the operational flexibility of the
energy investment project based on a gas-fired power plant. Energies. 13(7)3. p.1567.
Kubenka, M., 2020. THE EVALUATION OF METHODOLOGY INFLUENCE ON THE
WACC VALUE: THE CASE OF THE CZECH REPUBLIC. Transformations in
Business & Economics. 19(3).
Luong, G., Wrzus, C. and Riediger, M., 2018. IN THE EYE OF THE BEHOLDER: NEGATIVE
AFFECT VALUATION IN LATER ADULTHOOD. Innovation in Aging. 2(Suppl 1).
p.856.
Mariana, H. and Kusumaningarti, M., 2020. PENGARUH DIVIDEN PAYOUT RATIO, PRICE
TO BOOK VALUE RATIO, DAN PRICE TO EARNING RATIO TERHADAP
RETURN SAHAM PADA PERUSAHAAN ASURANSI YANG TERDAFTAR DI BEI.
JCA (JURNAL CENDEKIA AKUNTANSI). 1(1). pp.36-47.
Tham, J. and Vélez-Pareja, I., 2019. An embarrassment of riches: Winning ways to value with
the WACC. Available at SSRN 352180.
Does NAV matter while buying a mutual fund scheme?. 2021. [online]. Available
through:<https://economictimes.indiatimes.com/mf/analysis/does-nav-matter-while-
buying-a-mutual-fund-scheme/articleshow/57412848.cms>
⊘ This is a preview!⊘
Do you want full access?
Subscribe today to unlock all pages.
Trusted by 1+ million students worldwide

1 out of 10
Related Documents


Your All-in-One AI-Powered Toolkit for Academic Success.
+13062052269
info@desklib.com
Available 24*7 on WhatsApp / Email
![[object Object]](/_next/static/media/star-bottom.7253800d.svg)
Unlock your academic potential
Copyright © 2020–2026 A2Z Services. All Rights Reserved. Developed and managed by ZUCOL.