Financial Performance Analysis of Domino's Pizza Inc. Report
VerifiedAdded on 2021/04/21
|19
|3762
|26
Report
AI Summary
This report presents a comprehensive financial analysis of Domino's Pizza Inc., examining its performance from 2014 to 2017. The analysis covers profitability ratios (gross profit, operating profit, net profit, and return on equity), efficiency ratios (receivable days, payable days, and inventory days), liquidity ratios (current ratio and quick ratio), solvency ratios (debt-to-equity ratio), and investment ratios (earnings per share and price-earnings ratio). The report compares Domino's financial metrics with its main competitor, Pizza Hut, and discusses trends and insights. It further explores strategies to improve shareholder equity, such as increasing the number of outstanding shares. The analysis utilizes financial data from annual reports and provides investment advice based on the company's financial health. The report also includes figures and tables to support the analysis.

RUNNING HEAD: FINANCIAL ANALYSIS
Financial analysis
Financial analysis
Paraphrase This Document
Need a fresh take? Get an instant paraphrase of this document with our AI Paraphraser
Financial analysis 1
Contents
Introduction...........................................................................................................................................2
Requirement 1.......................................................................................................................................2
Profitability ratios..............................................................................................................................2
Competitor comparison – Profitability..............................................................................................4
Efficiency ratios.................................................................................................................................5
Competitor comparison - Efficiency..................................................................................................6
Liquidity ratios..................................................................................................................................7
Competitor comparison - Liquidity...................................................................................................7
Solvency ratios..................................................................................................................................8
Competitor comparison – Solvency...................................................................................................9
Investment ratios.............................................................................................................................10
Competitor comparison – Investment..............................................................................................11
Requirement 2.....................................................................................................................................12
Requirement 3.....................................................................................................................................13
Book value.......................................................................................................................................13
Market value....................................................................................................................................14
Requirement 4.....................................................................................................................................15
Conclusion...........................................................................................................................................15
References...........................................................................................................................................16
Appendices..........................................................................................................................................18
Appendix 1......................................................................................................................................18
Financial analysis 2
Introduction
Domino’s Pizza Inc. is an America based pizza restaurant chain, having its headquarters
situated in Michigan. It was founded in 1960 and today it is the largest and leading pizza
seller all over the world and in United States. It also considered as a best pizza delivery
company in the world having exceptional people as employees. It operates 14,800 stores in
more than 85 countries as per the data of quarter 4 2017. Most of the revenue of the company
is generated from outside U.S and its global sales in 2017 are reported at $12.2 billion out of
which, $6.3 billion are from international markets. Pizza Hut is considered to be close
competitor of Domino’s as it is also operating in the same business and same industry
(Biz.dominos.com. 2018).
The following report will critically analyse the financial position of Domino’s as well as
compare it with its toughest competitor and industry standards. The analysis is done by
calculating various financial ratios based on the annual reports of the company. At last,
investment advice is also been given regarding investing funds into Domino’s Pizza Inc.
Requirement 1
Profitability ratios
These types of ratios helps in determining the profit situation of the company. The income
statement of Domino’s provides essential facts about its financial situation as well as the
profits earned by the company. Domino’s has a continuous increase in its net profits and
profit from the operations. However, the company has a negative equity (Buckland and
Davis, Eds. 2016).
A brief summary of all the ratios is been provided here
⊘ This is a preview!⊘
Do you want full access?
Subscribe today to unlock all pages.
Trusted by 1+ million students worldwide
Financial analysis 3
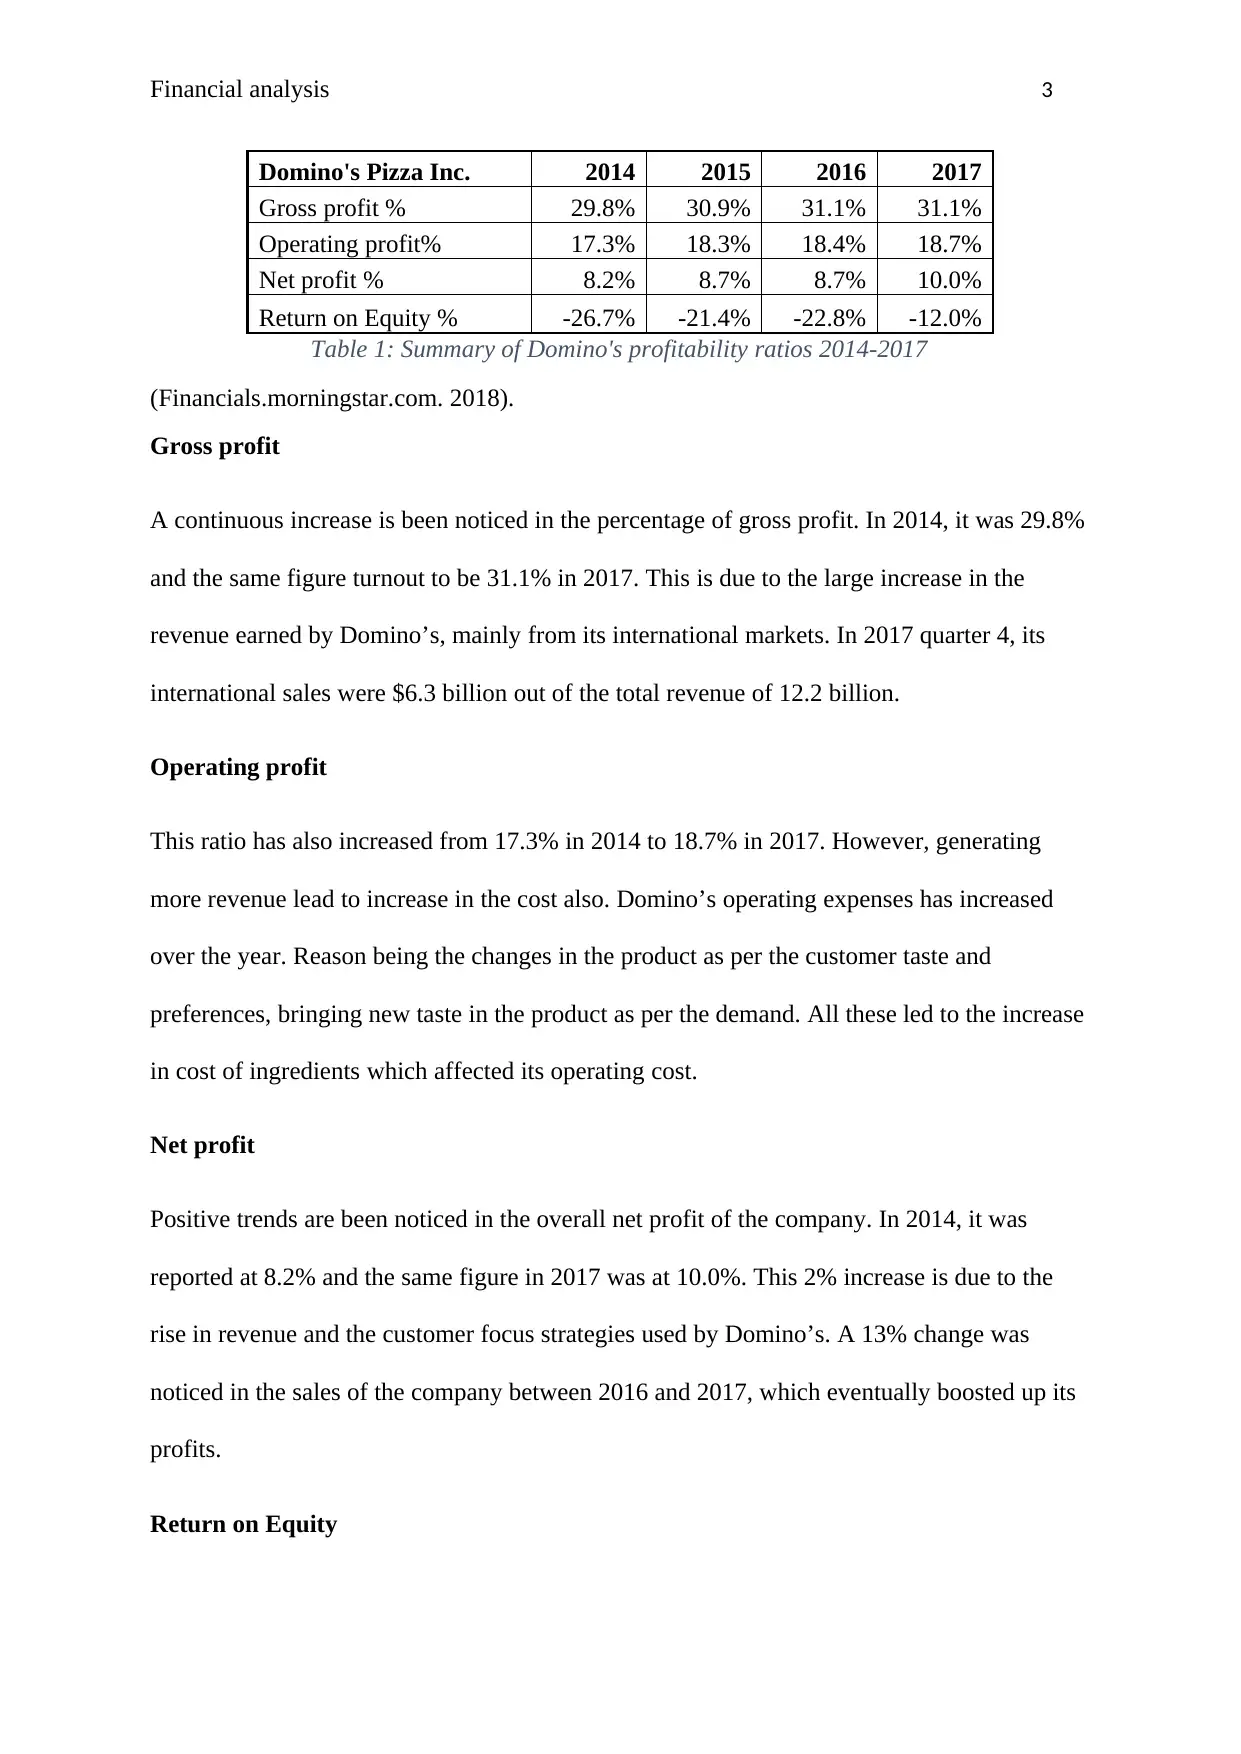
Domino's Pizza Inc. 2014 2015 2016 2017
Gross profit % 29.8% 30.9% 31.1% 31.1%
Operating profit% 17.3% 18.3% 18.4% 18.7%
Net profit % 8.2% 8.7% 8.7% 10.0%
Return on Equity % -26.7% -21.4% -22.8% -12.0%
Table 1: Summary of Domino's profitability ratios 2014-2017
(Financials.morningstar.com. 2018).
Gross profit
A continuous increase is been noticed in the percentage of gross profit. In 2014, it was 29.8%
and the same figure turnout to be 31.1% in 2017. This is due to the large increase in the
revenue earned by Domino’s, mainly from its international markets. In 2017 quarter 4, its
international sales were $6.3 billion out of the total revenue of 12.2 billion.
Operating profit
This ratio has also increased from 17.3% in 2014 to 18.7% in 2017. However, generating
more revenue lead to increase in the cost also. Domino’s operating expenses has increased
over the year. Reason being the changes in the product as per the customer taste and
preferences, bringing new taste in the product as per the demand. All these led to the increase
in cost of ingredients which affected its operating cost.
Net profit
Positive trends are been noticed in the overall net profit of the company. In 2014, it was
reported at 8.2% and the same figure in 2017 was at 10.0%. This 2% increase is due to the
rise in revenue and the customer focus strategies used by Domino’s. A 13% change was
noticed in the sales of the company between 2016 and 2017, which eventually boosted up its
profits.
Return on Equity
Paraphrase This Document
Need a fresh take? Get an instant paraphrase of this document with our AI Paraphraser
Financial analysis 4
It is that profitability ratio which shows company’s ability to generate returns from its
shareholder’s equity. In Domino’s case, the trend is reverse as the company has negative
value of the equity all over the four years. The reason of having a negative equity is the long
term debt of the company which continues to rise from 2014 to 2017. In 2017, the long term
debt was $3121 million which in 2014 was $1524 million. A negative ROE means company
is generating negative returns for its shareholders.
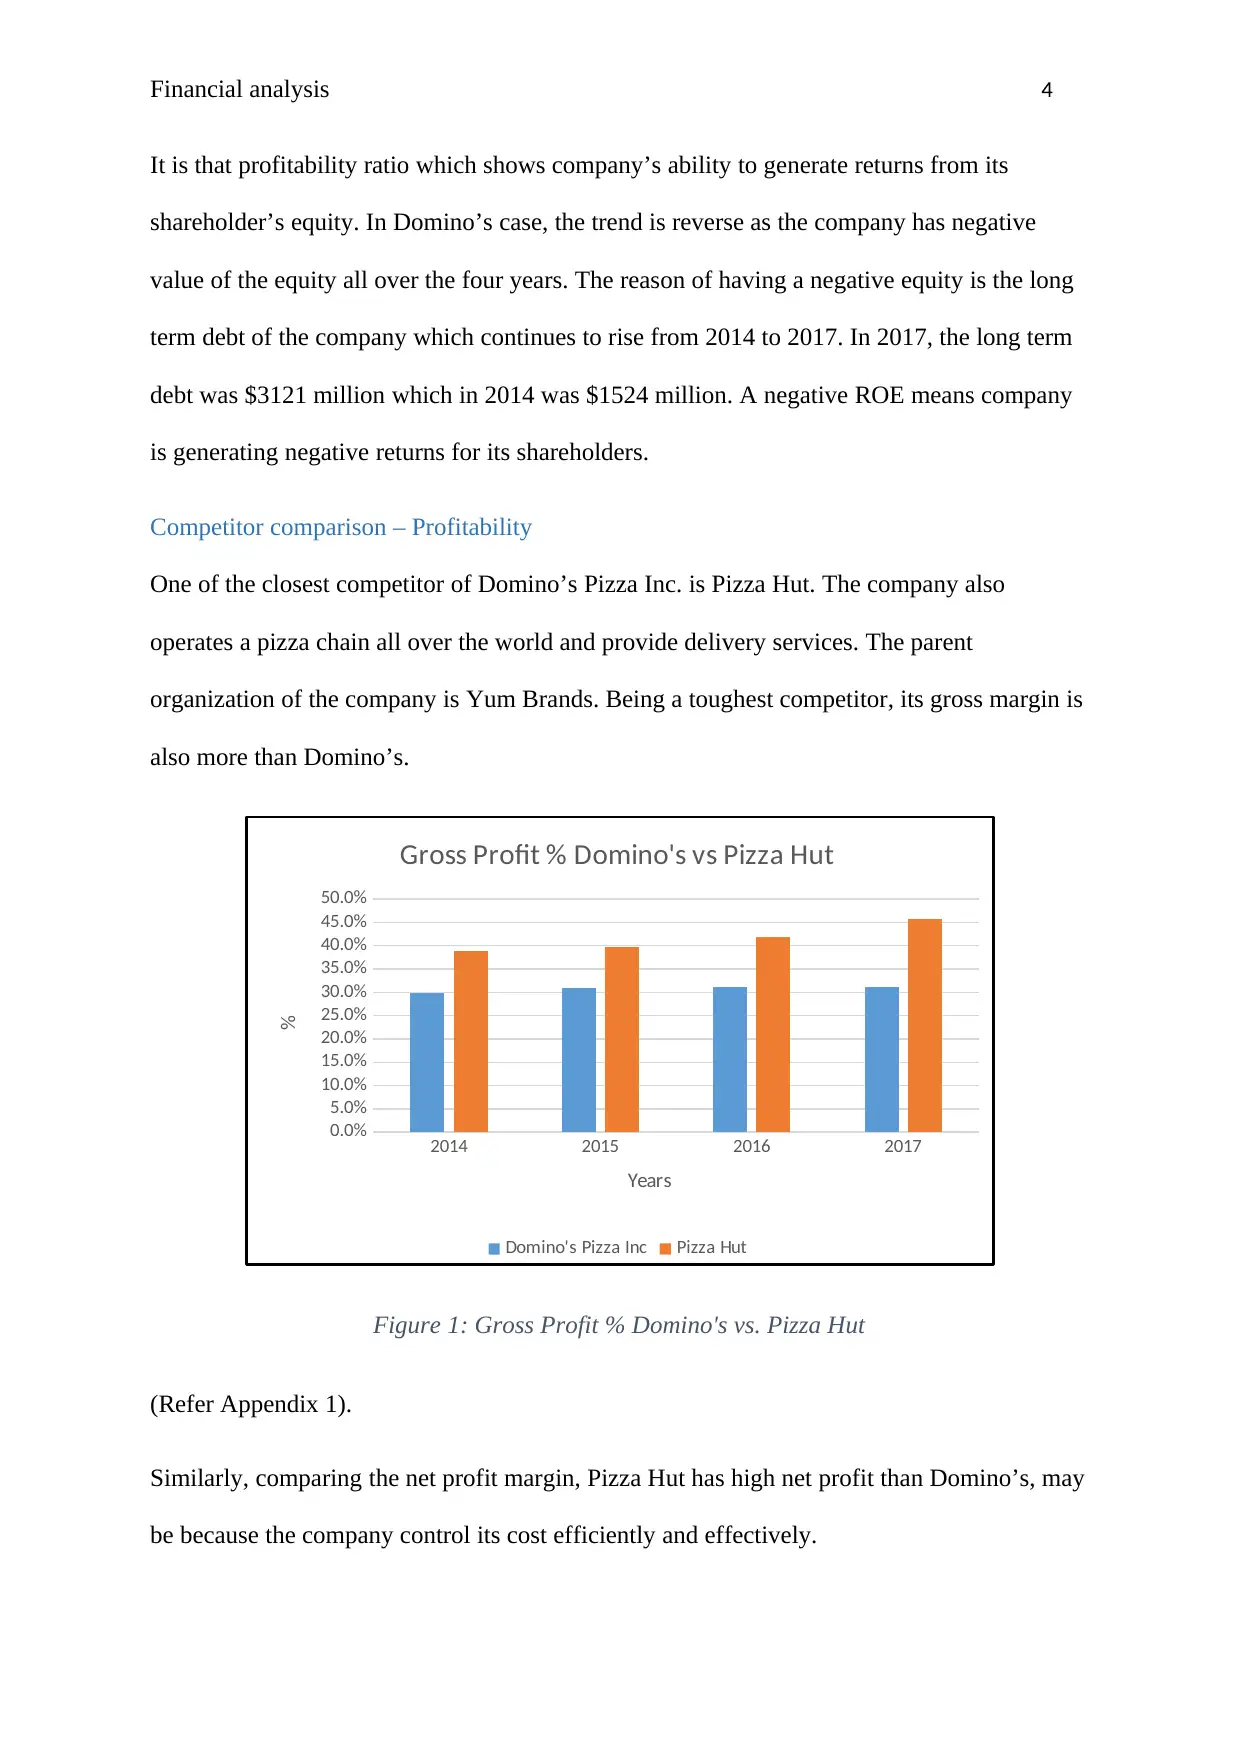
Competitor comparison – Profitability
One of the closest competitor of Domino’s Pizza Inc. is Pizza Hut. The company also
operates a pizza chain all over the world and provide delivery services. The parent
organization of the company is Yum Brands. Being a toughest competitor, its gross margin is
also more than Domino’s.
2014 2015 2016 2017
0.0%
5.0%
10.0%
15.0%
20.0%
25.0%
30.0%
35.0%
40.0%
45.0%
50.0%
Gross Profit % Domino's vs Pizza Hut
Domino's Pizza Inc Pizza Hut
Years
%
Figure 1: Gross Profit % Domino's vs. Pizza Hut
(Refer Appendix 1).
Similarly, comparing the net profit margin, Pizza Hut has high net profit than Domino’s, may
be because the company control its cost efficiently and effectively.
It is that profitability ratio which shows company’s ability to generate returns from its
shareholder’s equity. In Domino’s case, the trend is reverse as the company has negative
value of the equity all over the four years. The reason of having a negative equity is the long
term debt of the company which continues to rise from 2014 to 2017. In 2017, the long term
debt was $3121 million which in 2014 was $1524 million. A negative ROE means company
is generating negative returns for its shareholders.
Competitor comparison – Profitability
One of the closest competitor of Domino’s Pizza Inc. is Pizza Hut. The company also
operates a pizza chain all over the world and provide delivery services. The parent
organization of the company is Yum Brands. Being a toughest competitor, its gross margin is
also more than Domino’s.
2014 2015 2016 2017
0.0%
5.0%
10.0%
15.0%
20.0%
25.0%
30.0%
35.0%
40.0%
45.0%
50.0%
Gross Profit % Domino's vs Pizza Hut
Domino's Pizza Inc Pizza Hut
Years
%
Figure 1: Gross Profit % Domino's vs. Pizza Hut
(Refer Appendix 1).
Similarly, comparing the net profit margin, Pizza Hut has high net profit than Domino’s, may
be because the company control its cost efficiently and effectively.
Financial analysis 5
2014 2015 2016 2017
0.0%
5.0%
10.0%
15.0%
20.0%
25.0%
30.0%
Net Profit % Domino's vs Pizza Hut
Domino's Pizza Inc Pizza Hut
Years
%
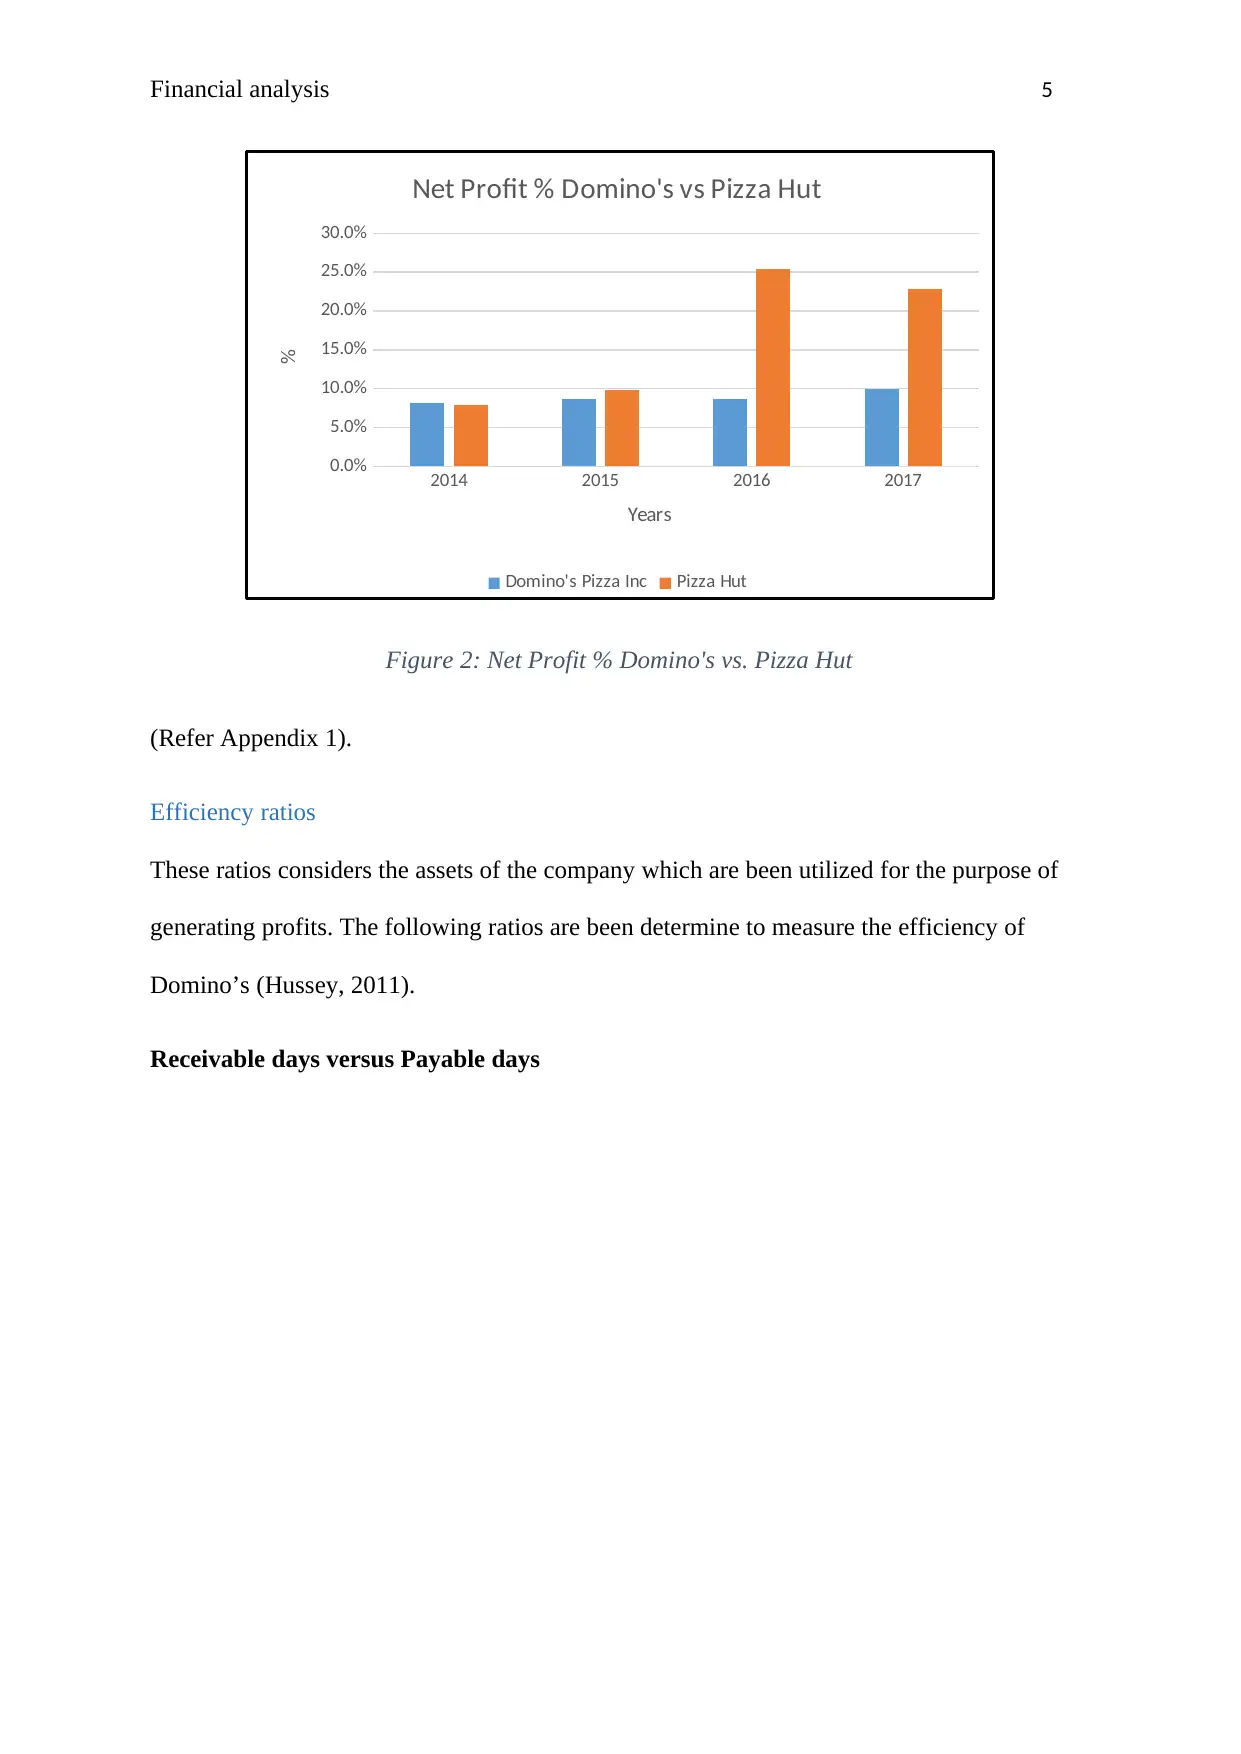
Figure 2: Net Profit % Domino's vs. Pizza Hut
(Refer Appendix 1).
Efficiency ratios
These ratios considers the assets of the company which are been utilized for the purpose of
generating profits. The following ratios are been determine to measure the efficiency of
Domino’s (Hussey, 2011).
Receivable days versus Payable days
2014 2015 2016 2017
0.0%
5.0%
10.0%
15.0%
20.0%
25.0%
30.0%
Net Profit % Domino's vs Pizza Hut
Domino's Pizza Inc Pizza Hut
Years
%
Figure 2: Net Profit % Domino's vs. Pizza Hut
(Refer Appendix 1).
Efficiency ratios
These ratios considers the assets of the company which are been utilized for the purpose of
generating profits. The following ratios are been determine to measure the efficiency of
Domino’s (Hussey, 2011).
Receivable days versus Payable days
⊘ This is a preview!⊘
Do you want full access?
Subscribe today to unlock all pages.
Trusted by 1+ million students worldwide
Financial analysis 6
2014 2015 2016 2017
0.0
5.0
10.0
15.0
20.0
25.0
30.0
Receivable days vs Payable days
Receivable days Payable days
Years
Days
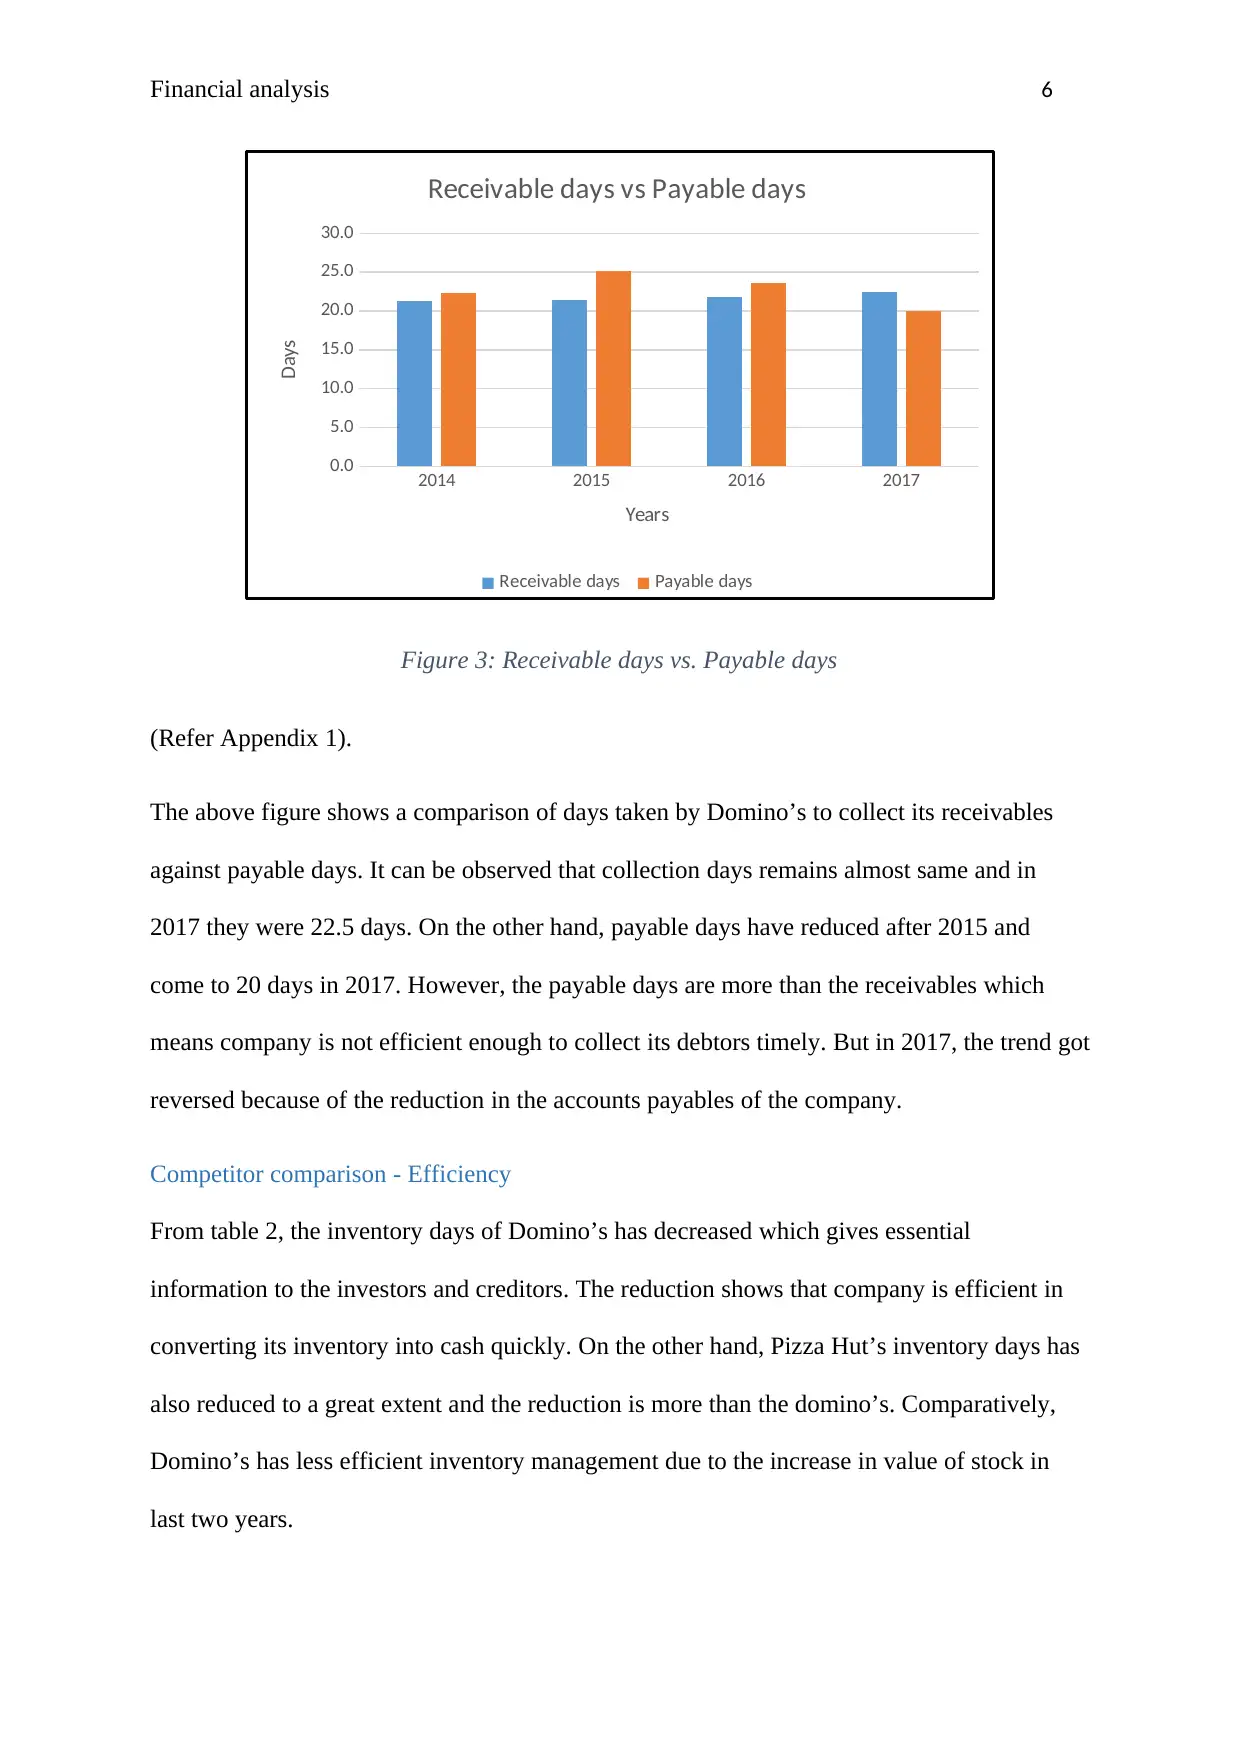
Figure 3: Receivable days vs. Payable days
(Refer Appendix 1).
The above figure shows a comparison of days taken by Domino’s to collect its receivables
against payable days. It can be observed that collection days remains almost same and in
2017 they were 22.5 days. On the other hand, payable days have reduced after 2015 and
come to 20 days in 2017. However, the payable days are more than the receivables which
means company is not efficient enough to collect its debtors timely. But in 2017, the trend got
reversed because of the reduction in the accounts payables of the company.
Competitor comparison - Efficiency
From table 2, the inventory days of Domino’s has decreased which gives essential
information to the investors and creditors. The reduction shows that company is efficient in
converting its inventory into cash quickly. On the other hand, Pizza Hut’s inventory days has
also reduced to a great extent and the reduction is more than the domino’s. Comparatively,
Domino’s has less efficient inventory management due to the increase in value of stock in
last two years.
2014 2015 2016 2017
0.0
5.0
10.0
15.0
20.0
25.0
30.0
Receivable days vs Payable days
Receivable days Payable days
Years
Days
Figure 3: Receivable days vs. Payable days
(Refer Appendix 1).
The above figure shows a comparison of days taken by Domino’s to collect its receivables
against payable days. It can be observed that collection days remains almost same and in
2017 they were 22.5 days. On the other hand, payable days have reduced after 2015 and
come to 20 days in 2017. However, the payable days are more than the receivables which
means company is not efficient enough to collect its debtors timely. But in 2017, the trend got
reversed because of the reduction in the accounts payables of the company.
Competitor comparison - Efficiency
From table 2, the inventory days of Domino’s has decreased which gives essential
information to the investors and creditors. The reduction shows that company is efficient in
converting its inventory into cash quickly. On the other hand, Pizza Hut’s inventory days has
also reduced to a great extent and the reduction is more than the domino’s. Comparatively,
Domino’s has less efficient inventory management due to the increase in value of stock in
last two years.
Paraphrase This Document
Need a fresh take? Get an instant paraphrase of this document with our AI Paraphraser
Financial analysis 7
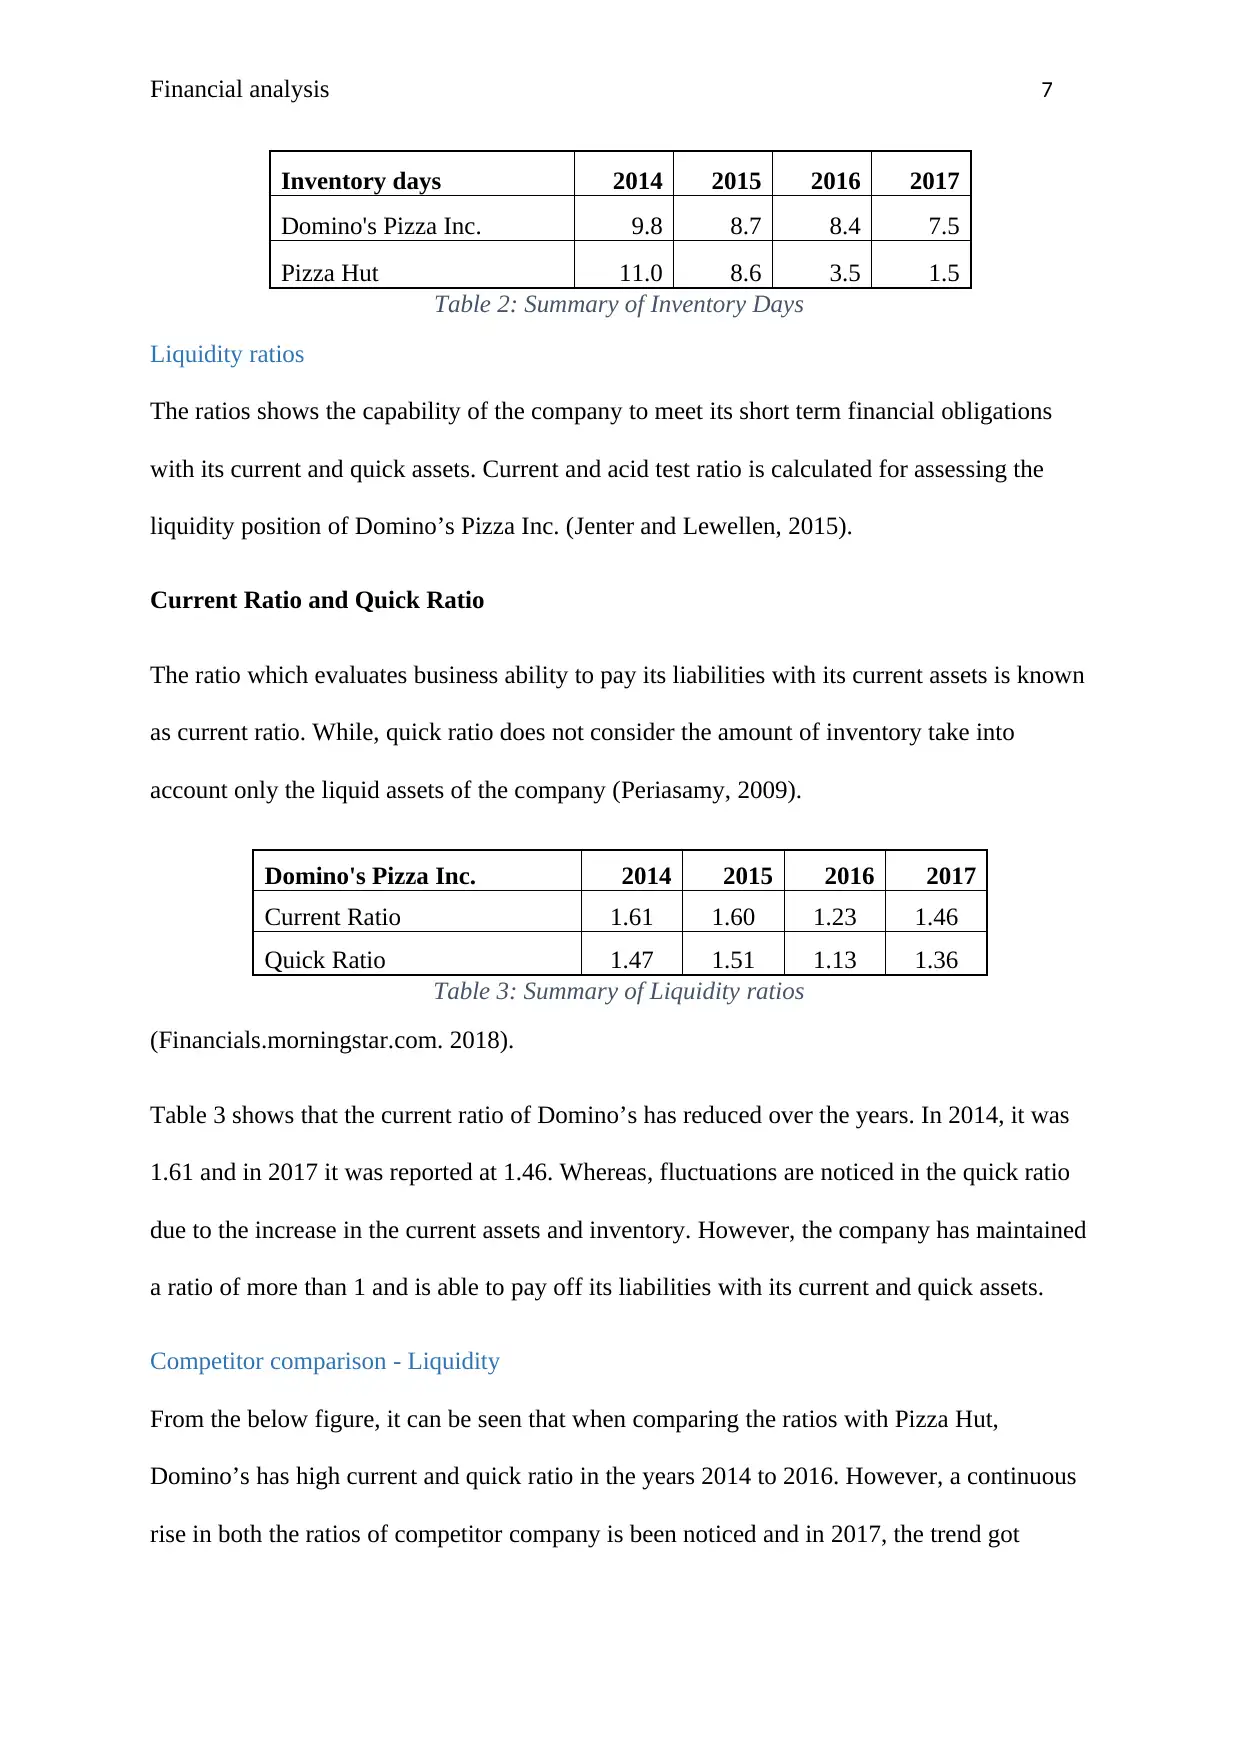
Inventory days 2014 2015 2016 2017
Domino's Pizza Inc. 9.8 8.7 8.4 7.5
Pizza Hut 11.0 8.6 3.5 1.5
Table 2: Summary of Inventory Days
Liquidity ratios
The ratios shows the capability of the company to meet its short term financial obligations
with its current and quick assets. Current and acid test ratio is calculated for assessing the
liquidity position of Domino’s Pizza Inc. (Jenter and Lewellen, 2015).
Current Ratio and Quick Ratio
The ratio which evaluates business ability to pay its liabilities with its current assets is known
as current ratio. While, quick ratio does not consider the amount of inventory take into
account only the liquid assets of the company (Periasamy, 2009).
Domino's Pizza Inc. 2014 2015 2016 2017
Current Ratio 1.61 1.60 1.23 1.46
Quick Ratio 1.47 1.51 1.13 1.36
Table 3: Summary of Liquidity ratios
(Financials.morningstar.com. 2018).
Table 3 shows that the current ratio of Domino’s has reduced over the years. In 2014, it was
1.61 and in 2017 it was reported at 1.46. Whereas, fluctuations are noticed in the quick ratio
due to the increase in the current assets and inventory. However, the company has maintained
a ratio of more than 1 and is able to pay off its liabilities with its current and quick assets.
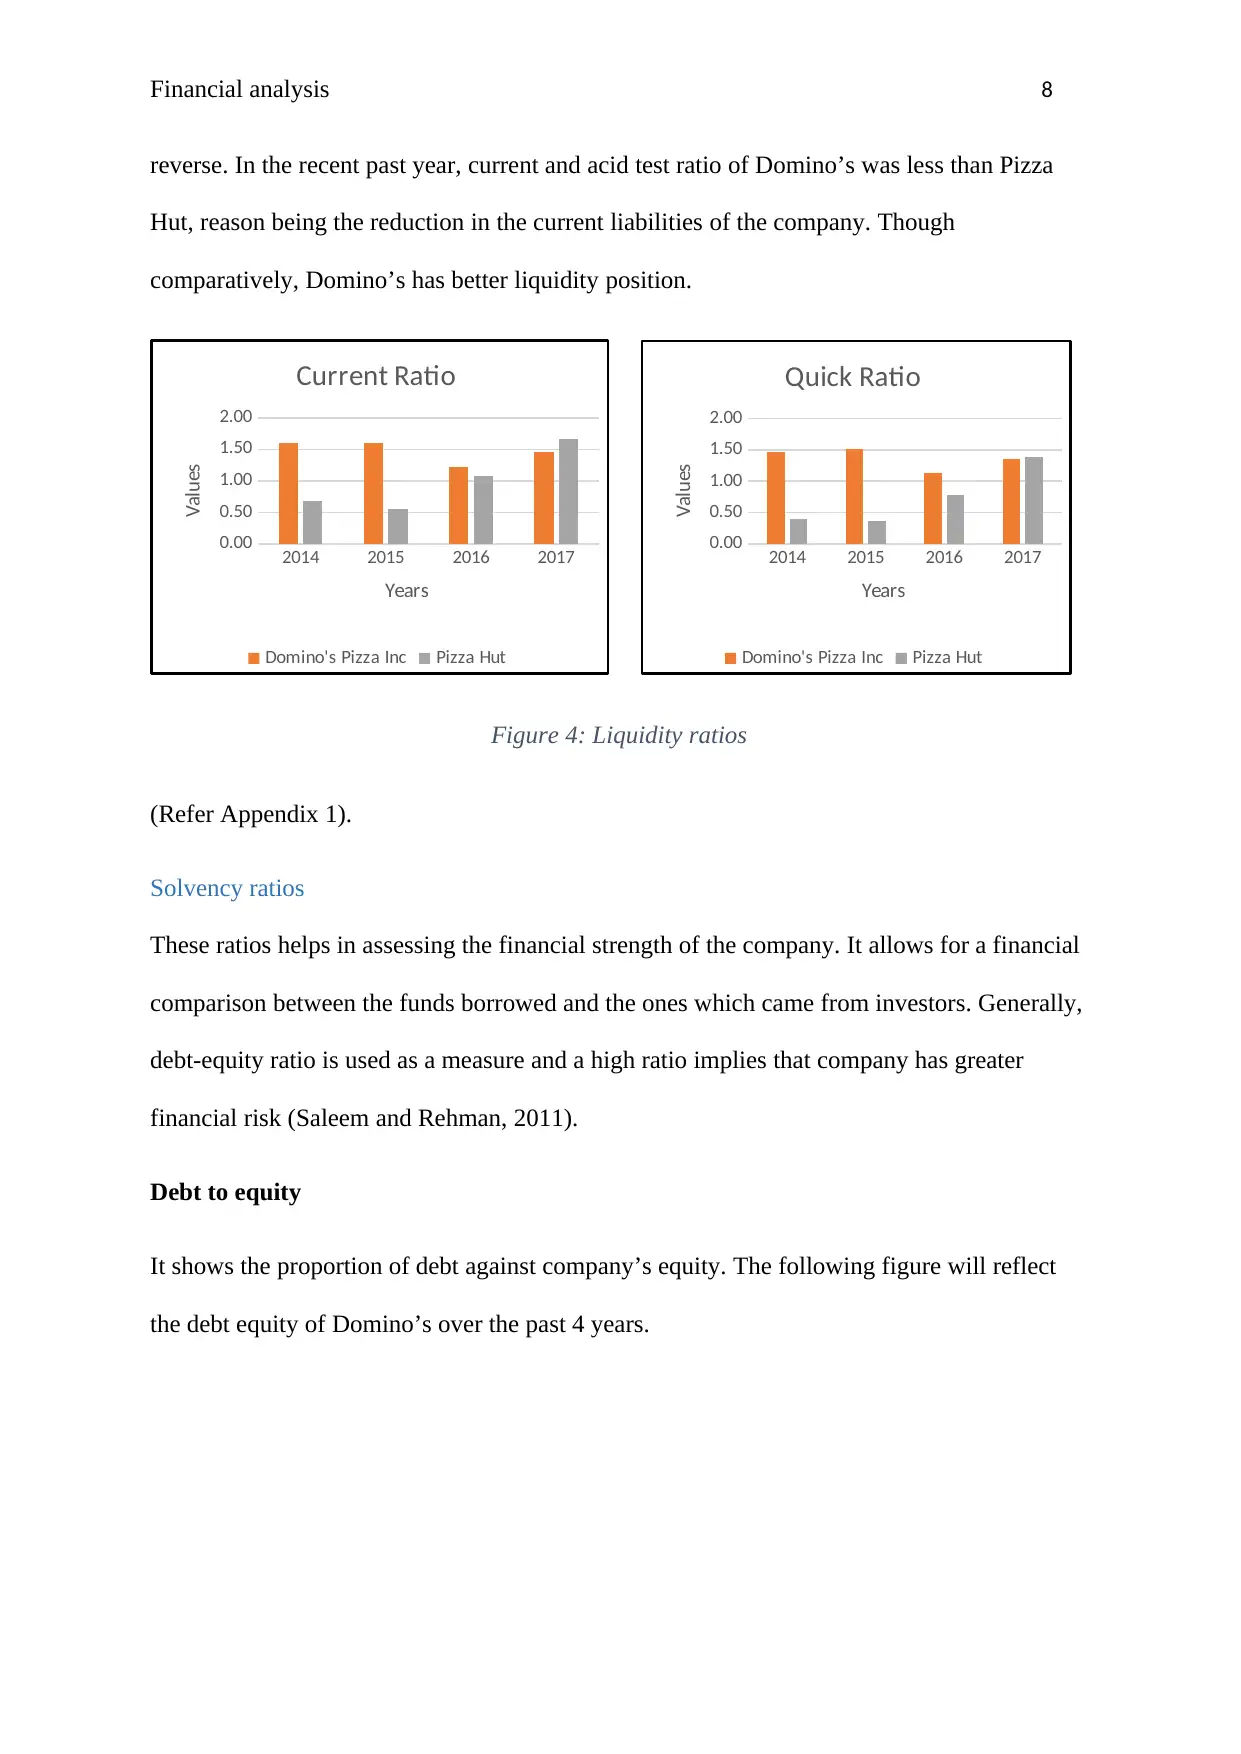
Competitor comparison - Liquidity
From the below figure, it can be seen that when comparing the ratios with Pizza Hut,
Domino’s has high current and quick ratio in the years 2014 to 2016. However, a continuous
rise in both the ratios of competitor company is been noticed and in 2017, the trend got
Inventory days 2014 2015 2016 2017
Domino's Pizza Inc. 9.8 8.7 8.4 7.5
Pizza Hut 11.0 8.6 3.5 1.5
Table 2: Summary of Inventory Days
Liquidity ratios
The ratios shows the capability of the company to meet its short term financial obligations
with its current and quick assets. Current and acid test ratio is calculated for assessing the
liquidity position of Domino’s Pizza Inc. (Jenter and Lewellen, 2015).
Current Ratio and Quick Ratio
The ratio which evaluates business ability to pay its liabilities with its current assets is known
as current ratio. While, quick ratio does not consider the amount of inventory take into
account only the liquid assets of the company (Periasamy, 2009).
Domino's Pizza Inc. 2014 2015 2016 2017
Current Ratio 1.61 1.60 1.23 1.46
Quick Ratio 1.47 1.51 1.13 1.36
Table 3: Summary of Liquidity ratios
(Financials.morningstar.com. 2018).
Table 3 shows that the current ratio of Domino’s has reduced over the years. In 2014, it was
1.61 and in 2017 it was reported at 1.46. Whereas, fluctuations are noticed in the quick ratio
due to the increase in the current assets and inventory. However, the company has maintained
a ratio of more than 1 and is able to pay off its liabilities with its current and quick assets.
Competitor comparison - Liquidity
From the below figure, it can be seen that when comparing the ratios with Pizza Hut,
Domino’s has high current and quick ratio in the years 2014 to 2016. However, a continuous
rise in both the ratios of competitor company is been noticed and in 2017, the trend got
Financial analysis 8
reverse. In the recent past year, current and acid test ratio of Domino’s was less than Pizza
Hut, reason being the reduction in the current liabilities of the company. Though
comparatively, Domino’s has better liquidity position.
2014 2015 2016 2017
0.00
0.50
1.00
1.50
2.00
Current Ratio
Domino's Pizza Inc Pizza Hut
Years
Values
2014 2015 2016 2017
0.00
0.50
1.00
1.50
2.00
Quick Ratio
Domino's Pizza Inc Pizza Hut
Years
Values
Figure 4: Liquidity ratios
(Refer Appendix 1).
Solvency ratios
These ratios helps in assessing the financial strength of the company. It allows for a financial
comparison between the funds borrowed and the ones which came from investors. Generally,
debt-equity ratio is used as a measure and a high ratio implies that company has greater
financial risk (Saleem and Rehman, 2011).
Debt to equity
It shows the proportion of debt against company’s equity. The following figure will reflect
the debt equity of Domino’s over the past 4 years.
⊘ This is a preview!⊘
Do you want full access?
Subscribe today to unlock all pages.
Trusted by 1+ million students worldwide
Financial analysis 9
2014 2015 2016 2017
-155.0%
-150.0%
-145.0%
-140.0%
-135.0%
-130.0%
-125.0%
-120.0%
Debt/Equity
Debt/Equity
Years
%
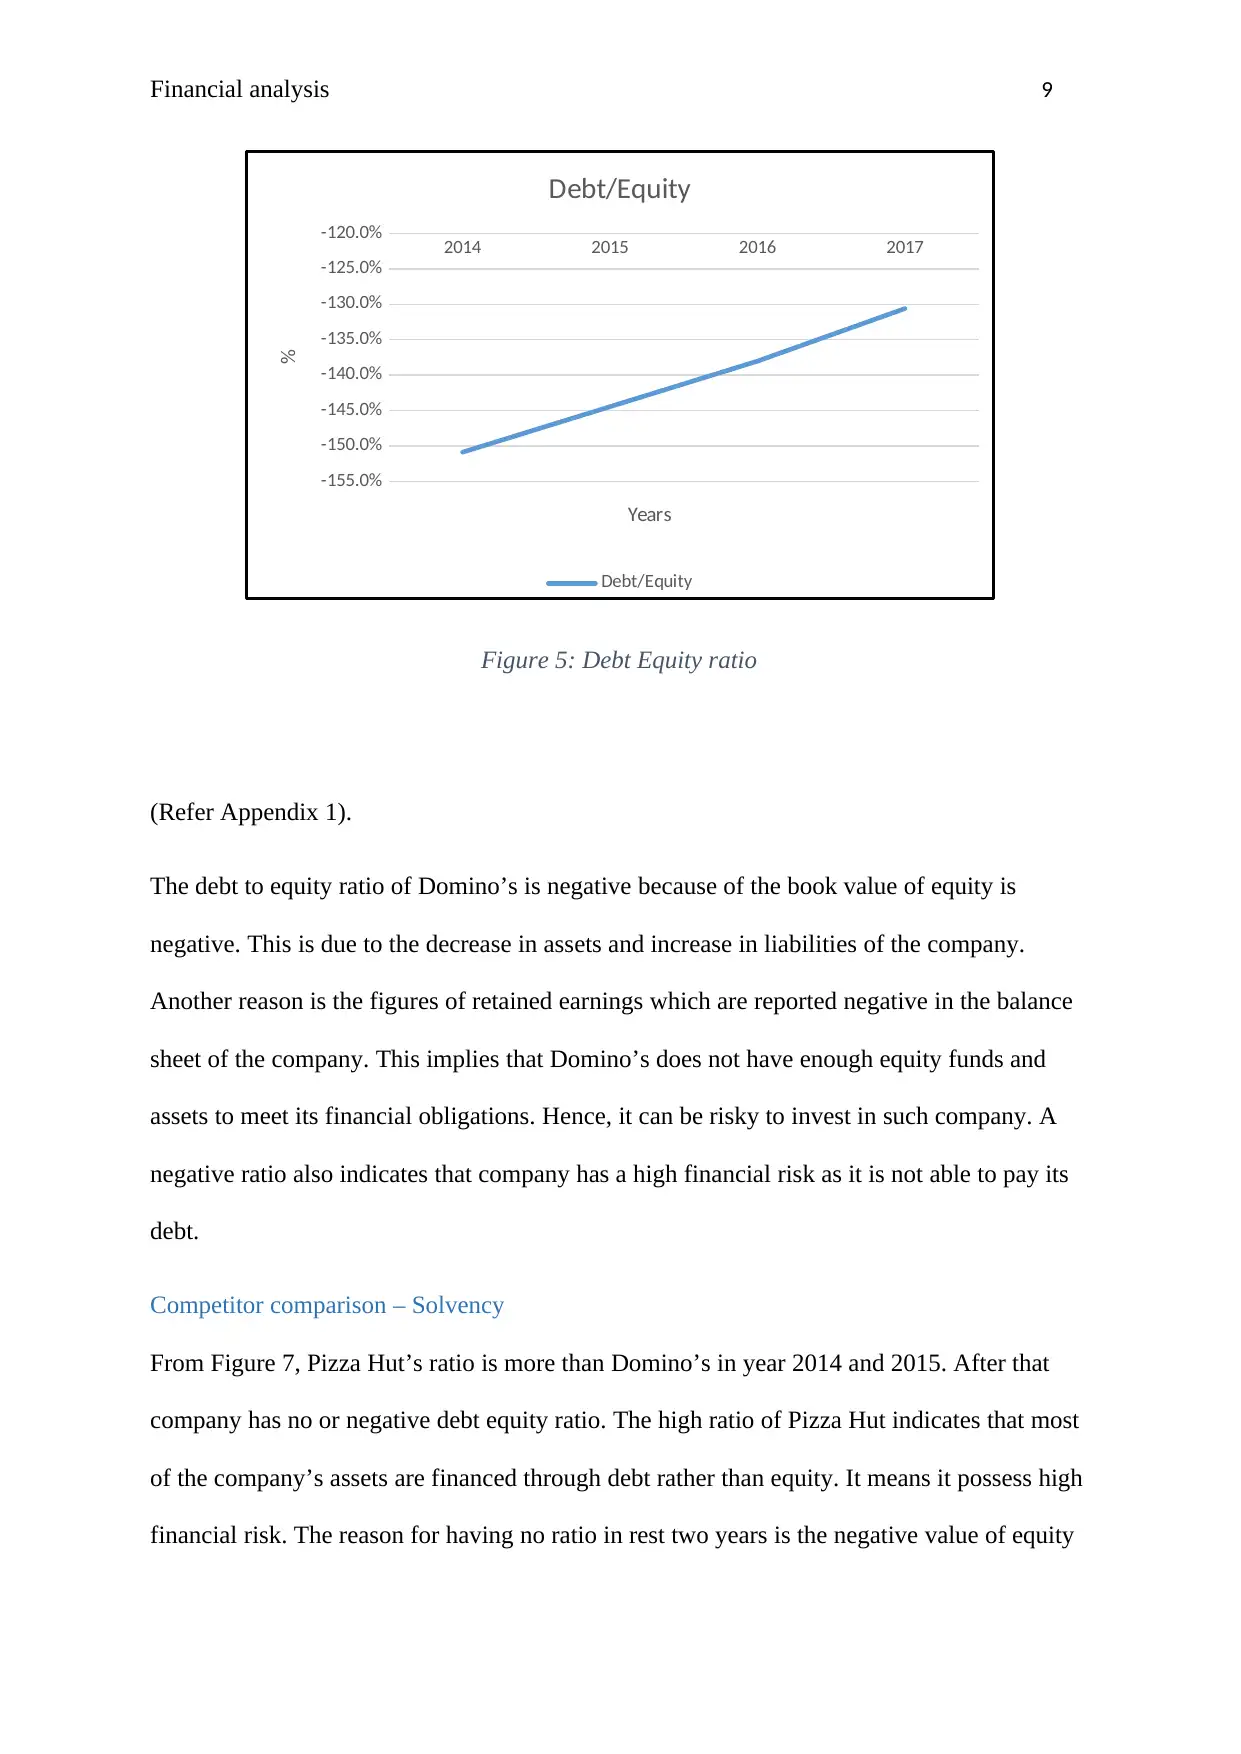
Figure 5: Debt Equity ratio
(Refer Appendix 1).
The debt to equity ratio of Domino’s is negative because of the book value of equity is
negative. This is due to the decrease in assets and increase in liabilities of the company.
Another reason is the figures of retained earnings which are reported negative in the balance
sheet of the company. This implies that Domino’s does not have enough equity funds and
assets to meet its financial obligations. Hence, it can be risky to invest in such company. A
negative ratio also indicates that company has a high financial risk as it is not able to pay its
debt.
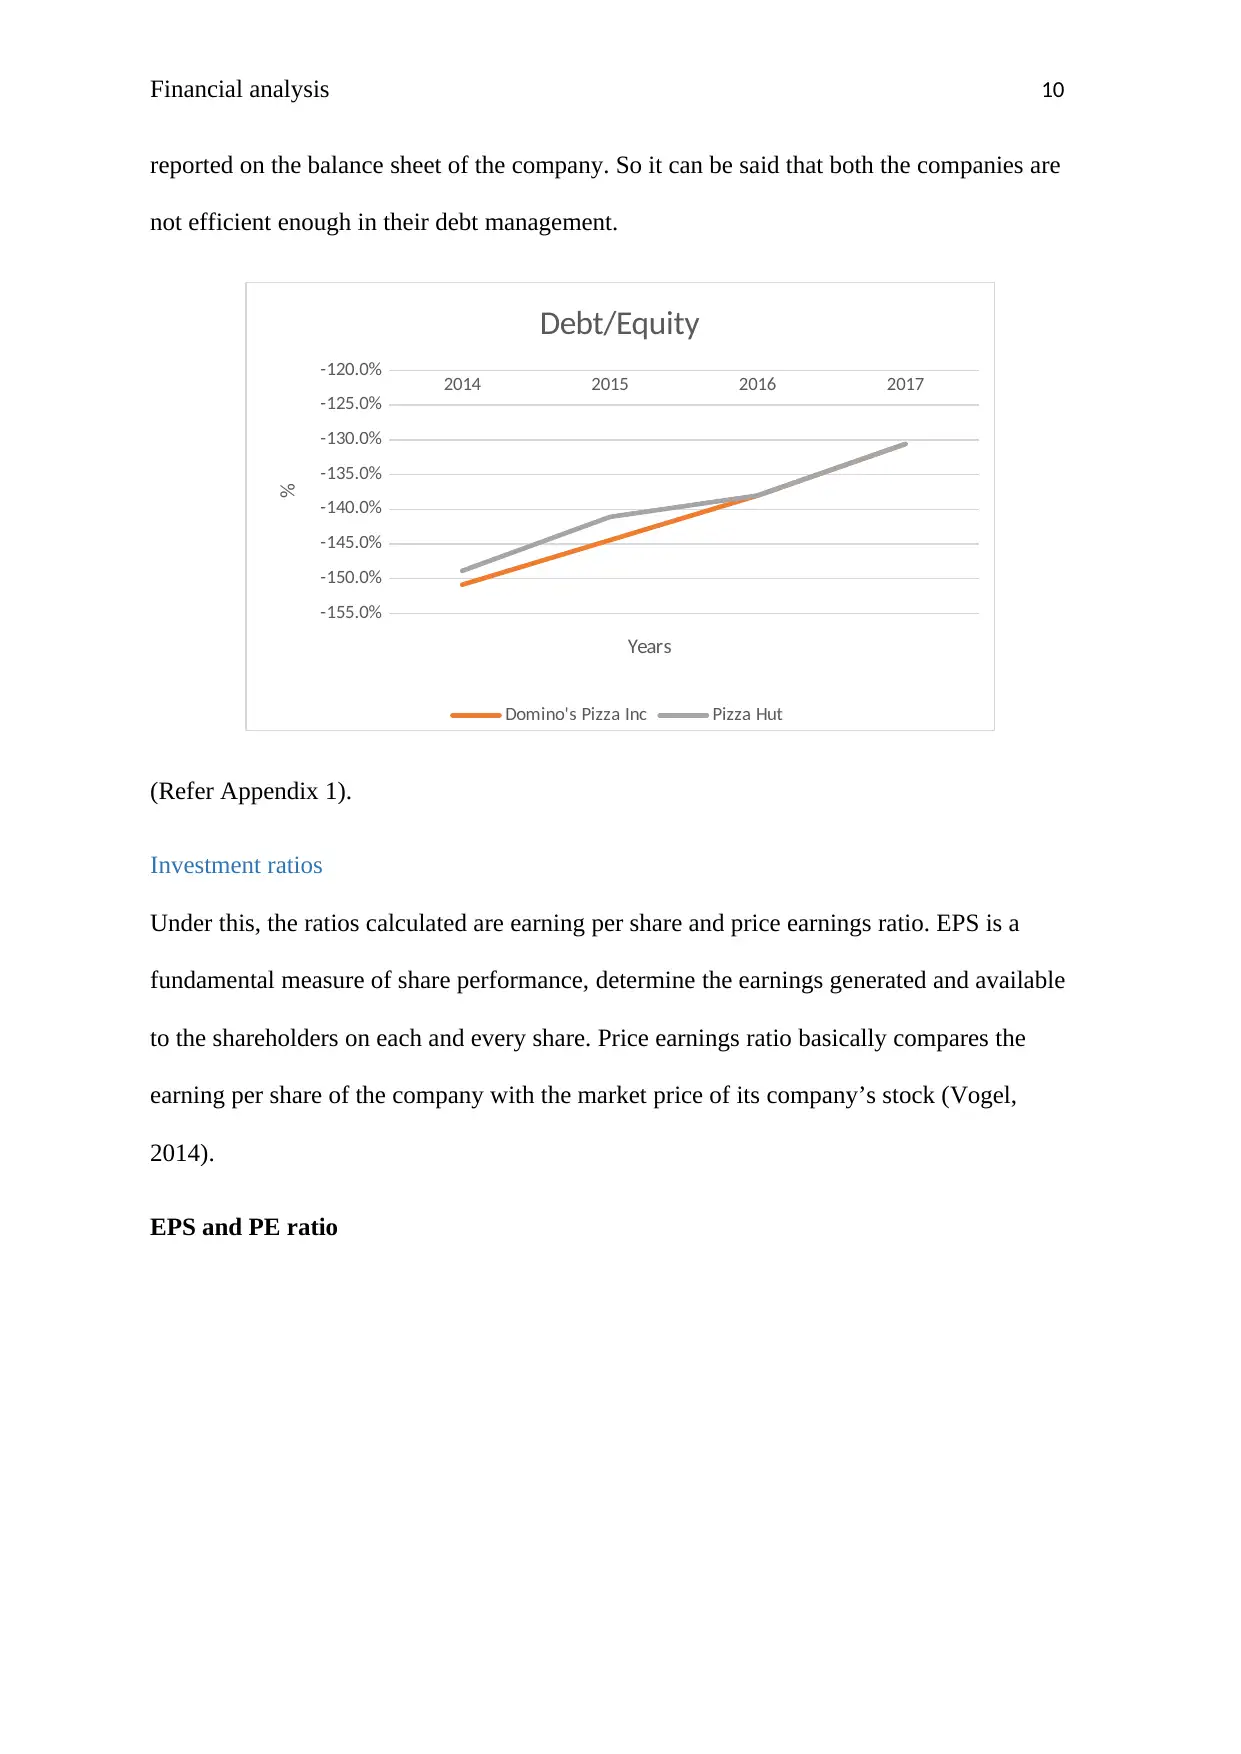
Competitor comparison – Solvency
From Figure 7, Pizza Hut’s ratio is more than Domino’s in year 2014 and 2015. After that
company has no or negative debt equity ratio. The high ratio of Pizza Hut indicates that most
of the company’s assets are financed through debt rather than equity. It means it possess high
financial risk. The reason for having no ratio in rest two years is the negative value of equity
2014 2015 2016 2017
-155.0%
-150.0%
-145.0%
-140.0%
-135.0%
-130.0%
-125.0%
-120.0%
Debt/Equity
Debt/Equity
Years
%
Figure 5: Debt Equity ratio
(Refer Appendix 1).
The debt to equity ratio of Domino’s is negative because of the book value of equity is
negative. This is due to the decrease in assets and increase in liabilities of the company.
Another reason is the figures of retained earnings which are reported negative in the balance
sheet of the company. This implies that Domino’s does not have enough equity funds and
assets to meet its financial obligations. Hence, it can be risky to invest in such company. A
negative ratio also indicates that company has a high financial risk as it is not able to pay its
debt.
Competitor comparison – Solvency
From Figure 7, Pizza Hut’s ratio is more than Domino’s in year 2014 and 2015. After that
company has no or negative debt equity ratio. The high ratio of Pizza Hut indicates that most
of the company’s assets are financed through debt rather than equity. It means it possess high
financial risk. The reason for having no ratio in rest two years is the negative value of equity
Paraphrase This Document
Need a fresh take? Get an instant paraphrase of this document with our AI Paraphraser
Financial analysis 10
reported on the balance sheet of the company. So it can be said that both the companies are
not efficient enough in their debt management.
2014 2015 2016 2017
-155.0%
-150.0%
-145.0%
-140.0%
-135.0%
-130.0%
-125.0%
-120.0%
Debt/Equity
Domino's Pizza Inc Pizza Hut
Years
%
(Refer Appendix 1).
Investment ratios
Under this, the ratios calculated are earning per share and price earnings ratio. EPS is a
fundamental measure of share performance, determine the earnings generated and available
to the shareholders on each and every share. Price earnings ratio basically compares the
earning per share of the company with the market price of its company’s stock (Vogel,
2014).
EPS and PE ratio
Financial analysis 11
2014 2015 2016 2017
0.00
20.00
40.00
60.00
80.00
100.00
120.00
140.00
160.00
180.00
200.00
Investment Ratios
EPS PE Share price
Years
Values
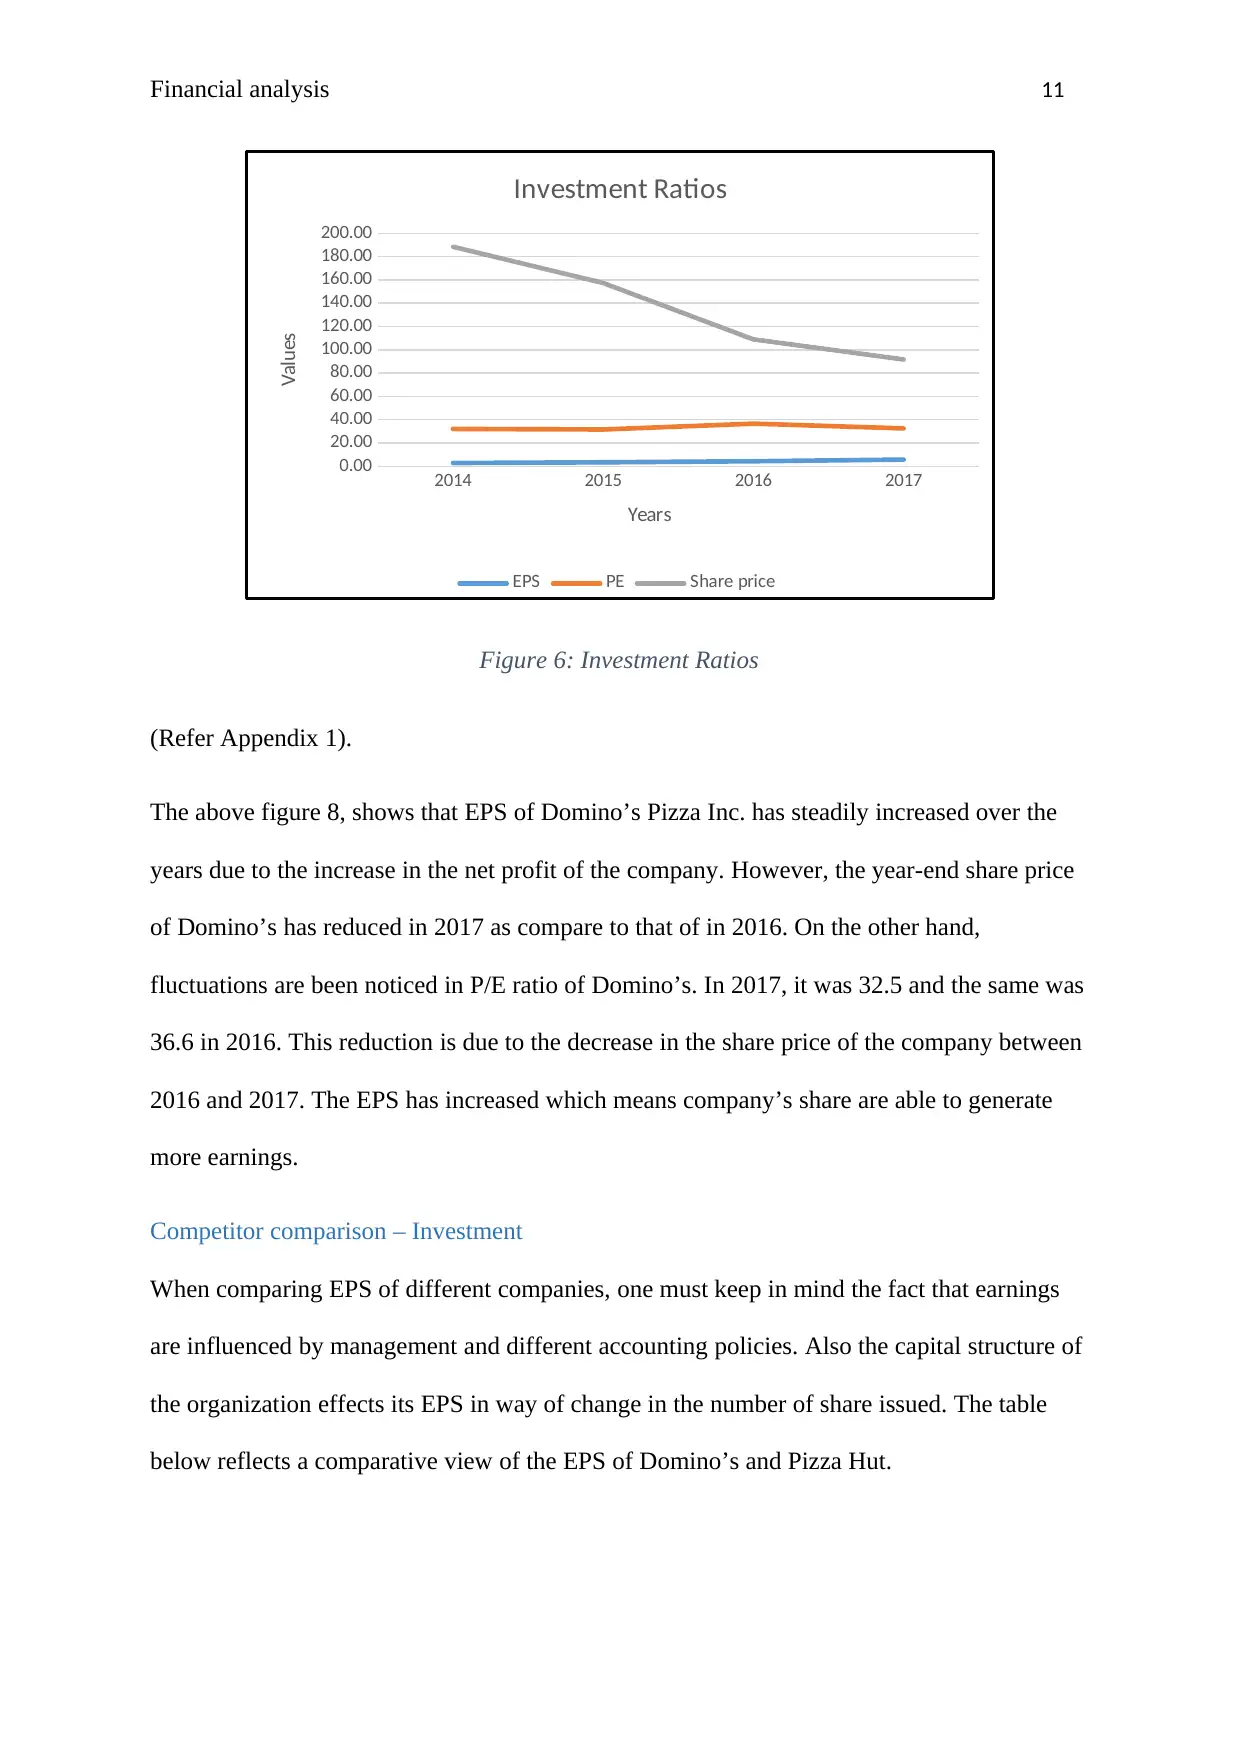
Figure 6: Investment Ratios
(Refer Appendix 1).
The above figure 8, shows that EPS of Domino’s Pizza Inc. has steadily increased over the
years due to the increase in the net profit of the company. However, the year-end share price
of Domino’s has reduced in 2017 as compare to that of in 2016. On the other hand,
fluctuations are been noticed in P/E ratio of Domino’s. In 2017, it was 32.5 and the same was
36.6 in 2016. This reduction is due to the decrease in the share price of the company between
2016 and 2017. The EPS has increased which means company’s share are able to generate
more earnings.
Competitor comparison – Investment
When comparing EPS of different companies, one must keep in mind the fact that earnings
are influenced by management and different accounting policies. Also the capital structure of
the organization effects its EPS in way of change in the number of share issued. The table
below reflects a comparative view of the EPS of Domino’s and Pizza Hut.
2014 2015 2016 2017
0.00
20.00
40.00
60.00
80.00
100.00
120.00
140.00
160.00
180.00
200.00
Investment Ratios
EPS PE Share price
Years
Values
Figure 6: Investment Ratios
(Refer Appendix 1).
The above figure 8, shows that EPS of Domino’s Pizza Inc. has steadily increased over the
years due to the increase in the net profit of the company. However, the year-end share price
of Domino’s has reduced in 2017 as compare to that of in 2016. On the other hand,
fluctuations are been noticed in P/E ratio of Domino’s. In 2017, it was 32.5 and the same was
36.6 in 2016. This reduction is due to the decrease in the share price of the company between
2016 and 2017. The EPS has increased which means company’s share are able to generate
more earnings.
Competitor comparison – Investment
When comparing EPS of different companies, one must keep in mind the fact that earnings
are influenced by management and different accounting policies. Also the capital structure of
the organization effects its EPS in way of change in the number of share issued. The table
below reflects a comparative view of the EPS of Domino’s and Pizza Hut.
⊘ This is a preview!⊘
Do you want full access?
Subscribe today to unlock all pages.
Trusted by 1+ million students worldwide
1 out of 19
Related Documents


Your All-in-One AI-Powered Toolkit for Academic Success.
+13062052269
info@desklib.com
Available 24*7 on WhatsApp / Email
![[object Object]](/_next/static/media/star-bottom.7253800d.svg)
Unlock your academic potential
Copyright © 2020–2026 A2Z Services. All Rights Reserved. Developed and managed by ZUCOL.