Domino's Pizza Group PLC: Analyzing Financial Health & Performance
VerifiedAdded on 2024/07/18
|22
|4321
|91
Report
AI Summary
This report provides an in-depth financial analysis of Domino's Pizza Group PLC, examining recent global developments impacting the company, its dividend policy, sources of finance, and key financial ratios. The analysis covers the impact of global inflation and shifting consumer demand on Domino's financial performance, strategic responses to these challenges, and an evaluation of its dividend policy in the context of dividend relevance theories. Furthermore, the report explores Domino's capital structure, highlighting its reliance on debt financing and the implications of negative equity values. Through financial ratio analysis, including profitability, liquidity, gearing, and efficiency ratios, the report assesses Domino's financial health and strategic direction, concluding with insights into areas for improvement and long-term financial stability. This document is available on Desklib, a platform offering a range of study tools and solved assignments for students.
Paraphrase This Document
Need a fresh take? Get an instant paraphrase of this document with our AI Paraphraser
TABLE OF CONTENTS
INTRODUCTION......................................................................................................................1
SECTION A: RECENT DEVELOPMENTS.............................................................................1
DEVELOPMENT ONE: GLOBAL INFLATION AND FOOD PRICE DYNAMICS.........1
DEVELOPMENT TWO: SHIFTING CONSUMER DEMAND AND INDUSTRY
GROWTH.............................................................................................................................. 3
SECTION B: DIVIDEND POLICY AND SOURCES OF FINANCE.....................................4
DIVIDEND POLICY.............................................................................................................4
SOURCES OF FINANCE..................................................................................................... 5
SECTION C: FINANCIAL RATIO ANALYSIS.......................................................................8
PROFITABILITY RATIOS................................................................................................... 8
LIQUIDITY RATIOS.......................................................................................................... 10
GEARING RATIOS.............................................................................................................12
EFFICIENCY RATIOS........................................................................................................12
CONCLUSION........................................................................................................................ 14
REFERENCES.........................................................................................................................16
APPENDIX- A......................................................................................................................... 18
APPENDIX- B......................................................................................................................... 19
INTRODUCTION
Domino's Pizza Group PLC, commonly referred to as Domino's, is a leading player in the fast-
food industry, specialising in pizza delivery and takeaway services. The company has navigated
a challenging yet opportunistic business landscape in the last two years. Financially, Domino's
reported a profit after tax of £78.3 million in 2021 and £81.6 million in 2022, showcasing its
resilience and adaptability in a dynamic market environment (Annual report, 2022). This report
aims to provide an in-depth analysis of Domino's recent financial performance, including the
impact of major global developments on the company, an examination of its dividend policy,
sources of finance, and various financial ratios. By exploring these aspects, the report aims to
offer a comprehensive understanding of Domino's financial health and strategic direction in the
context of prevailing economic conditions and its operational strategies.
SECTION A: RECENT DEVELOPMENTS
Domino's Pizza Group PLC (Domino) has been influenced by two significant global economic
developments that have impacted the food and restaurant industry in 2023. These developments
have led to challenges and opportunities for Domino's, affecting its financial performance and
necessitating strategic responses.
DEVELOPMENT ONE: GLOBAL INFLATION AND FOOD PRICE DYNAMICS
DESCRIPTION
In 2023, the global economy experienced significant inflation, impacting the food industry.
Globally, domestic food inflation averaged 13.0% in June 2023, down from a peak of 16.9% in
December 2022, but still represents a substantial cost increase (UN, 2023). This inflationary
pressure affects costs for ingredients and operational expenses in the food and restaurant
industry.
⊘ This is a preview!⊘
Do you want full access?
Subscribe today to unlock all pages.
Trusted by 1+ million students worldwide
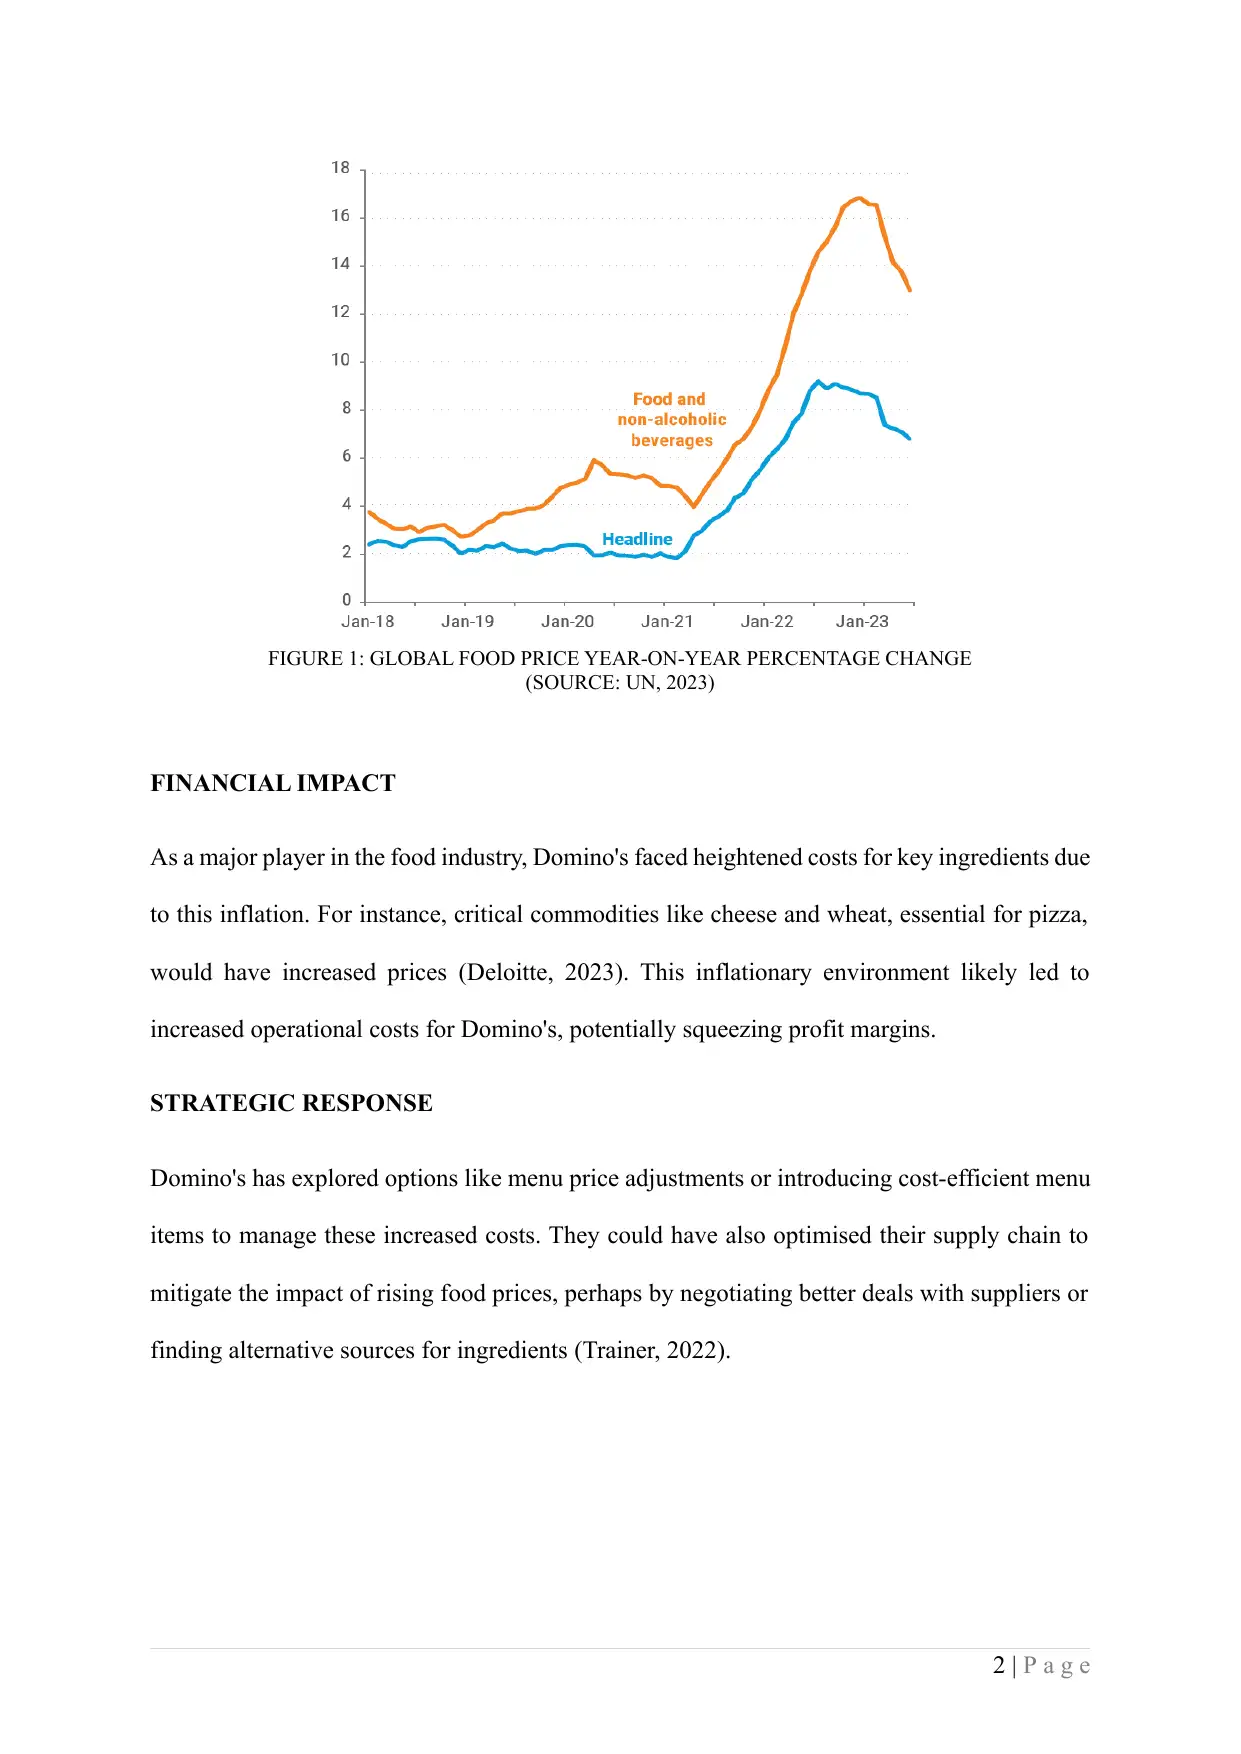
FIGURE 1: GLOBAL FOOD PRICE YEAR-ON-YEAR PERCENTAGE CHANGE
(SOURCE: UN, 2023)
FINANCIAL IMPACT
As a major player in the food industry, Domino's faced heightened costs for key ingredients due
to this inflation. For instance, critical commodities like cheese and wheat, essential for pizza,
would have increased prices (Deloitte, 2023). This inflationary environment likely led to
increased operational costs for Domino's, potentially squeezing profit margins.
STRATEGIC RESPONSE
Domino's has explored options like menu price adjustments or introducing cost-efficient menu
items to manage these increased costs. They could have also optimised their supply chain to
mitigate the impact of rising food prices, perhaps by negotiating better deals with suppliers or
finding alternative sources for ingredients (Trainer, 2022).
2 | P a g e
Paraphrase This Document
Need a fresh take? Get an instant paraphrase of this document with our AI Paraphraser
DEVELOPMENT TWO: SHIFTING CONSUMER DEMAND AND INDUSTRY
GROWTH
DESCRIPTION
Despite economic challenges, consumer interest in restaurant experiences remained robust in
2023. The restaurant industry was projected to reach $997 billion in sales, partly driven by
higher menu prices. This growth was fuelled by consumers' preference for dining out over
cooking at home, with 84% of consumers stating that going to a restaurant is a better use of their
leisure time than cooking and cleaning up (National Restaurant Association, 2023).
FINANCIAL IMPACT
This shift in consumer behaviour presented an opportunity for Domino's to increase sales and
revenue. The strong consumer demand for restaurant experiences could have translated into
higher foot traffic in Domino's outlets and increased orders, especially in regions with a robust
dining-out culture (Hernandez, 2022).
STRATEGIC RESPONSE
To capitalise on this trend, Domino's might have focused on enhancing the in-store dining
experience and improving their delivery services. For instance, they could have introduced new
menu items, limited-time offers, or promotional deals to attract customers (Light, 2020).
Investing in digital ordering platforms and marketing campaigns could have helped them tap
into the growing consumer demand more effectively.
3 | P a g e
SECTION B: DIVIDEND POLICY AND SOURCES OF FINANCE
DIVIDEND POLICY
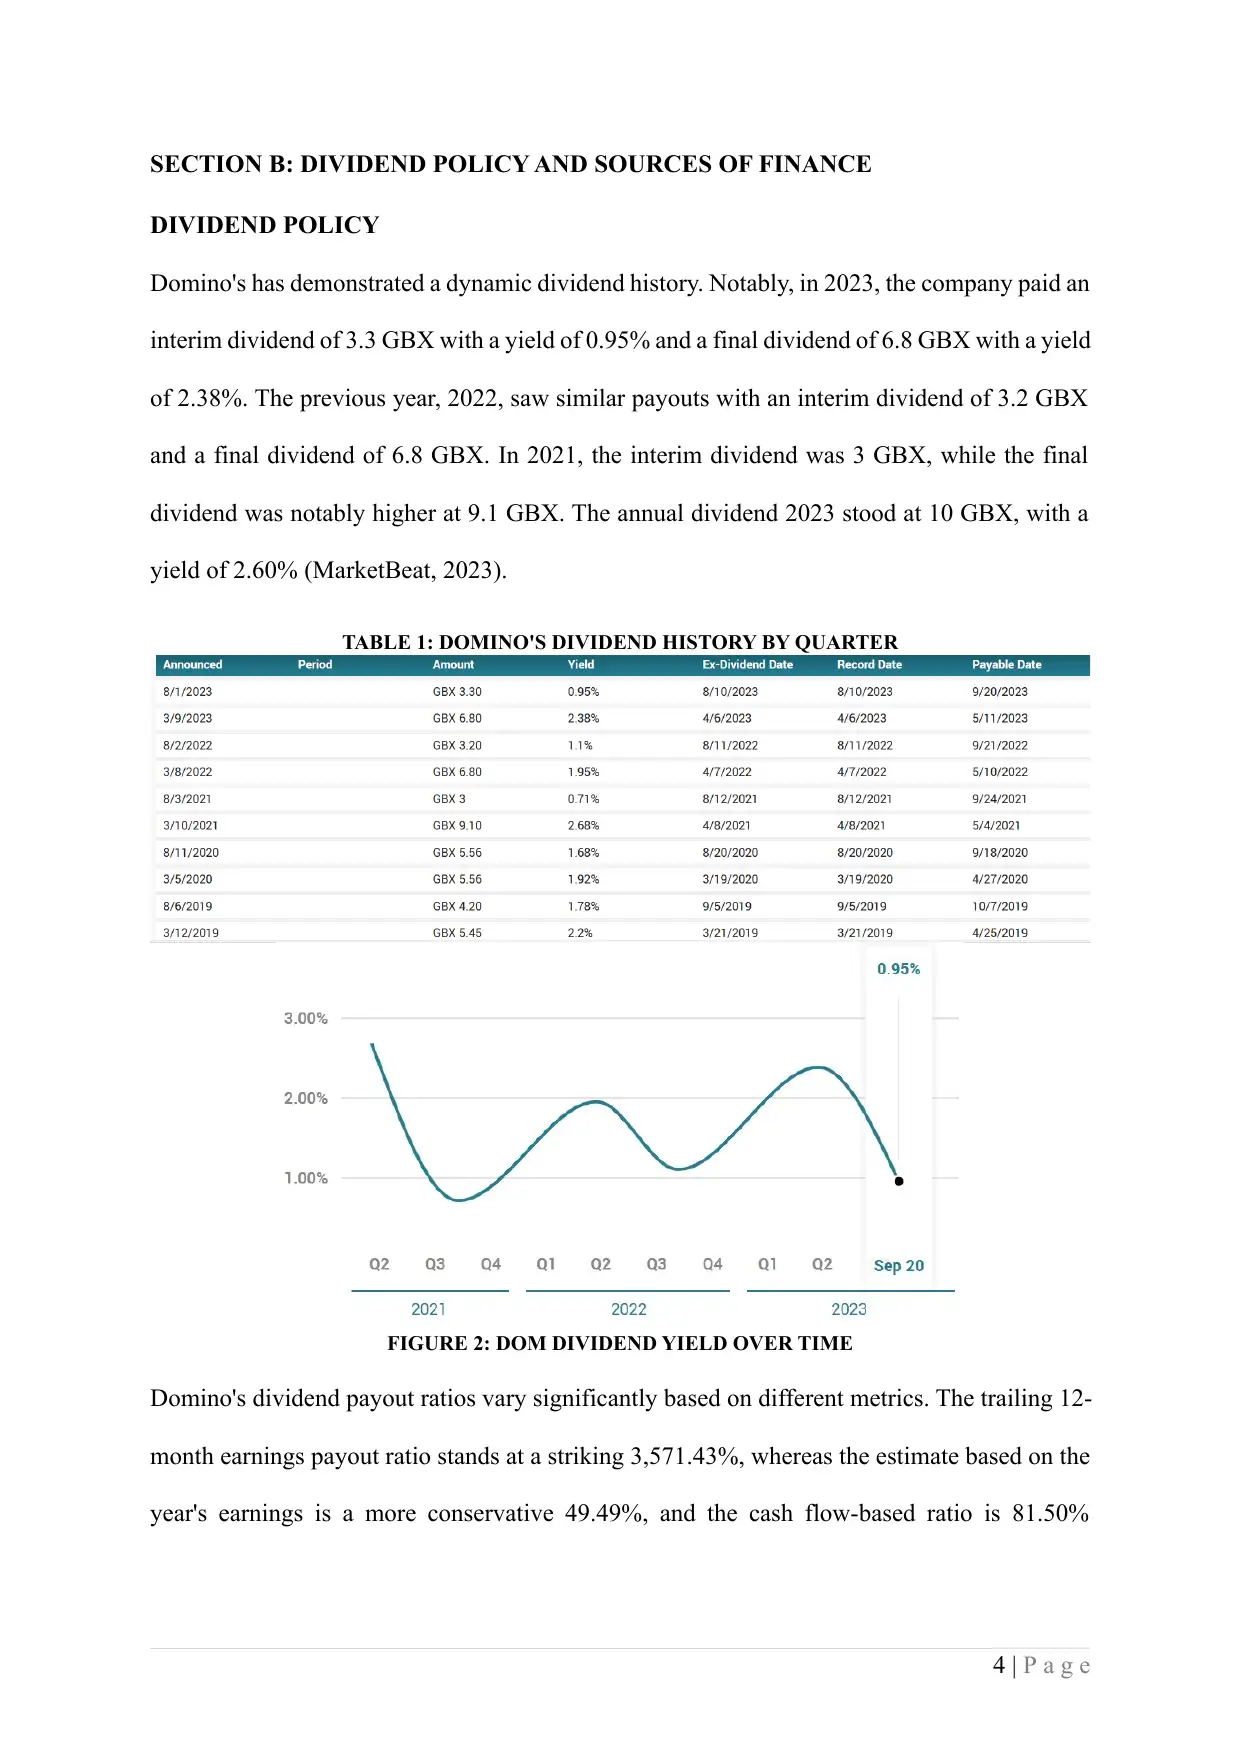
Domino's has demonstrated a dynamic dividend history. Notably, in 2023, the company paid an
interim dividend of 3.3 GBX with a yield of 0.95% and a final dividend of 6.8 GBX with a yield
of 2.38%. The previous year, 2022, saw similar payouts with an interim dividend of 3.2 GBX
and a final dividend of 6.8 GBX. In 2021, the interim dividend was 3 GBX, while the final
dividend was notably higher at 9.1 GBX. The annual dividend 2023 stood at 10 GBX, with a
yield of 2.60% (MarketBeat, 2023).
TABLE 1: DOMINO'S DIVIDEND HISTORY BY QUARTER
FIGURE 2: DOM DIVIDEND YIELD OVER TIME
Domino's dividend payout ratios vary significantly based on different metrics. The trailing 12-
month earnings payout ratio stands at a striking 3,571.43%, whereas the estimate based on the
year's earnings is a more conservative 49.49%, and the cash flow-based ratio is 81.50%
4 | P a g e
DIVIDEND POLICY
Domino's has demonstrated a dynamic dividend history. Notably, in 2023, the company paid an
interim dividend of 3.3 GBX with a yield of 0.95% and a final dividend of 6.8 GBX with a yield
of 2.38%. The previous year, 2022, saw similar payouts with an interim dividend of 3.2 GBX
and a final dividend of 6.8 GBX. In 2021, the interim dividend was 3 GBX, while the final
dividend was notably higher at 9.1 GBX. The annual dividend 2023 stood at 10 GBX, with a
yield of 2.60% (MarketBeat, 2023).
TABLE 1: DOMINO'S DIVIDEND HISTORY BY QUARTER
FIGURE 2: DOM DIVIDEND YIELD OVER TIME
Domino's dividend payout ratios vary significantly based on different metrics. The trailing 12-
month earnings payout ratio stands at a striking 3,571.43%, whereas the estimate based on the
year's earnings is a more conservative 49.49%, and the cash flow-based ratio is 81.50%
4 | P a g e
⊘ This is a preview!⊘
Do you want full access?
Subscribe today to unlock all pages.
Trusted by 1+ million students worldwide
(MarketBeat, 2023). This variance indicates a flexible approach to dividend distribution,
focusing on balancing shareholder returns with reinvestment for growth.
Domino's dividend policy can be analysed in the context of dividend theories. There are two
major dividend theories. Dividend relevance theories, including the Traditional, Walter, and
Gordon models, suggest that dividends impact the company's market value. Dividend
Irrelevance theories, particularly the Modigliani and Miller (MM) approach, argue that
dividend distribution is irrelevant in determining a company's market value (Finance
Management, 2023). Given the company's record of consistent dividend growth over the years,
with an average 10-year growth rate above 20% YoY, Domino's dividend policy aligns more
closely with dividend relevance theories. This approach, backed by the company's strong
financial performance and market growth, reinforces the importance of dividends in its
corporate finance strategy.
SOURCES OF FINANCE
Domino's has a complex capital structure that reflects its strategic financial management
decisions over recent years. The company's sources of finance are a mix of equity and debt, with
significant changes observed in these elements.
Starting with equity, the company's share capital has shown stability. Still, the additional paid-
in capital, which has remained constant at 49.6 million GBP for 2020 to 2022, indicates no
significant fresh equity infusion. However, a crucial concern is the substantial increase in the
accumulated deficit, growing from -51.1 million GBP in 2020 to -156.6 million GBP in 2022
(Annual report, 2023). This trend suggests that Domino's has been either reinvesting its
earnings into the business or covering operational losses, leading to a decrease in retained
earnings. The negative total equity values, which have been growing more negative over the
5 | P a g e
Paraphrase This Document
Need a fresh take? Get an instant paraphrase of this document with our AI Paraphraser
years, are a strong indicator of financial distress or a deliberate strategy of using profits for
reinvestment or debt repayment rather than dividends (Charles et al., 2021).
In terms of non-current liabilities, there has been a notable decrease in long-term debt from
452.3 million GBP in 2020 to 283.7 million GBP in 2022 (Investing.com, 2023). This reduction
indicates that Domino's has been paying or refinancing its long-term debts under more
favourable terms. However, the capital lease obligations have remained consistently high,
around 203 million GBP, suggesting a strategic reliance on leasing as a financing tool. This
could be a deliberate choice to keep the liquidity for operational needs or expansion plans rather
than investing heavily in fixed assets.
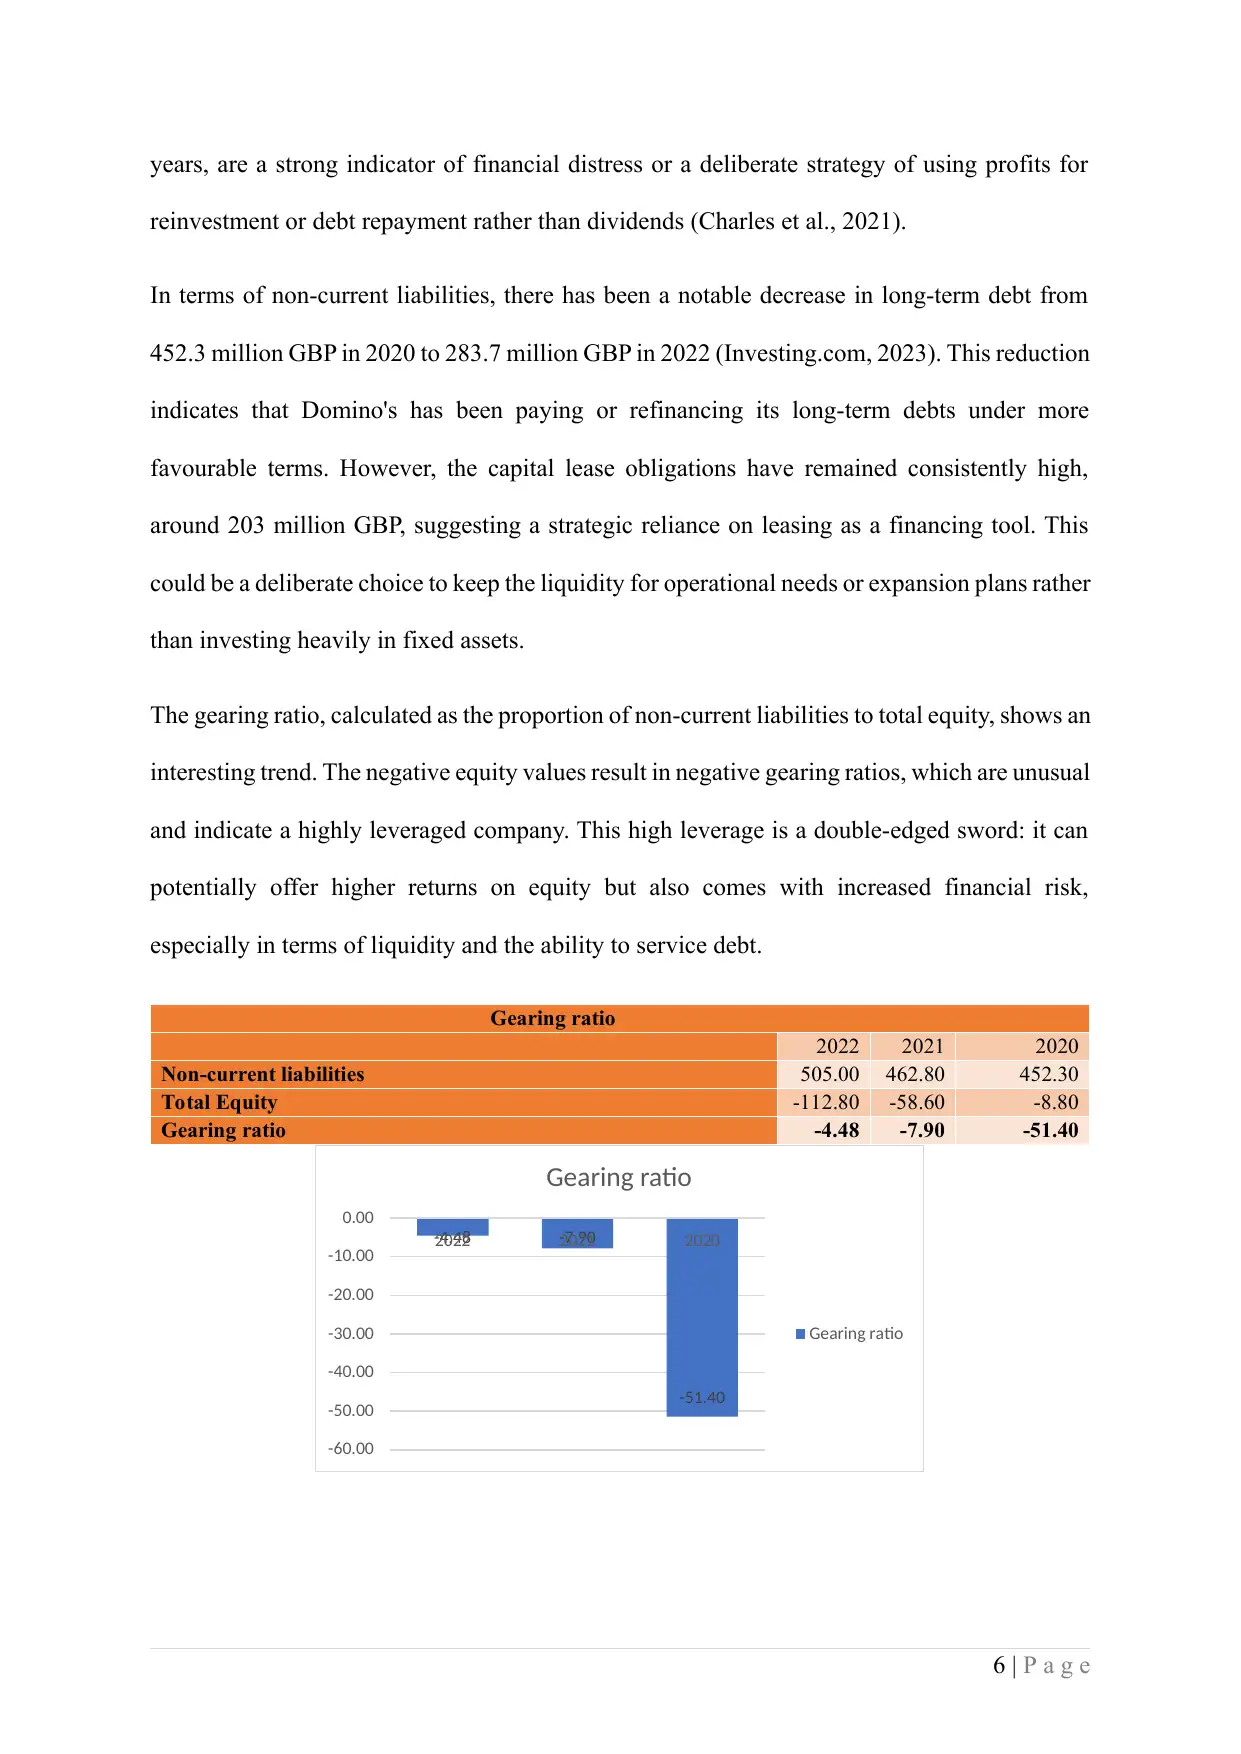
The gearing ratio, calculated as the proportion of non-current liabilities to total equity, shows an
interesting trend. The negative equity values result in negative gearing ratios, which are unusual
and indicate a highly leveraged company. This high leverage is a double-edged sword: it can
potentially offer higher returns on equity but also comes with increased financial risk,
especially in terms of liquidity and the ability to service debt.
Gearing ratio
2022 2021 2020
Non-current liabilities 505.00 462.80 452.30
Total Equity -112.80 -58.60 -8.80
Gearing ratio -4.48 -7.90 -51.40
-4.48 -7.90
-51.40
-60.00
-50.00
-40.00
-30.00
-20.00
-10.00
0.00
2022 2021 2020
Gearing ratio
Gearing ratio
6 | P a g e
reinvestment or debt repayment rather than dividends (Charles et al., 2021).
In terms of non-current liabilities, there has been a notable decrease in long-term debt from
452.3 million GBP in 2020 to 283.7 million GBP in 2022 (Investing.com, 2023). This reduction
indicates that Domino's has been paying or refinancing its long-term debts under more
favourable terms. However, the capital lease obligations have remained consistently high,
around 203 million GBP, suggesting a strategic reliance on leasing as a financing tool. This
could be a deliberate choice to keep the liquidity for operational needs or expansion plans rather
than investing heavily in fixed assets.
The gearing ratio, calculated as the proportion of non-current liabilities to total equity, shows an
interesting trend. The negative equity values result in negative gearing ratios, which are unusual
and indicate a highly leveraged company. This high leverage is a double-edged sword: it can
potentially offer higher returns on equity but also comes with increased financial risk,
especially in terms of liquidity and the ability to service debt.
Gearing ratio
2022 2021 2020
Non-current liabilities 505.00 462.80 452.30
Total Equity -112.80 -58.60 -8.80
Gearing ratio -4.48 -7.90 -51.40
-4.48 -7.90
-51.40
-60.00
-50.00
-40.00
-30.00
-20.00
-10.00
0.00
2022 2021 2020
Gearing ratio
Gearing ratio
6 | P a g e
Given these aspects of Domino's capital structure, the Modigliani and Miller (M&M) view of
capital structure theory seems more applicable. According to this theory, the capital structure is
irrelevant to the company's value in perfect market conditions. In Domino's case, the focus is on
leveraging debt to optimise operational performance and growth potential rather than
maintaining a balanced mix of equity and debt. However, this high level of gearing comes with
its own set of challenges and risks. It can make the company's capital structure riskier,
particularly in situations of market volatility or downturns in the business. The company's
heavy reliance on debt financing, including long-term obligations and lease financing, must be
managed carefully to ensure long-term financial stability and avoid liquidity crunches.
Moreover, the negative equity values raise concerns about the company's long-term financial
health and ability to finance its operations and growth strategies sustainably.
Domino's financial strategy reflects a high reliance on debt financing, with a significant part of
its capital structure comprising long-term debt and lease obligations. This approach aligns with
the M&M view, focusing on leveraging and operational efficiency. However, the negative
equity values and high gearing ratio highlight the need for careful financial management to
maintain stability and support growth.
7 | P a g e
⊘ This is a preview!⊘
Do you want full access?
Subscribe today to unlock all pages.
Trusted by 1+ million students worldwide
SECTION C: FINANCIAL RATIO ANALYSIS
PROFITABILITY RATIOS
RETURN ON CAPITAL EMPLOYED (ROCE)
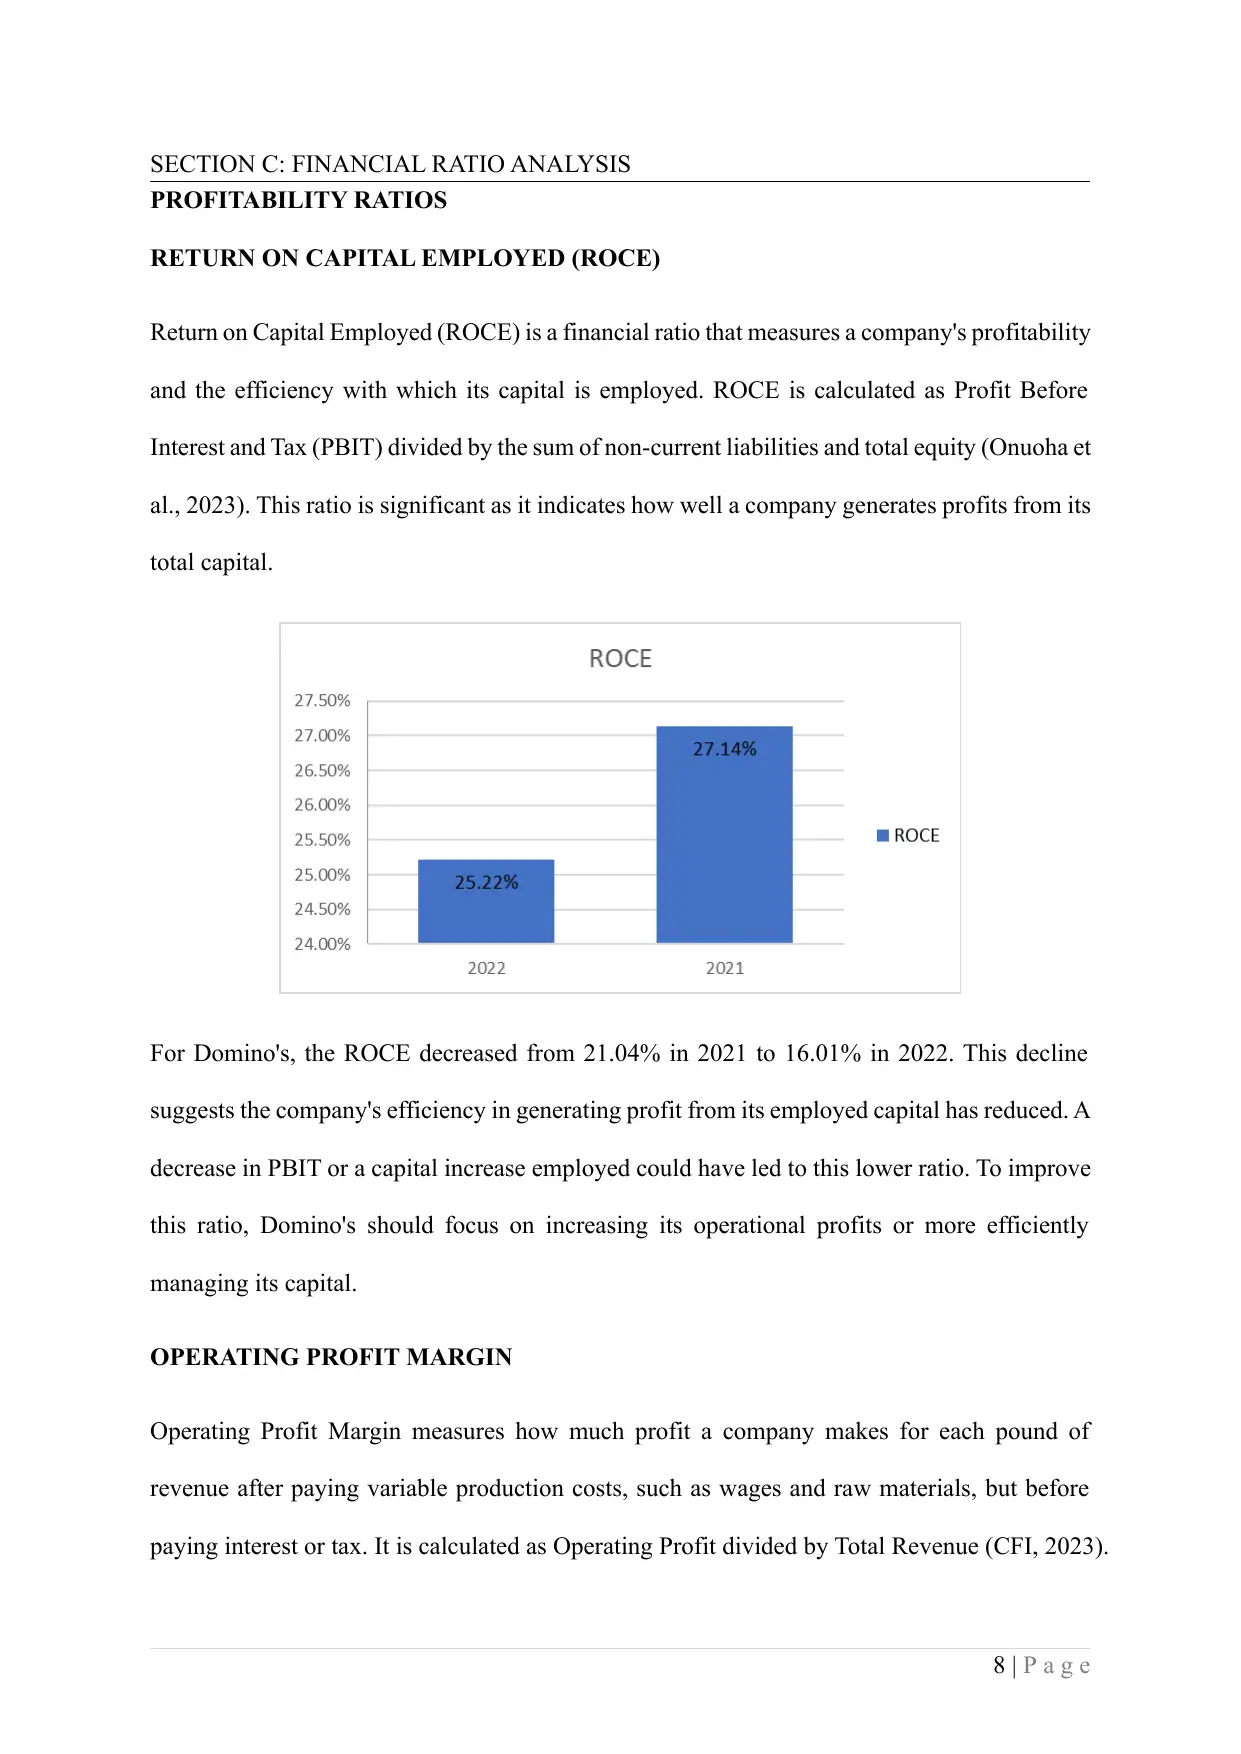
Return on Capital Employed (ROCE) is a financial ratio that measures a company's profitability
and the efficiency with which its capital is employed. ROCE is calculated as Profit Before
Interest and Tax (PBIT) divided by the sum of non-current liabilities and total equity (Onuoha et
al., 2023). This ratio is significant as it indicates how well a company generates profits from its
total capital.
For Domino's, the ROCE decreased from 21.04% in 2021 to 16.01% in 2022. This decline
suggests the company's efficiency in generating profit from its employed capital has reduced. A
decrease in PBIT or a capital increase employed could have led to this lower ratio. To improve
this ratio, Domino's should focus on increasing its operational profits or more efficiently
managing its capital.
OPERATING PROFIT MARGIN
Operating Profit Margin measures how much profit a company makes for each pound of
revenue after paying variable production costs, such as wages and raw materials, but before
paying interest or tax. It is calculated as Operating Profit divided by Total Revenue (CFI, 2023).
8 | P a g e
PROFITABILITY RATIOS
RETURN ON CAPITAL EMPLOYED (ROCE)
Return on Capital Employed (ROCE) is a financial ratio that measures a company's profitability
and the efficiency with which its capital is employed. ROCE is calculated as Profit Before
Interest and Tax (PBIT) divided by the sum of non-current liabilities and total equity (Onuoha et
al., 2023). This ratio is significant as it indicates how well a company generates profits from its
total capital.
For Domino's, the ROCE decreased from 21.04% in 2021 to 16.01% in 2022. This decline
suggests the company's efficiency in generating profit from its employed capital has reduced. A
decrease in PBIT or a capital increase employed could have led to this lower ratio. To improve
this ratio, Domino's should focus on increasing its operational profits or more efficiently
managing its capital.
OPERATING PROFIT MARGIN
Operating Profit Margin measures how much profit a company makes for each pound of
revenue after paying variable production costs, such as wages and raw materials, but before
paying interest or tax. It is calculated as Operating Profit divided by Total Revenue (CFI, 2023).
8 | P a g e
Paraphrase This Document
Need a fresh take? Get an instant paraphrase of this document with our AI Paraphraser
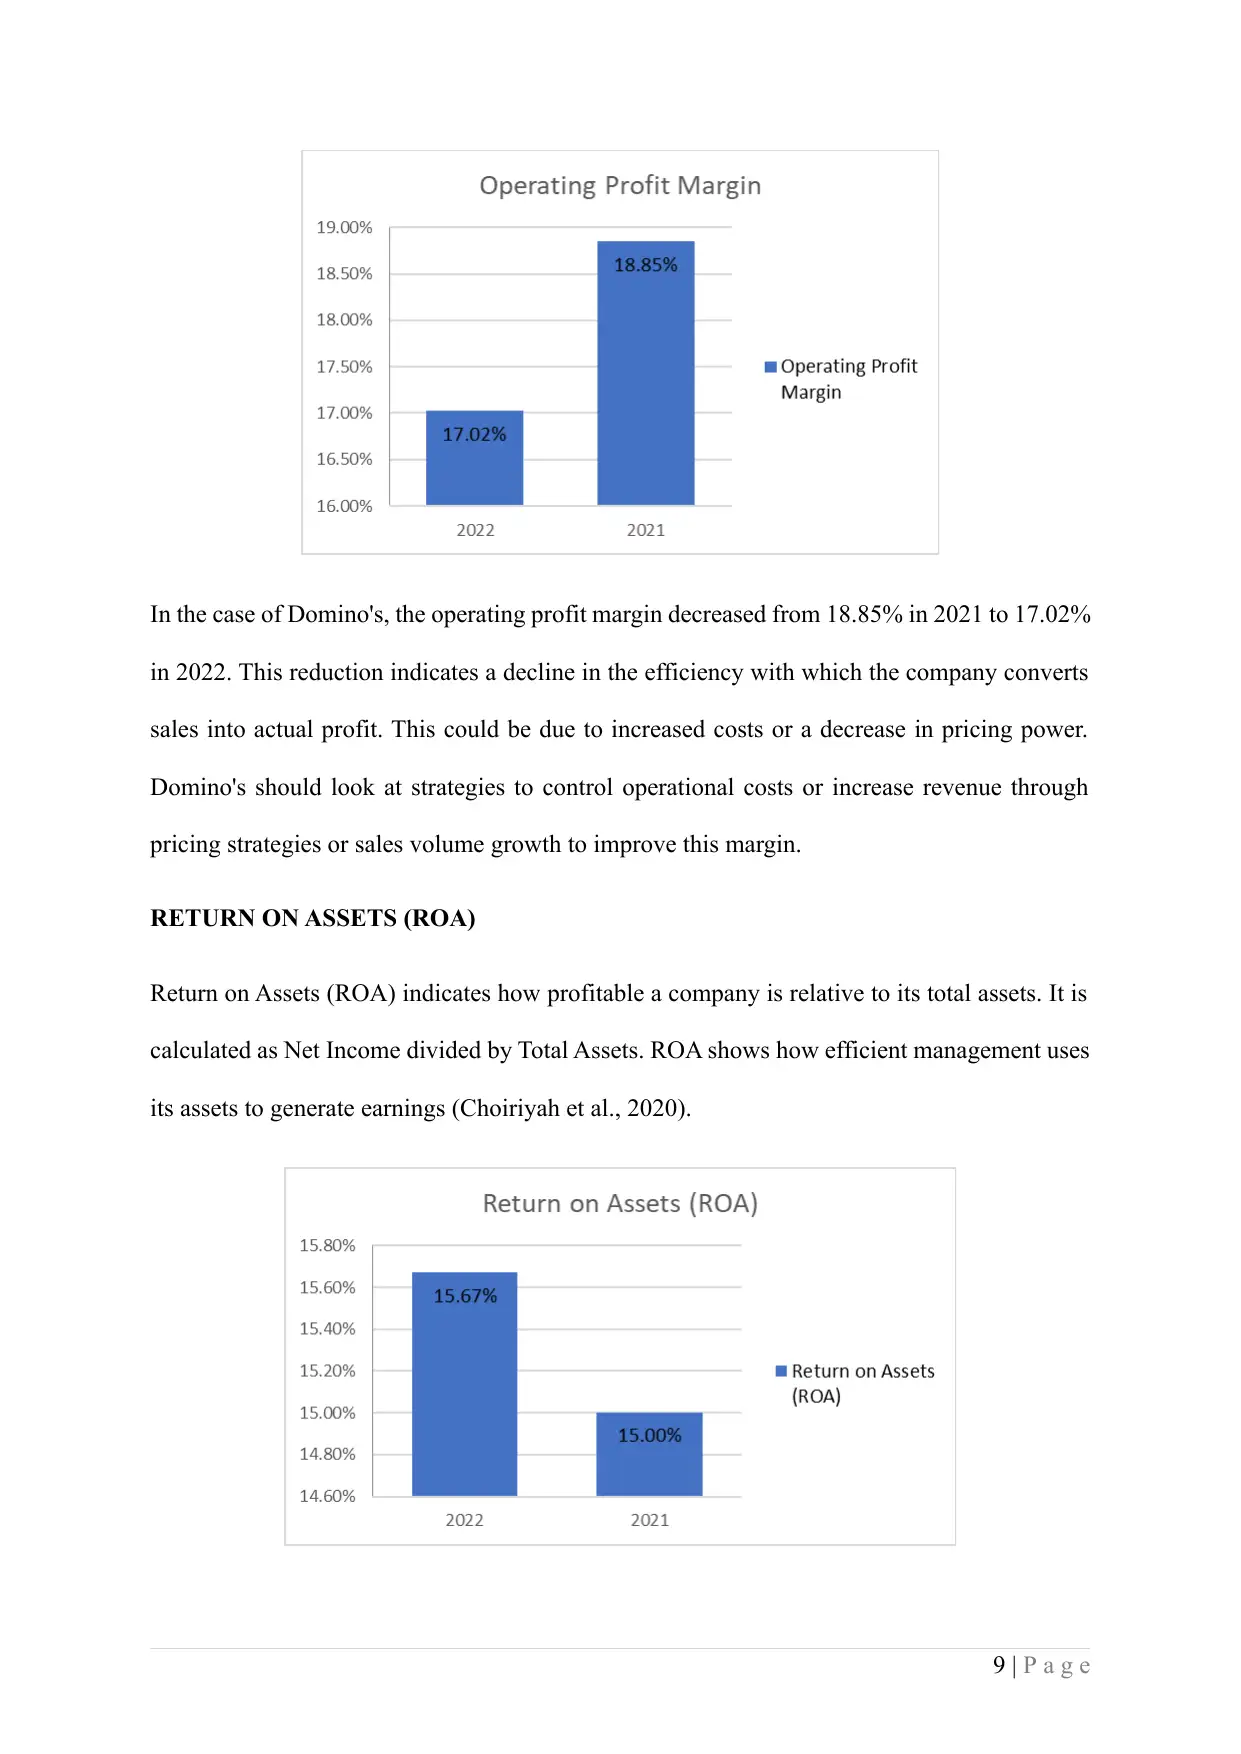
In the case of Domino's, the operating profit margin decreased from 18.85% in 2021 to 17.02%
in 2022. This reduction indicates a decline in the efficiency with which the company converts
sales into actual profit. This could be due to increased costs or a decrease in pricing power.
Domino's should look at strategies to control operational costs or increase revenue through
pricing strategies or sales volume growth to improve this margin.
RETURN ON ASSETS (ROA)
Return on Assets (ROA) indicates how profitable a company is relative to its total assets. It is
calculated as Net Income divided by Total Assets. ROA shows how efficient management uses
its assets to generate earnings (Choiriyah et al., 2020).
9 | P a g e
For Domino's, the ROA slightly increased from 15.00% in 2021 to 15.67% in 2022. This
improvement suggests that the company has become more efficient at using its assets to
generate net income. Domino's should continue to focus on effectively utilising its assets or
increasing its net income to enhance this ratio further.
While Domino's shows a solid capacity to produce a profit in proportion to its assets and capital
employed, the slight decrease in ROCE and Operating Profit Margin in 2022 indicates areas for
improvement. Focusing on operational efficiency, cost management, and asset utilisation can
help Domino's enhance its profitability ratios.
LIQUIDITY RATIOS
CURRENT RATIO
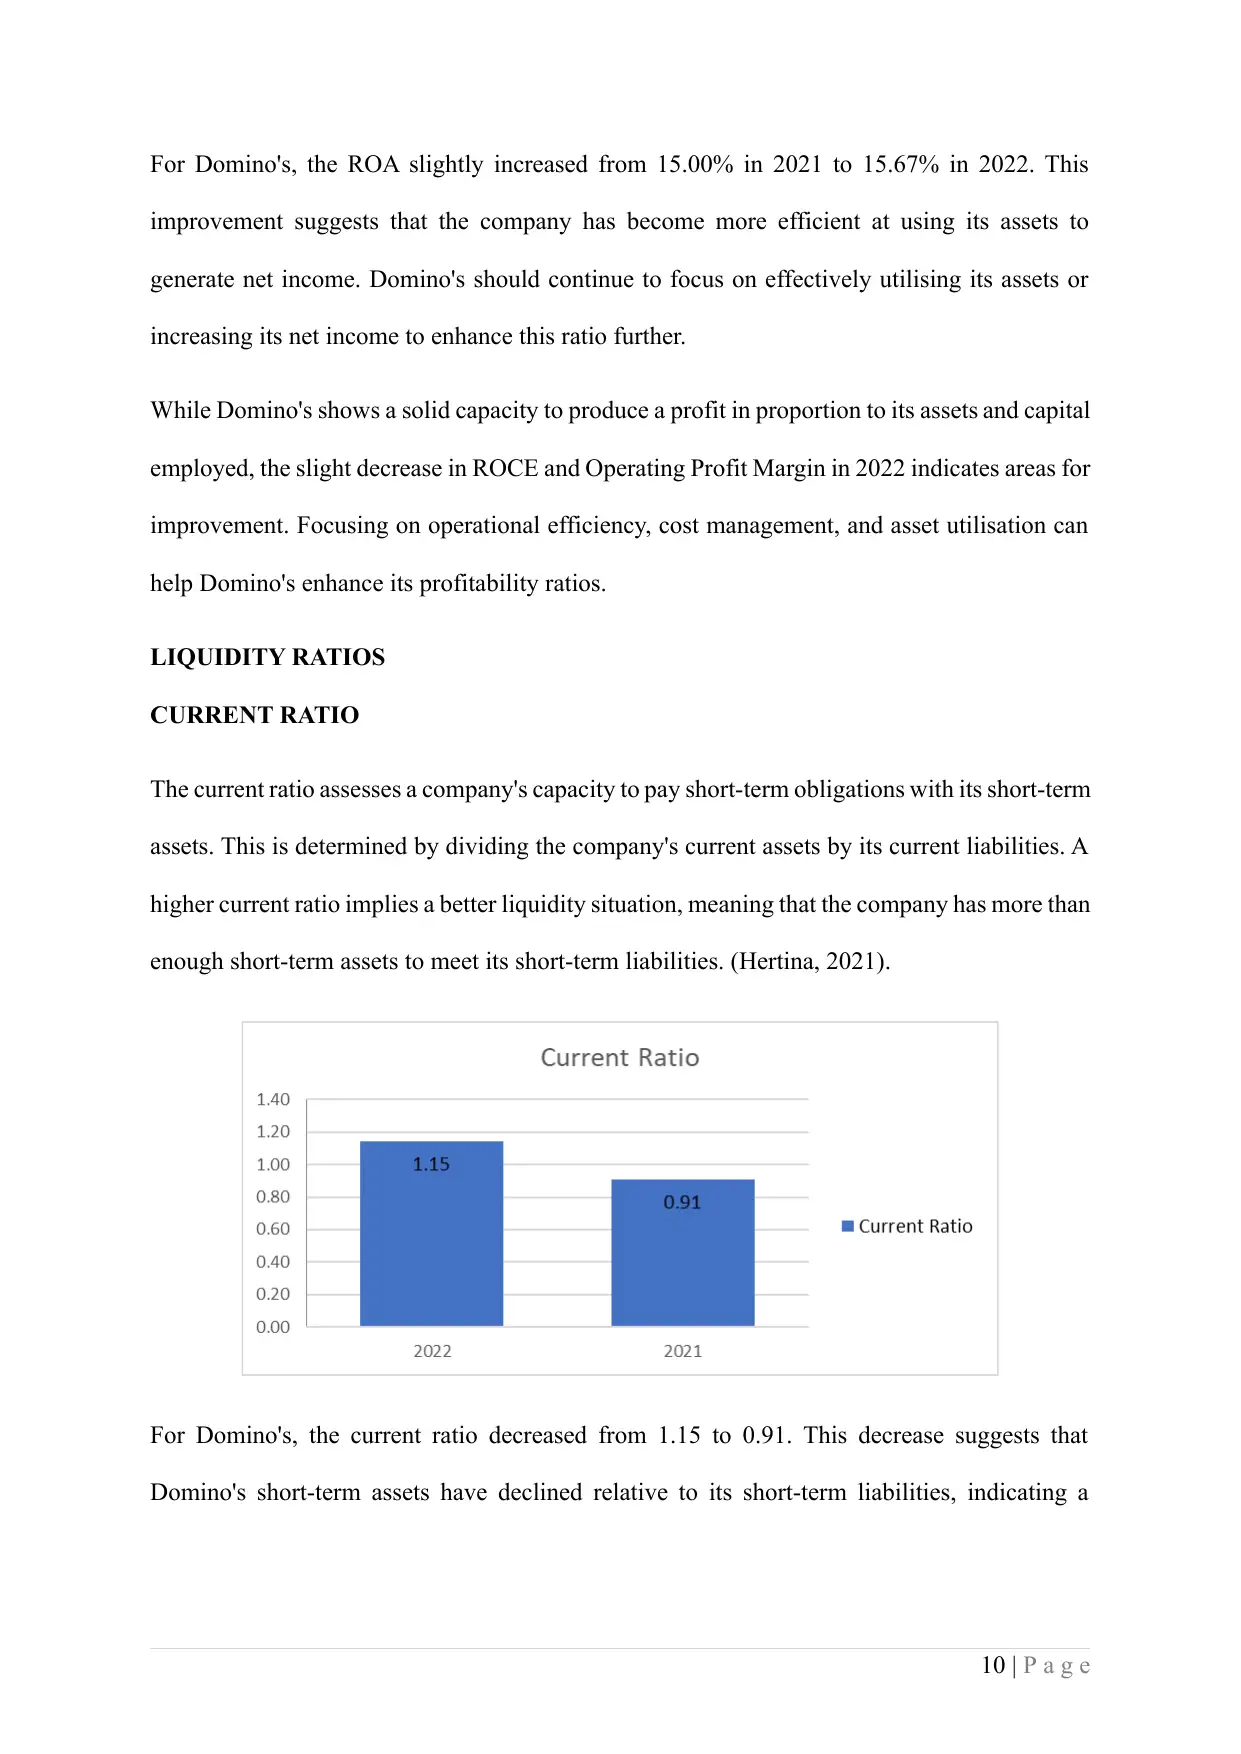
The current ratio assesses a company's capacity to pay short-term obligations with its short-term
assets. This is determined by dividing the company's current assets by its current liabilities. A
higher current ratio implies a better liquidity situation, meaning that the company has more than
enough short-term assets to meet its short-term liabilities. (Hertina, 2021).
For Domino's, the current ratio decreased from 1.15 to 0.91. This decrease suggests that
Domino's short-term assets have declined relative to its short-term liabilities, indicating a
10 | P a g e
improvement suggests that the company has become more efficient at using its assets to
generate net income. Domino's should continue to focus on effectively utilising its assets or
increasing its net income to enhance this ratio further.
While Domino's shows a solid capacity to produce a profit in proportion to its assets and capital
employed, the slight decrease in ROCE and Operating Profit Margin in 2022 indicates areas for
improvement. Focusing on operational efficiency, cost management, and asset utilisation can
help Domino's enhance its profitability ratios.
LIQUIDITY RATIOS
CURRENT RATIO
The current ratio assesses a company's capacity to pay short-term obligations with its short-term
assets. This is determined by dividing the company's current assets by its current liabilities. A
higher current ratio implies a better liquidity situation, meaning that the company has more than
enough short-term assets to meet its short-term liabilities. (Hertina, 2021).
For Domino's, the current ratio decreased from 1.15 to 0.91. This decrease suggests that
Domino's short-term assets have declined relative to its short-term liabilities, indicating a
10 | P a g e
⊘ This is a preview!⊘
Do you want full access?
Subscribe today to unlock all pages.
Trusted by 1+ million students worldwide
1 out of 22
Related Documents


Your All-in-One AI-Powered Toolkit for Academic Success.
+13062052269
info@desklib.com
Available 24*7 on WhatsApp / Email
![[object Object]](/_next/static/media/star-bottom.7253800d.svg)
Unlock your academic potential
Copyright © 2020–2026 A2Z Services. All Rights Reserved. Developed and managed by ZUCOL.