University Financial Analysis Report: Dreamboat Accountants, 2017
VerifiedAdded on 2020/05/28
|8
|1247
|204
Report
AI Summary
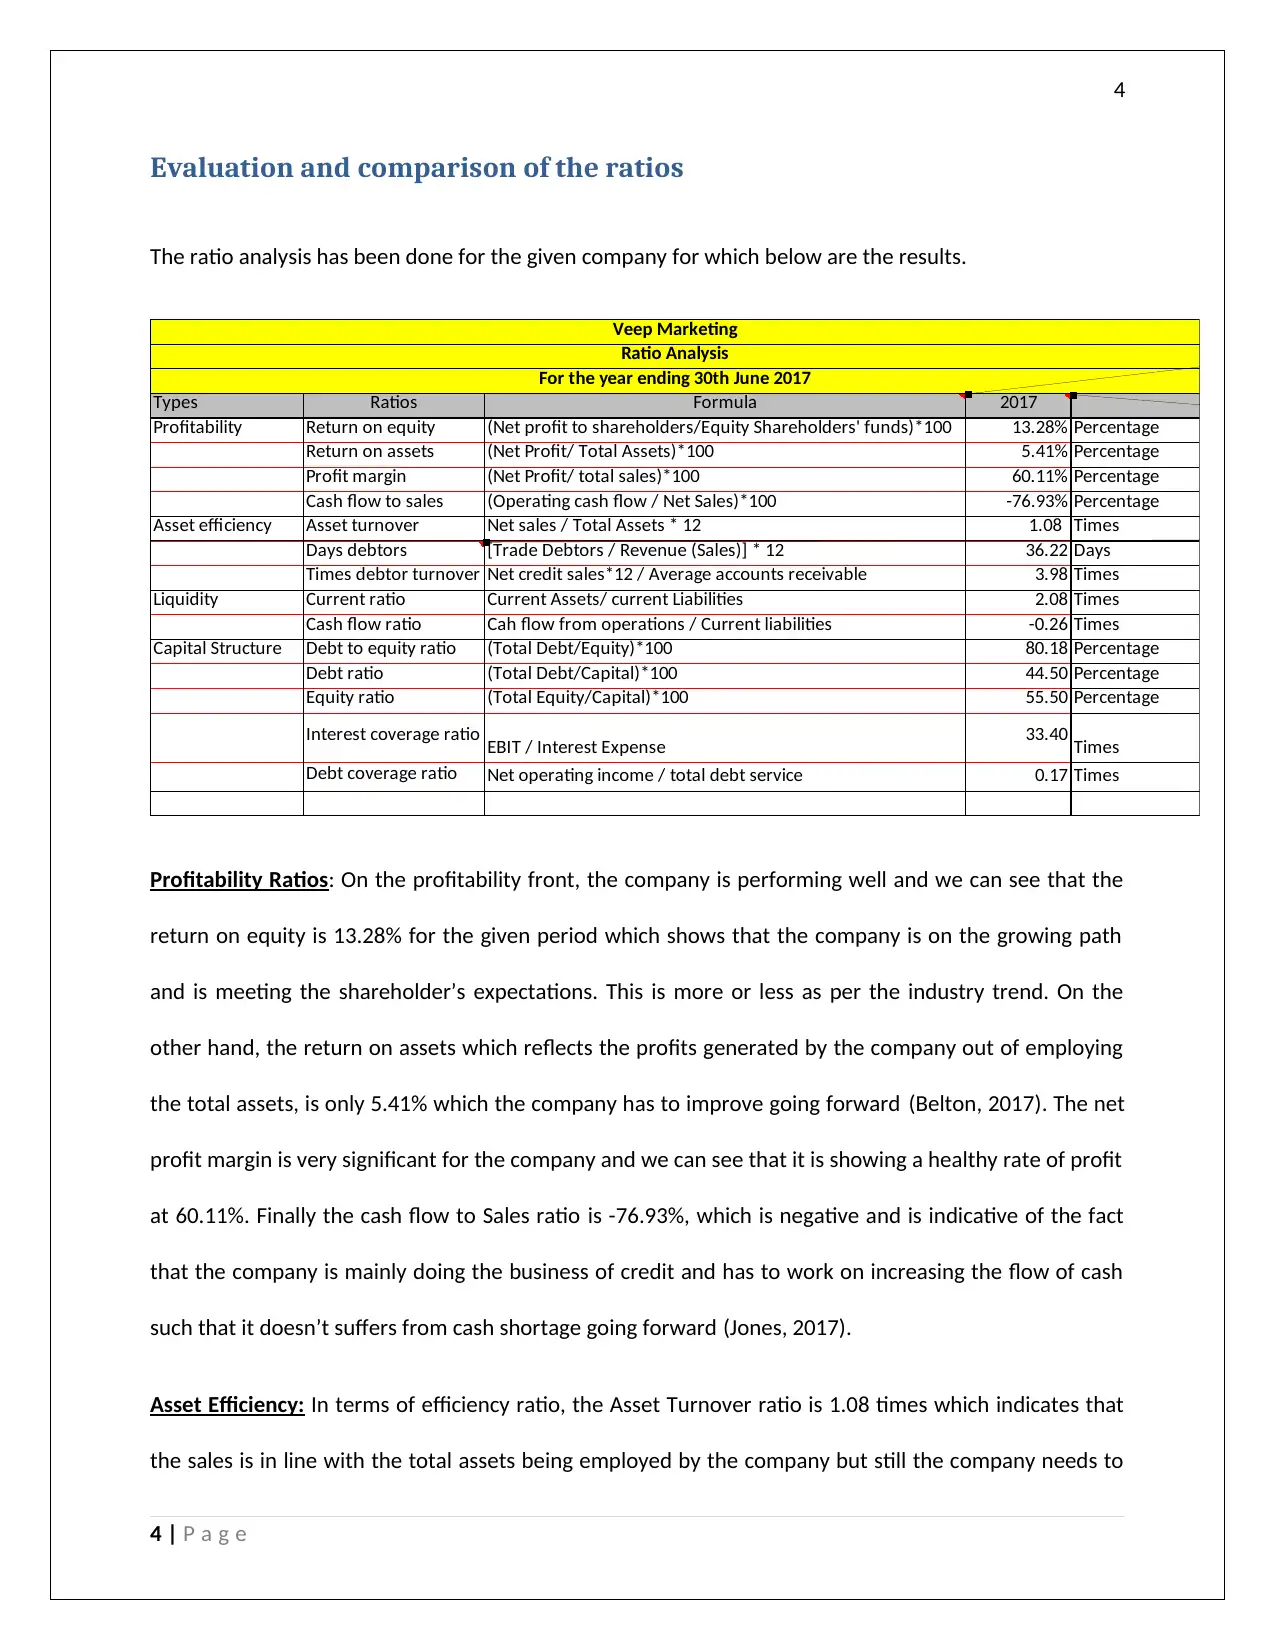
This report provides a financial analysis of Dreamboat Accountants for the period ending May 31, 2017. The analysis, conducted by a student, includes an executive summary, profitability ratios (return on equity, return on assets, net profit margin, cash flow to sales), asset efficiency ratios (asset turnover, debtor days), liquidity ratios, and capital structure ratios (debt to equity, interest coverage). The report highlights the company's strengths, such as a healthy net profit margin and manageable debt, while also pointing out areas for improvement, like negative cash flow from operations and the need to improve the debtor turnover. The analysis concludes with recommendations for the company's future financial strategies and includes limitations of the analysis and references.

Paraphrase This Document
Need a fresh take? Get an instant paraphrase of this document with our AI Paraphraser

1
By student name
Professor
University
Date: 04 January 2018.
1 | P a g e
By student name
Professor
University
Date: 04 January 2018.
1 | P a g e

2
Executive Summary
In the given report, a financial analysis has to be done for the company named Dreamboat Accountants
started by Christian Wolff for the period ended 31st May, 2017. All the financial statements including,
profit and loss accounting, the balance sheet and the statement of changes in equity has been prepared
using the information given and based on same the ratio analysis has been done. A business report is
being prepared to summarize the financial statement and to enable decision making based on the same,
so that the major highlights, strengths and weaknesses of the business can be highlighted.
2 | P a g e
⊘ This is a preview!⊘
Do you want full access?
Subscribe today to unlock all pages.

Trusted by 1+ million students worldwide

3
Contents
Executive Summary.....................................................................................................................................2
Evaluation and comparison of the ratios.....................................................................................................4
Limitations of the analysis...........................................................................................................................6
Conclusions and Recommendations............................................................................................................6
References...................................................................................................................................................7
3 | P a g e
Paraphrase This Document
Need a fresh take? Get an instant paraphrase of this document with our AI Paraphraser

4
Evaluation and comparison of the ratios
The ratio analysis has been done for the given company for which below are the results.
Types Ratios Formula 2017
Profitability Return on equity (Net profit to shareholders/Equity Shareholders' funds)*100 13.28% Percentage
Return on assets (Net Profit/ Total Assets)*100 5.41% Percentage
Profit margin (Net Profit/ total sales)*100 60.11% Percentage
Cash flow to sales (Operating cash flow / Net Sales)*100 -76.93% Percentage
Asset efficiency Asset turnover Net sales / Total Assets * 12 1.08 Times
Days debtors [Trade Debtors / Revenue (Sales)] * 12 36.22 Days
Times debtor turnover Net credit sales*12 / Average accounts receivable 3.98 Times
Liquidity Current ratio Current Assets/ current Liabilities 2.08 Times
Cash flow ratio Cah flow from operations / Current liabilities -0.26 Times
Capital Structure Debt to equity ratio (Total Debt/Equity)*100 80.18 Percentage
Debt ratio (Total Debt/Capital)*100 44.50 Percentage
Equity ratio (Total Equity/Capital)*100 55.50 Percentage
Interest coverage ratio EBIT / Interest Expense 33.40 Times
Debt coverage ratio Net operating income / total debt service 0.17 Times
Veep Marketing
Ratio Analysis
For the year ending 30th June 2017
Profitability Ratios: On the profitability front, the company is performing well and we can see that the
return on equity is 13.28% for the given period which shows that the company is on the growing path
and is meeting the shareholder’s expectations. This is more or less as per the industry trend. On the
other hand, the return on assets which reflects the profits generated by the company out of employing
the total assets, is only 5.41% which the company has to improve going forward (Belton, 2017). The net
profit margin is very significant for the company and we can see that it is showing a healthy rate of profit
at 60.11%. Finally the cash flow to Sales ratio is -76.93%, which is negative and is indicative of the fact
that the company is mainly doing the business of credit and has to work on increasing the flow of cash
such that it doesn’t suffers from cash shortage going forward (Jones, 2017).
Asset Efficiency: In terms of efficiency ratio, the Asset Turnover ratio is 1.08 times which indicates that
the sales is in line with the total assets being employed by the company but still the company needs to
4 | P a g e

5
work a lot on increasing the quantum of sales (Das, 2017). The outstanding debtor days is to the tune of
36.22 days which shows that the company is collecting cash from debtors within 36 days once it is sold.
Though it is a healthy ratio considering the industry average still the company can bring it below 30
days. The times debtor turnover is coming to 3.98 times which needs to improved upon as it shows that
the debtors are being churned only 4 times in a year.
Liquidity Ratios: In terms of liquidity, the company is performing exceptionally well and has a healthy
ratio of 2.08 times which is greater than industry average of 2 and shows that the company has enough
of current assets to meet the current obligations of the company (Félix, 2017). Further, the cash flow
ratio is negative 0.26 which is indicative of the fact that the company is not having enough cash flow
from operations to meet the current liabilities. This is one of the negatives where the company needs to
work upon.
Capital Structure Ratios: In terms of the capital structure, the debt to equity ratio is 80.18%, which is
way within the ambit of the industry average of 200% (Sithole, Chandler, Abeysekera, & Paas, 2017).
This indicates the fact that the company is working mostly on equity and does not bears the risk of
dilution of control or ownership. In 100% of the capital, 44.50% is debt and the remainder 55.50% is the
equity which also shows that the company need not pay an interest to debt holders in a huge amount.
The interest coverage ratio is 33.40 times i.e., the company will be able to pay off the interests out of its
EBIT 33 times which is very healthy and shows good solvency position (Linden & Freeman, 2017).
However, the EBIT is not good enough to meet the total debt component as is reflected by Debt Service
Coverage Ratio.
5 | P a g e
⊘ This is a preview!⊘
Do you want full access?
Subscribe today to unlock all pages.

Trusted by 1+ million students worldwide

6
Limitations of the analysis
Even though ratio analysis is very significant and crucial to understand the financial position of the
company and its trends, still it has a number of limitations. Besides being historical in nature, it does not
helps to ascertain the future numbers and ignores the change in business conditions, if any (Visinescu,
Jones, & Sidorova, 2017). Furthermore it ignore the inflation factor and the operational changes and
change in business policies which may be introduced over a period of time. It is post facto analysis which
gives numbers but not reasons. Different companies may have different internal policies impacting
business which is being fully ignored.
Conclusions and Recommendations
From the above analysis about the company Dreamboat accountants, it can be said that the company is
in the growing stage and is having a healthy margin and returns to shareholders. However, the matter of
concern is the cash flow where the company is having a negative cash flow from operations and is
working on credit (Werner, 2017). The same needs to be improved for the business to sustain. Also,
since the debt equity ratio is in control, the company can switch to trading on equity in the future when
it is in need of funds.
6 | P a g e
Paraphrase This Document
Need a fresh take? Get an instant paraphrase of this document with our AI Paraphraser

7
References
Belton, P. (2017). Competitive Strategy: Creating and Sustaining Superior Performance. London: Macat
International ltd.
Das, P. (2017). Financing Pattern and Utilization of Fixed Assets - A Study. Asian Journal of Social Science
Studies, 2(2), 10-17.
Félix, M. (2017). A study on the expected impact of IFRS 17 on the transparency of financial statements
of insurance companies. MASTER THESIS, 1-69.
Jones, P. (2017). Statistical Sampling and Risk Analysis in Auditing. NY: Routledge.
Linden, B., & Freeman, R. (2017). Profit and Other Values: Thick Evaluation in Decision Making. Business
Ethics Quarterly, 27(3), 353-379.
Sithole, S., Chandler, P., Abeysekera, I., & Paas, F. (2017). Benefits of guided self-management of
attention on learning accounting. Journal of Educational Psychology, 109(2), 220.
Visinescu, L., Jones, M., & Sidorova, A. (2017). Improving Decision Quality: The Role of Business
Intelligence. Journal of Computer Information Systems, 57(1), 58-66.
Werner, M. (2017). Financial process mining - Accounting data structure dependent control flow
inference. International Journal of Accounting Information Systems, 25, 57-80.
7 | P a g e
1 out of 8
Related Documents

Your All-in-One AI-Powered Toolkit for Academic Success.
+13062052269
info@desklib.com
Available 24*7 on WhatsApp / Email
Unlock your academic potential
Copyright © 2020–2025 A2Z Services. All Rights Reserved. Developed and managed by ZUCOL.