Comprehensive Dupont Analysis Report: Business Performance Review
VerifiedAdded on 2021/02/21
|8
|2338
|80
Report
AI Summary
This report presents a Dupont analysis of a company's financial performance, examining key financial statements, ratios, and metrics from 2014 to 2018. The analysis includes the interpretation of the income statement, balance sheet, and cash flow statement, highlighting trends in revenue, profit margins, assets, liabilities, and cash flow activities. Financial ratios, such as profit margins, current ratios, and turnover ratios, are analyzed to assess the company's liquidity, profitability, and efficiency. The weighted average cost of capital is calculated, and the report concludes with an evaluation of the company's overall financial position, suggesting that while the company's performance declined during the period, there are indications of potential improvement in the upcoming years. The report serves as a comprehensive review of the company's financial health, providing insights for decision-making and future strategy.
Dupont analysis
Paraphrase This Document
Need a fresh take? Get an instant paraphrase of this document with our AI Paraphraser
Table of Contents
INTRODUCTION...........................................................................................................................1
MAIN BODY ..................................................................................................................................1
CONCLUSION ..............................................................................................................................5
REFERENCES................................................................................................................................6
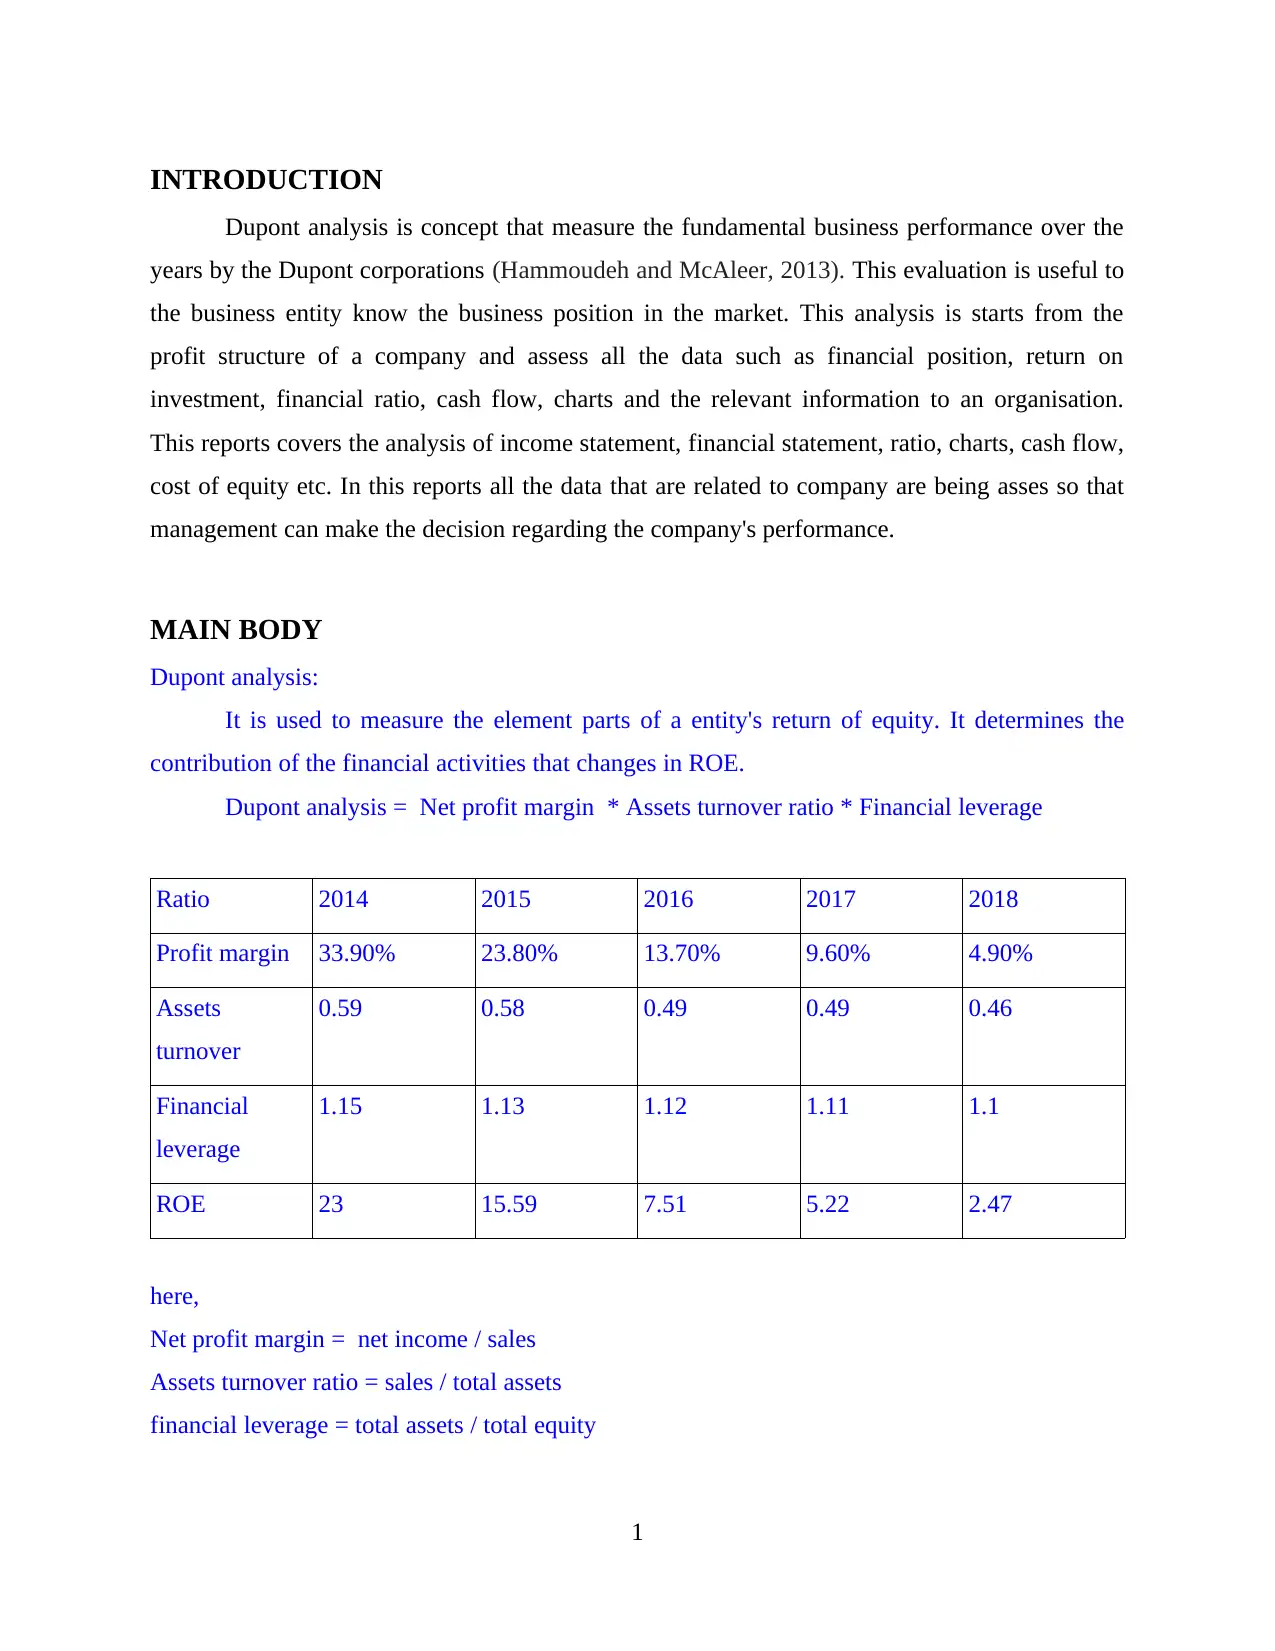
INTRODUCTION
Dupont analysis is concept that measure the fundamental business performance over the
years by the Dupont corporations (Hammoudeh and McAleer, 2013). This evaluation is useful to
the business entity know the business position in the market. This analysis is starts from the
profit structure of a company and assess all the data such as financial position, return on
investment, financial ratio, cash flow, charts and the relevant information to an organisation.
This reports covers the analysis of income statement, financial statement, ratio, charts, cash flow,
cost of equity etc. In this reports all the data that are related to company are being asses so that
management can make the decision regarding the company's performance.
MAIN BODY
Dupont analysis:
It is used to measure the element parts of a entity's return of equity. It determines the
contribution of the financial activities that changes in ROE.
Dupont analysis = Net profit margin * Assets turnover ratio * Financial leverage
Ratio 2014 2015 2016 2017 2018
Profit margin 33.90% 23.80% 13.70% 9.60% 4.90%
Assets
turnover
0.59 0.58 0.49 0.49 0.46
Financial
leverage
1.15 1.13 1.12 1.11 1.1
ROE 23 15.59 7.51 5.22 2.47
here,
Net profit margin = net income / sales
Assets turnover ratio = sales / total assets
financial leverage = total assets / total equity
1
⊘ This is a preview!⊘
Do you want full access?
Subscribe today to unlock all pages.
Trusted by 1+ million students worldwide
As per the Dupont analysis Profit margin of the company is decreasing from 2014. It clearly
represent that it continuously reducing after the year of 2014 from 33.90% to 4.90% and it
become very low in the year 2018. It is the same manner follows in asset turnover and financial
leverage too. So the ROE is also low after the year 2014. in the year of 2014 ROE is around 23
% but it become only 2.47 % in the year of 2018. so it reduced almost 20 % in the 5 year. It is
huge decrement in the company's return. So management should provides attention to enhance it.
Income statement:
Income statement is core financial statement of a company that shows the profitability of
a entity (Iatridis and Dimitras, 2013). It includes the trading account & profit and loss account of
an organisation. This statement of financial report provides a detail summery of revenues,
expenses, profit, loss, sales, and other basic items of a business organisation over a period of
time.
Interpretation of income statement:
After considering the income statement of the company, revenue of the company is
continuously decreasing year by year starting from 2014. but from the year after 2018 statement
represent the expected growth can be increase. So gross profit is also decreased from 2014. In the
year of 2014 the gross margin is 52 % on sales after the financial year 2018 it become around 28
%. It is negative side of the company as it expenses are huge. But Dupont analysis shows the
expected data related to margin as it may increase from the financial year 2018 and it reaches to
33 % by the year of 2023. There is same condition of the total profit that are discussed as above.
It will in decreasing trend of profit and sales till year 2018. after it analysis shows it may increase
by every year.
Balance sheet:
It is a financial statement that shows the assets and liabilities of the business at particular
point of time (McPherson and Pincus, 2017). Balance sheet id financial document that represent
the business condition and position to the management of the company. It covers the financial
items such as assets, equity, long term loan, investment, current assets and other liabilities. It is
based on the equation assets is equal to capital plus liabilities.
Interpretation:
2
Paraphrase This Document
Need a fresh take? Get an instant paraphrase of this document with our AI Paraphraser
After considering the data related to balance sheet for the five year. In the year of 2014,
company is having fix assets of 27851 and current assets 20165 and the total assets is summed
48016 whereas in the year of 2018, fix assets 17571 and other current assets 23551 and total
assets 41121. so it reduced by around 7000. It is not a good sigh for the company. It needs to
improve the business activities and function to enhance the profit and assets of the company. The
decreasing trends in the value of financial items are continues from the year of 2014. Its current
liabilities and long term liabilities are also decreased due to less liability of non current item in
balance sheet. In the year of 2014, the net assets per share is 1.68 and after in the financial year
of 2018 it remains 1.25. So in this scenario, financial condition become little bit more fragile. It
is suggested to company to enhance the business effectiveness to increment the organisational
performance.
Cash flow statement:
It is a financial statement that the changes in the financial activities or balance sheet item
are affected to the cash and cash equivalent of a business. This statement represent the cash flow
from different activities such as operating, investing and financing. It is also knowns as statement
of cash flow (Ortas, Gallego‐Alvarez and Álvarez Etxeberria, 2015). It is detail summery of
cash in flow and cash outflow of the business for a specific time period.
Interpretation:
From the all data related to cash flow, it is interpreted as company is generating cash
from operational activities but it is investing the monetary funds in acquiring plant and
machinery and investment. In the financing activities of the company, company pays dividend to
its stakeholders and other expenses like finance charges to company. In the year of 2016 and
2017 company is generating large cash from operating activities respectively 2140552 , 2196228
but invest all the amount that is generated in investing activities so it cash balance remains 3972,
1356 respectively. In the current financial year of 2018, cash flow from operation is 1383314 but
not invested too much amount in both the activities so cash balance remains at the end of the
year 800314. It is really helpful amount in the next year. Company needs to effectively
utilisation of this cash in the next year to improve the profitability and productivity both. So
company can become more successful as it was in 2014.
3
Financial ratio:
financial ratio are key performance indicator that represent the actual business status and
position in the market. These are uses the information from the financial statement of a company
and derives the value in significant terms (Parker,2013). It use the information from business
financial statement, income statement, cash flow and other financial detail and analyse the
information. The ratio help in evaluating the entity's profitability, liquidity, financial stability.
Interpretation:
As per the ratio chart, business growth is continuously declining from the year 2014.
whereas the profitability ratio like gross and net margin ratio also dwindling from 2014. In the
year 2014 gross margin ratio is 51.7% and after the end of 2018 it become 27.6%. In further,
current ratio is 1.8:1 in the year of 2014. after that it also decreasing till 2018. The ideal current
ratio is 2:1. company is underrating this ratio too. So it needs to be enhance in upcoming years as
it is good chance to develop it as Dupont analysis shows that it may increase sales and revenue in
upcoming year. Where the quick ratio is 1.4 :1 in the 2014 and it become 1.1 :1 in the year 2018.
but the ideal ratio is 1.5: 1. It is also below par situation in the business. Other ratio is based on
the sales of the company like debtors turnover ratio is 2.452 in 2014 but it reduces to 1.541.
Sales of the company reduces is year by year. The main reason behind it outstanding sales period
increases as customer are not paying the money on time. It is require to tighten the credit policy
of debtors so it cause to raise money on time. Interest coverage ratio shows how easily company
can the interest on its debts. In 2014 the ratio is 707 and its become 107 in the year 2018. so it
seems that company is not going to pay the interest to its holders.
In the chart analysis of the company that provided the detail information by comparing
the other year data. In revenue chart, revenue of the company in 2014 is 28.8 and it remains 19.1
in year 2018. so company is totally not producing the as per expectation. The owners fund the
company is also decreased from 2014 to 2018 by around 4000. Net profit ratio of the company is
decreases by considering the charts analysis. It shows the negative result over the years. In the
another charts, assets turnover ratio is 0.32 in year 2014 it means assets generated 32 % of sales.
But it doubled in the next year. That means huge assets create with low sales. After that it
becomes constant over the year till 2018. Inventory turnover ratio defines that number of times
stock sold during the year. In the 2014 company sales around 2 times in a year. But in the next
4
⊘ This is a preview!⊘
Do you want full access?
Subscribe today to unlock all pages.
Trusted by 1+ million students worldwide
year it increases to 5 times. After that it will constant between 2 to 3. The other chart shows that
current ratio is almost 2:1 in the year 2015 but after it reduces to 1.5:1 in the year 2018. whereas
quick ratio is 1.5:1 in the year 2015 that seems good but after it continuously reduces till 2018.
Weighted average cost of capital:
It is defined as overall cost of capital of an organisation that needs to pay on average to
all the long term holder of the company (Pelucio-Grecco and et. Al 2014). It is the cost of capital
where each class of capital is proportionality weighted. It includes the capital category stock,
bond, long term loan, debentures, etc.
Interpretation:
After the considering the capital structure of the company, the equity portion is huge as
compare to debt ans the cost of equity is 11.5% where debts cost is 7 % so the dividend on the
equity is higher than interest on loan. After proportioning the weighted average capital structure
WAAC is calculated 11.29 %. It is average cost of overall capital of the company. Price earning
ratio is 0.051 and price to book value ratio is 0.109. It shows actual earning on share are
comparatively less to book value ratio. In the another table cash flow to firm in the yaer 2014 is
212456 and after the yearn 2015 it increases continuously. After made all the calculation, fair
value of the share is -0.58 and current price is 0.096.
CONCLUSION
Dupont analysis evaluates the performance of business entity. After measuring all the
data related to business position. It is concluded that company is not in good position by
acquiring the profit and sales are continuously decreases year by year. All the data and tables that
are provided in this report shows profit structure and value of shares are really low by
considering the business function like return on investment, financial ratio, cash flow, charts and
the relevant information. But the data related to upcoming year shows it may be increase. All the
data analysis help in the decision making process in future.
5
Paraphrase This Document
Need a fresh take? Get an instant paraphrase of this document with our AI Paraphraser
REFERENCES
Books and Journal:
Hammoudeh, S. and McAleer, M., 2013. Risk management and financial derivatives: An
overview. The North American Journal of Economics and Finance, 25, pp.109-115.
Iatridis, G. and Dimitras, A.I., 2013. Financial crisis and accounting quality: evidence from five
European countries. Advances in Accounting. 29(1). pp.154-160.
McPherson, R. A. and Pincus, M. R., 2017. Henry's Clinical Diagnosis and Management by
Laboratory Methods E-Book. Elsevier Health Sciences.
Ortas, E., Gallego‐Alvarez, I. and Álvarez Etxeberria, I., 2015. Financial factors influencing the
quality of corporate social responsibility and environmental management disclosure: A
quantile regression approach. Corporate Social Responsibility and Environmental
Management. 22(6). pp.362-380.
Parker, L. D., 2013. Contemporary university strategising: the financial imperative. Financial
Accountability &Management. 29(1). pp.1-25.
Pelucio-Grecco, M.C. and et. al 2014. The effect of IFRS on earnings management in Brazilian
non-financial public companies. Emerging Markets Review. 21. pp.42-66.
Speaker, P. J., 2015. Financial management of forensic science laboratories: Lessons from
project FORESIGHT 2011-2012. Forensic Science Policy & Management: An
International Journal. 6(1-2). pp.7-29.
Stead, J. G. and Stead, W. E., 2017. Management for a small planet. Routledge.
6
1 out of 8
Related Documents


Your All-in-One AI-Powered Toolkit for Academic Success.
+13062052269
info@desklib.com
Available 24*7 on WhatsApp / Email
![[object Object]](/_next/static/media/star-bottom.7253800d.svg)
Unlock your academic potential
Copyright © 2020–2026 A2Z Services. All Rights Reserved. Developed and managed by ZUCOL.