Financial Analysis Report: Elite plc Performance 2018-2019
VerifiedAdded on 2022/12/15
|10
|2925
|125
Report
AI Summary
This financial analysis report examines the financial statements of Elite plc for the years 2018 and 2019. It provides an in-depth analysis of various financial ratios, including profitability (gross profit, operating profit, and return on capital employed), liquidity (current ratio and acid test ratio), and efficiency (trade receivable collection period, trade payables payment period, and non-current asset turnover). The report compares the ratios between the two years, interprets the trends, and offers recommendations for improving the company's operational and financial performance. Key findings include insights into Elite plc's ability to manage sales, control production costs, optimize operational efficiency, and manage its short-term and long-term financial obligations. The analysis highlights areas where Elite plc has performed well and identifies areas where improvements can be made to enhance profitability and liquidity.
Financial Analysis
Assessment
Assessment
Paraphrase This Document
Need a fresh take? Get an instant paraphrase of this document with our AI Paraphraser
Table of Contents
INTRODUCTION...........................................................................................................................2
MAIN BODY..................................................................................................................................3
Ratio Analysis..............................................................................................................................3
CONCLUSION................................................................................................................................8
REFERENCES................................................................................................................................9
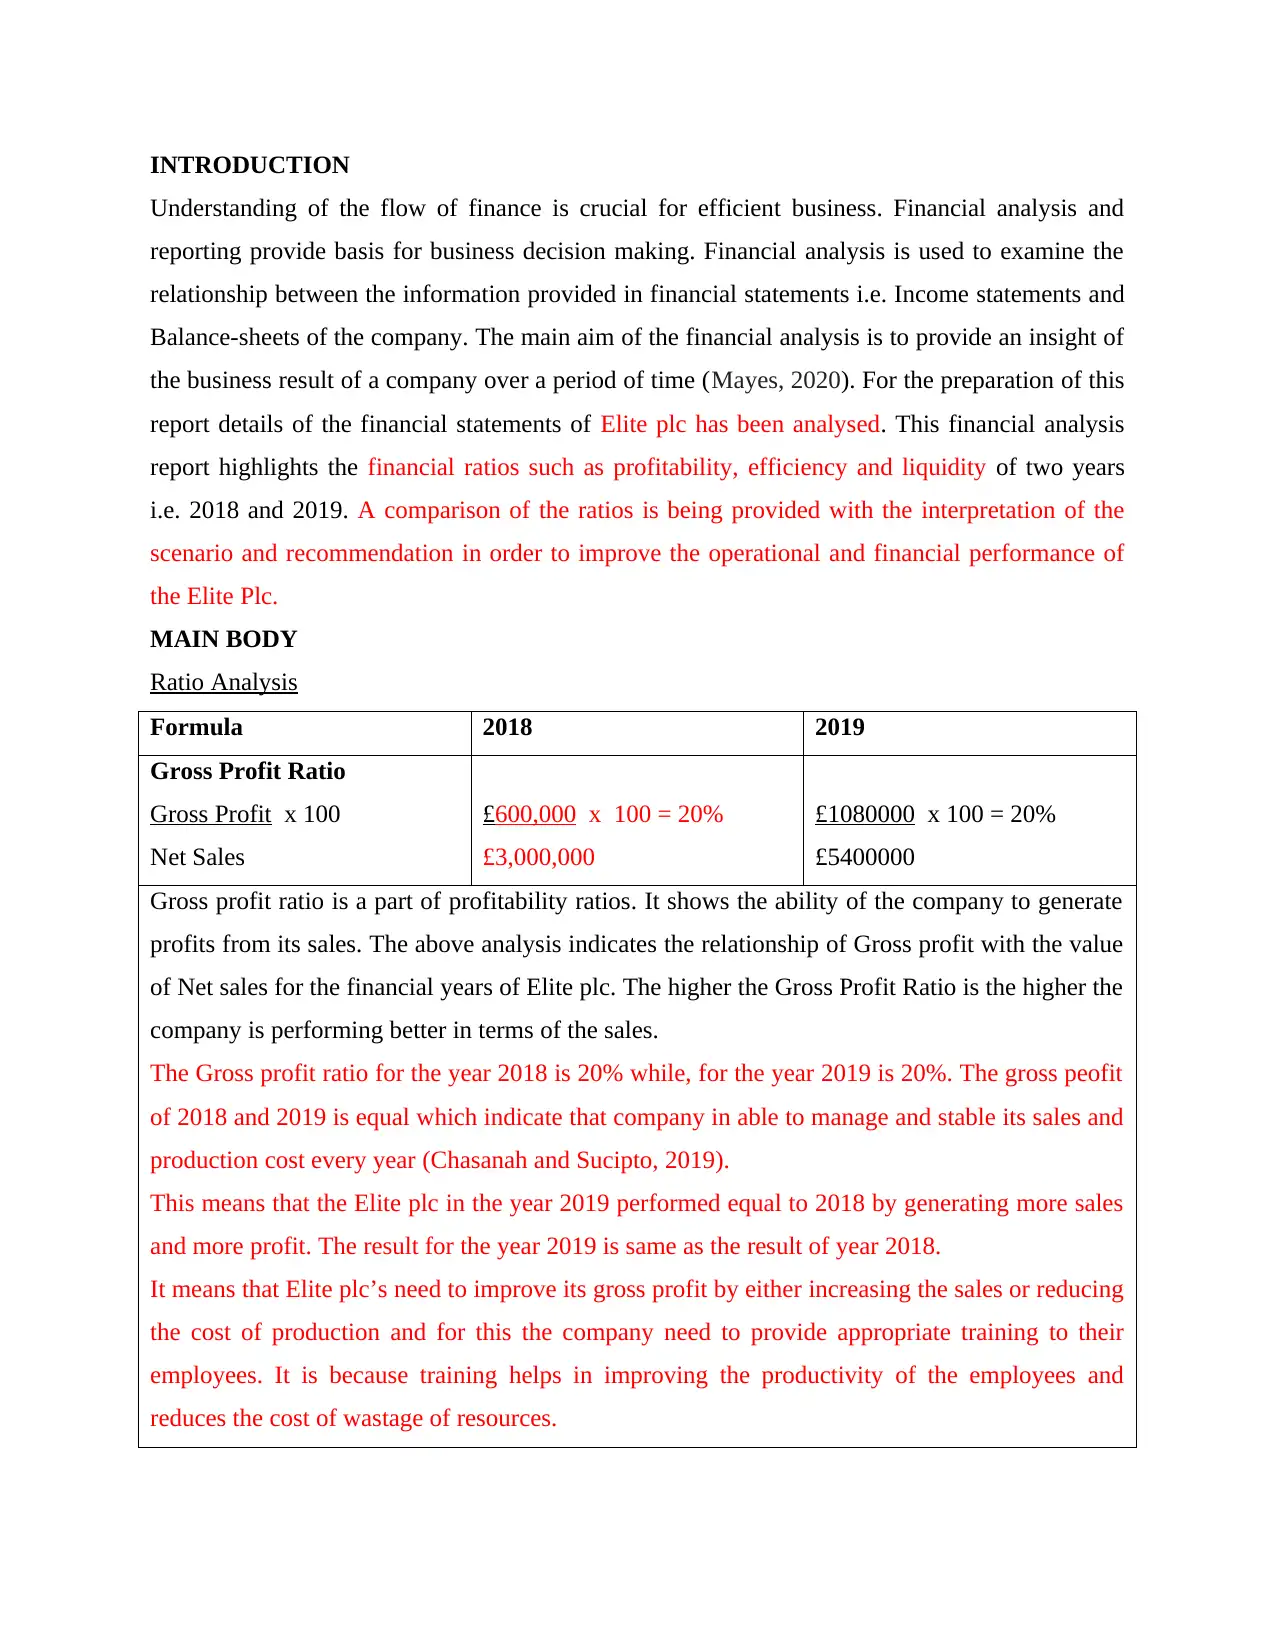
INTRODUCTION
Understanding of the flow of finance is crucial for efficient business. Financial analysis and
reporting provide basis for business decision making. Financial analysis is used to examine the
relationship between the information provided in financial statements i.e. Income statements and
Balance-sheets of the company. The main aim of the financial analysis is to provide an insight of
the business result of a company over a period of time (Mayes, 2020). For the preparation of this
report details of the financial statements of Elite plc has been analysed. This financial analysis
report highlights the financial ratios such as profitability, efficiency and liquidity of two years
i.e. 2018 and 2019. A comparison of the ratios is being provided with the interpretation of the
scenario and recommendation in order to improve the operational and financial performance of
the Elite Plc.
MAIN BODY
Ratio Analysis
Formula 2018 2019
Gross Profit Ratio
Gross Profit x 100
Net Sales
£600,000 x 100 = 20%
£3,000,000
£1080000 x 100 = 20%
£5400000
Gross profit ratio is a part of profitability ratios. It shows the ability of the company to generate
profits from its sales. The above analysis indicates the relationship of Gross profit with the value
of Net sales for the financial years of Elite plc. The higher the Gross Profit Ratio is the higher the
company is performing better in terms of the sales.
The Gross profit ratio for the year 2018 is 20% while, for the year 2019 is 20%. The gross peofit
of 2018 and 2019 is equal which indicate that company in able to manage and stable its sales and
production cost every year (Chasanah and Sucipto, 2019).
This means that the Elite plc in the year 2019 performed equal to 2018 by generating more sales
and more profit. The result for the year 2019 is same as the result of year 2018.
It means that Elite plc’s need to improve its gross profit by either increasing the sales or reducing
the cost of production and for this the company need to provide appropriate training to their
employees. It is because training helps in improving the productivity of the employees and
reduces the cost of wastage of resources.
⊘ This is a preview!⊘
Do you want full access?
Subscribe today to unlock all pages.
Trusted by 1+ million students worldwide
Formula 2018 2019
Operating Profit Ratio
Operating Profit x 100
Net Sales
£240000 x 100 = 8%
£3000000
£580000 x 100 = 10.74%
£5400000
Operating profit ratio is a part of profitability ratio and also known as Operating profit margin. It
shows the ability of the company to generate profit from the operations from its sales. The above
analysis indicates the relationship of Operating profit with the value of Net sales for the financial
years of Elite plc. It is expressed in percentage. The Operating profit ratio analyse the company’s
operational efficiency in terms of sales.
The Operating profit ratio for the year 2018 is 8% and in year 2019 is 10.74%. In the year 2019
there is an increase of £340000 and £2400000 in sales in comparison of the previous year. Also,
there is an increase of 2.74% in the Operating profit ratio as compared to year 2018 (Kljenak and
et.al, 2019).
This means that the Elite plc in the year 2019 perform better business operations than year 2018.
The profitability is better in the year 2019 than the year 2018.
It means that Elite plc’s business performance is increased in year 2019 than year 2018. It
indicates that the Elite plc is managing its resources better which leads to higher operational
profits. But along with that the management also need to put their attention towards identifying
the area of cost which help in increasing the operating profit of the company. For this, the
management of Elite Plc. have to look out the cost such as electricity, stationery, insurance,
telephone etc. in order to identify how the company can save the money more and more and
reduce such a cost.
Formula 2018 2019
Return on Capital Employed
Profit before interest/ Capital
employed* 100
£240,000 x 100
£840,000 = 28.57% £580,000 x 100
£1,300,000 = 44.62%
Return on capital employed is a part of profitability ratios. It indicates the ability of the company
to measure the company’s efficiency to generate profits from the capital used for business. The
above analysis shows the relationship of Operating profit with the value of Capital that employed
Paraphrase This Document
Need a fresh take? Get an instant paraphrase of this document with our AI Paraphraser
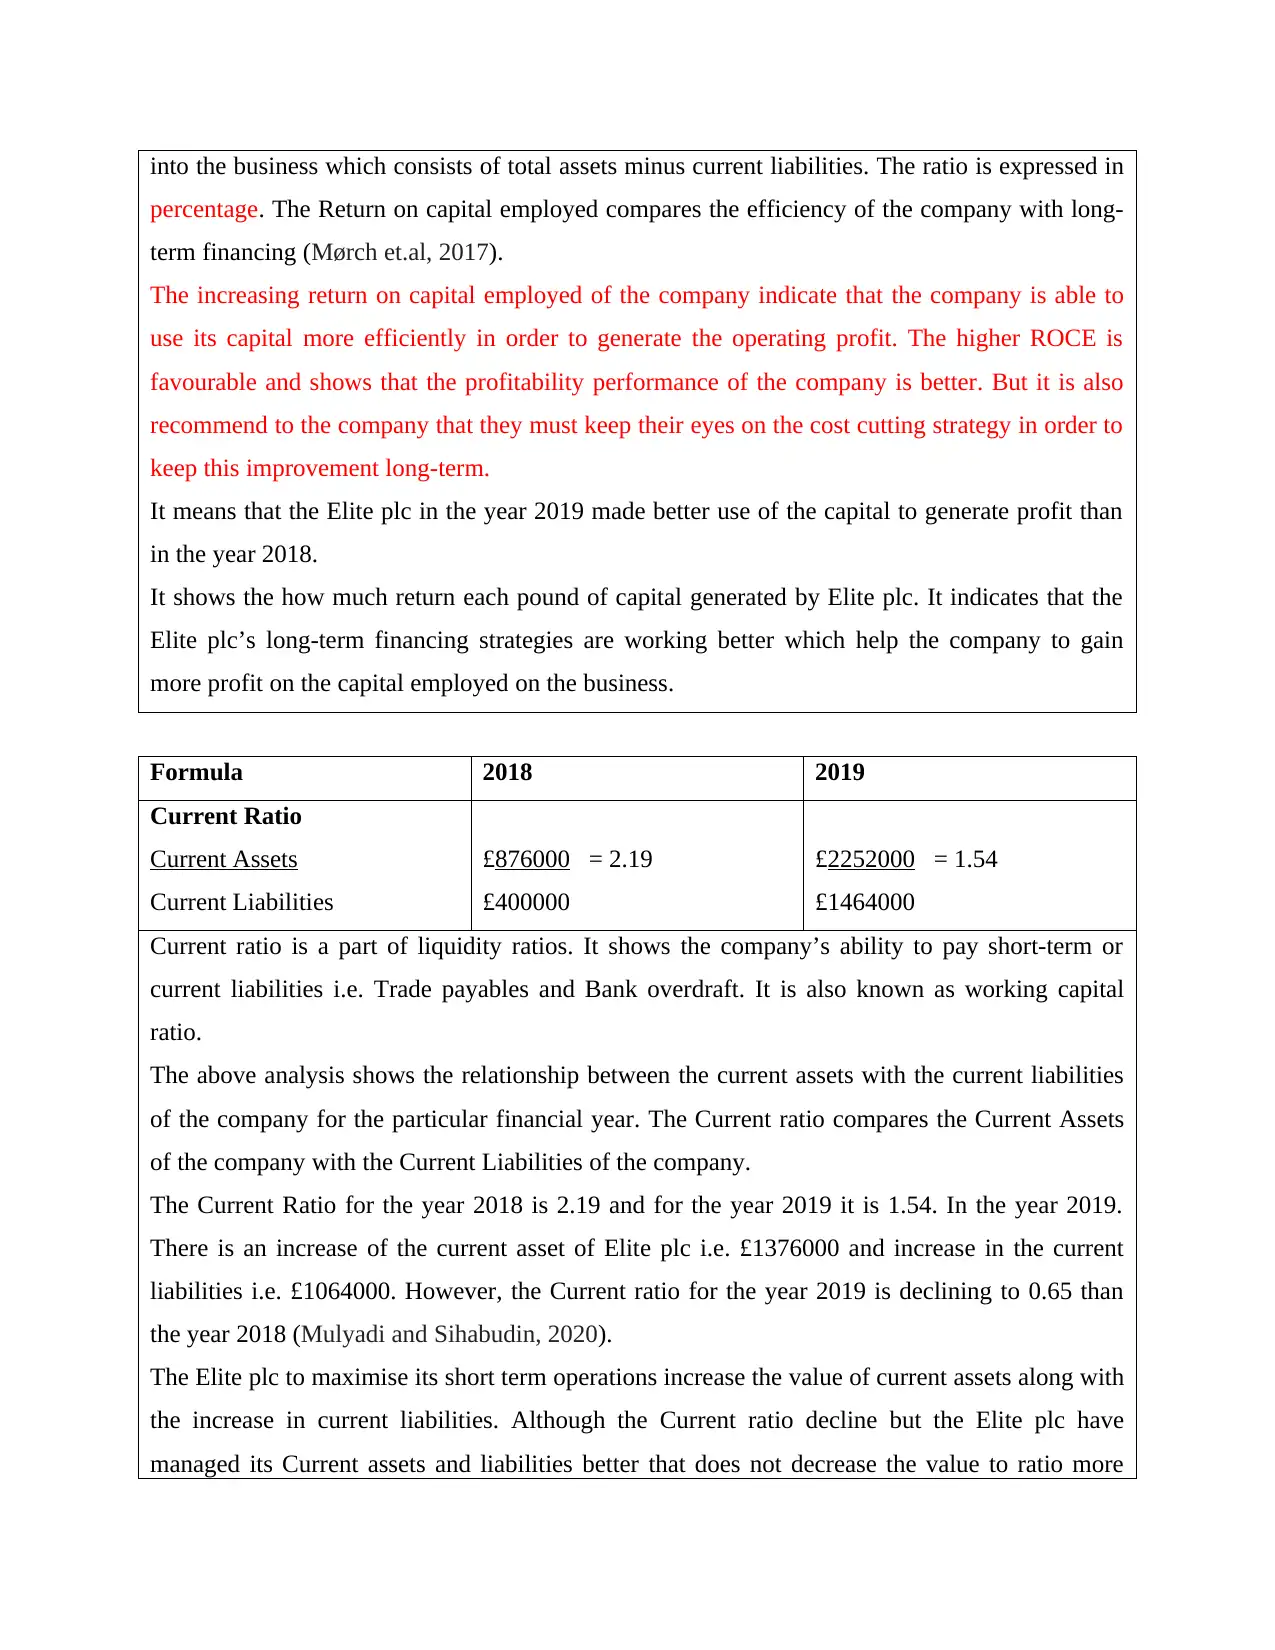
into the business which consists of total assets minus current liabilities. The ratio is expressed in
percentage. The Return on capital employed compares the efficiency of the company with long-
term financing (Mørch et.al, 2017).
The increasing return on capital employed of the company indicate that the company is able to
use its capital more efficiently in order to generate the operating profit. The higher ROCE is
favourable and shows that the profitability performance of the company is better. But it is also
recommend to the company that they must keep their eyes on the cost cutting strategy in order to
keep this improvement long-term.
It means that the Elite plc in the year 2019 made better use of the capital to generate profit than
in the year 2018.
It shows the how much return each pound of capital generated by Elite plc. It indicates that the
Elite plc’s long-term financing strategies are working better which help the company to gain
more profit on the capital employed on the business.
Formula 2018 2019
Current Ratio
Current Assets
Current Liabilities
£876000 = 2.19
£400000
£2252000 = 1.54
£1464000
Current ratio is a part of liquidity ratios. It shows the company’s ability to pay short-term or
current liabilities i.e. Trade payables and Bank overdraft. It is also known as working capital
ratio.
The above analysis shows the relationship between the current assets with the current liabilities
of the company for the particular financial year. The Current ratio compares the Current Assets
of the company with the Current Liabilities of the company.
The Current Ratio for the year 2018 is 2.19 and for the year 2019 it is 1.54. In the year 2019.
There is an increase of the current asset of Elite plc i.e. £1376000 and increase in the current
liabilities i.e. £1064000. However, the Current ratio for the year 2019 is declining to 0.65 than
the year 2018 (Mulyadi and Sihabudin, 2020).
The Elite plc to maximise its short term operations increase the value of current assets along with
the increase in current liabilities. Although the Current ratio decline but the Elite plc have
managed its Current assets and liabilities better that does not decrease the value to ratio more
than 1. The result for Elite plc is a little worse in year 2019.
The Elite plc should try to decrease the value of current liabilities that will help in maintaining
the liquidity of the company.
Formula 2018 2019
Acid Test Ratio
(Current assets – Inventory)
Current Liabilities
£876300 - £480000 = 0.1
£400000
£2252000 - £1440000 = 0.55
£1464000
Acid test ratio is also a part of the liquidity ratios. It shows the company’s ability to maintain
liquidity for the short period. It is also known as quick ratio. It is also seen as the indicator of the
company to pay off its short-term liabilities without the use of inventories.
The above analysis shows the relationship between the Quick assets i.e. Trade receivables less
Inventories held by the company for the particular period with the current liabilities of the
company.
The current ratio for the year 2018 is 0.1 and 0.55 for the year 2019. In the year 2019, the value
of the Quick assets increases in value to £415700 and also the value of current liabilities
increases to £1064000. The company is not to meet the liquidity for the short period as the Acid
test ratio is increases from the previous year which indicate that company is able to pay its
current obligation with the use of cash and trade receivables only.
For further improvement, it is recommendable to the company that they must allow discount to
their customers for the early payment and also prepare monthly cash budgets to track the cash
flows of the company. This helps the company’s management in managing the cash and cash
equivalent.
The Elite plc should also maintain liquidity through maintaining cash and cash equivalents. It has
been observed that the operations of the Elite plc is done on credit as only trade receivables is the
only current asset the company have that can be quickly liquidity. And for this they need to
provide the goods and services to customers at 20% cash and 80% credit.
Formula 2018 2019
Trade Receivable collection
period £396000/ £3000000* 365 £812000/ £5400000* 365
⊘ This is a preview!⊘
Do you want full access?
Subscribe today to unlock all pages.
Trusted by 1+ million students worldwide
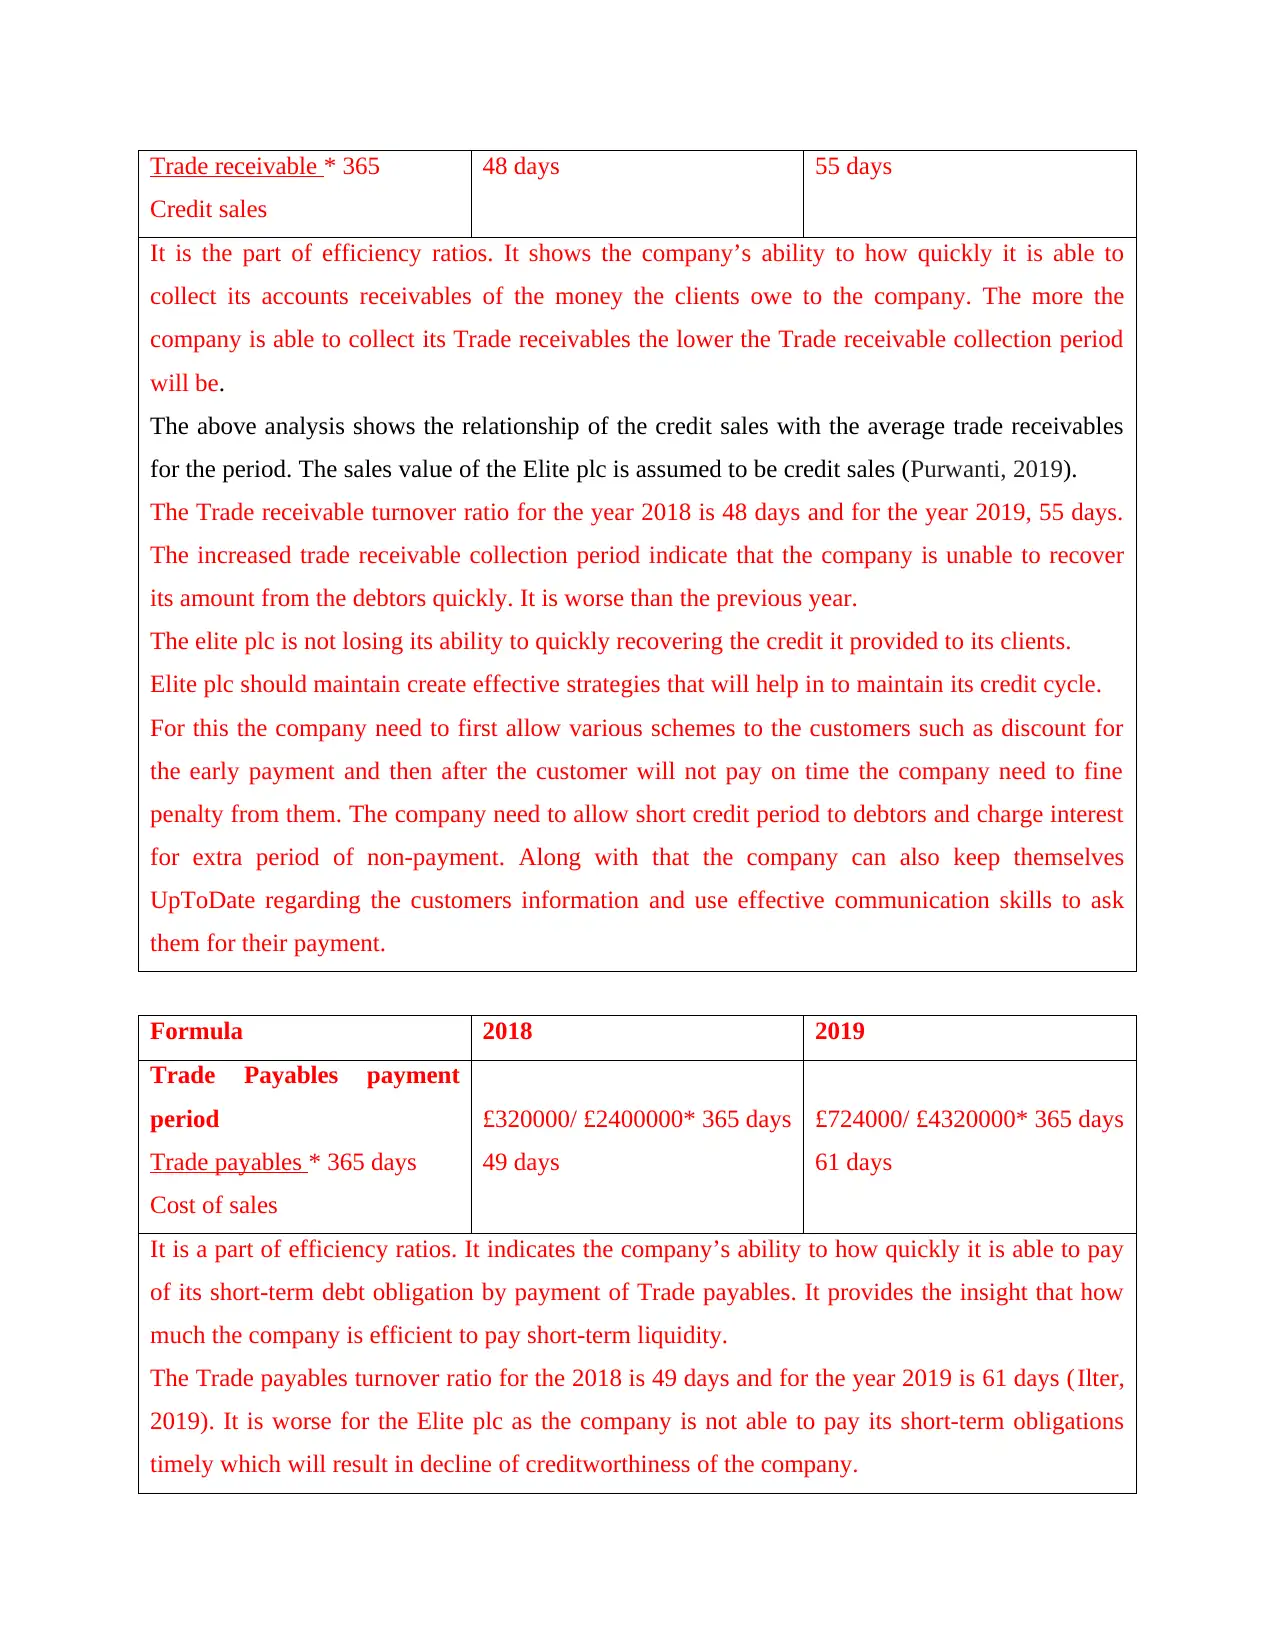
Trade receivable * 365
Credit sales
48 days 55 days
It is the part of efficiency ratios. It shows the company’s ability to how quickly it is able to
collect its accounts receivables of the money the clients owe to the company. The more the
company is able to collect its Trade receivables the lower the Trade receivable collection period
will be.
The above analysis shows the relationship of the credit sales with the average trade receivables
for the period. The sales value of the Elite plc is assumed to be credit sales (Purwanti, 2019).
The Trade receivable turnover ratio for the year 2018 is 48 days and for the year 2019, 55 days.
The increased trade receivable collection period indicate that the company is unable to recover
its amount from the debtors quickly. It is worse than the previous year.
The elite plc is not losing its ability to quickly recovering the credit it provided to its clients.
Elite plc should maintain create effective strategies that will help in to maintain its credit cycle.
For this the company need to first allow various schemes to the customers such as discount for
the early payment and then after the customer will not pay on time the company need to fine
penalty from them. The company need to allow short credit period to debtors and charge interest
for extra period of non-payment. Along with that the company can also keep themselves
UpToDate regarding the customers information and use effective communication skills to ask
them for their payment.
Formula 2018 2019
Trade Payables payment
period
Trade payables * 365 days
Cost of sales
£320000/ £2400000* 365 days
49 days
£724000/ £4320000* 365 days
61 days
It is a part of efficiency ratios. It indicates the company’s ability to how quickly it is able to pay
of its short-term debt obligation by payment of Trade payables. It provides the insight that how
much the company is efficient to pay short-term liquidity.
The Trade payables turnover ratio for the 2018 is 49 days and for the year 2019 is 61 days (Ilter,
2019). It is worse for the Elite plc as the company is not able to pay its short-term obligations
timely which will result in decline of creditworthiness of the company.
Paraphrase This Document
Need a fresh take? Get an instant paraphrase of this document with our AI Paraphraser
Elite plc should work on to reduce its payment period to the creditors. This will help the
company to improve its creditworthiness and will be able to take short-term credit from the
market easily.
Further, to improve the credit worthiness of the company the management need to check their
credit records and score on a daily basis. This helps them to identify the amount of the credits the
company yet not paid to the supplier. In order to reduce the creditors payment days, the company
need to check all its suppliers and match it with their needs. In case if the company is
unnecessary collecting raw material from any supplier which they can make in house than the
company should eliminate such creditors. The company can also negotiate better payment terms
in order to develop good relationship with the suppliers.
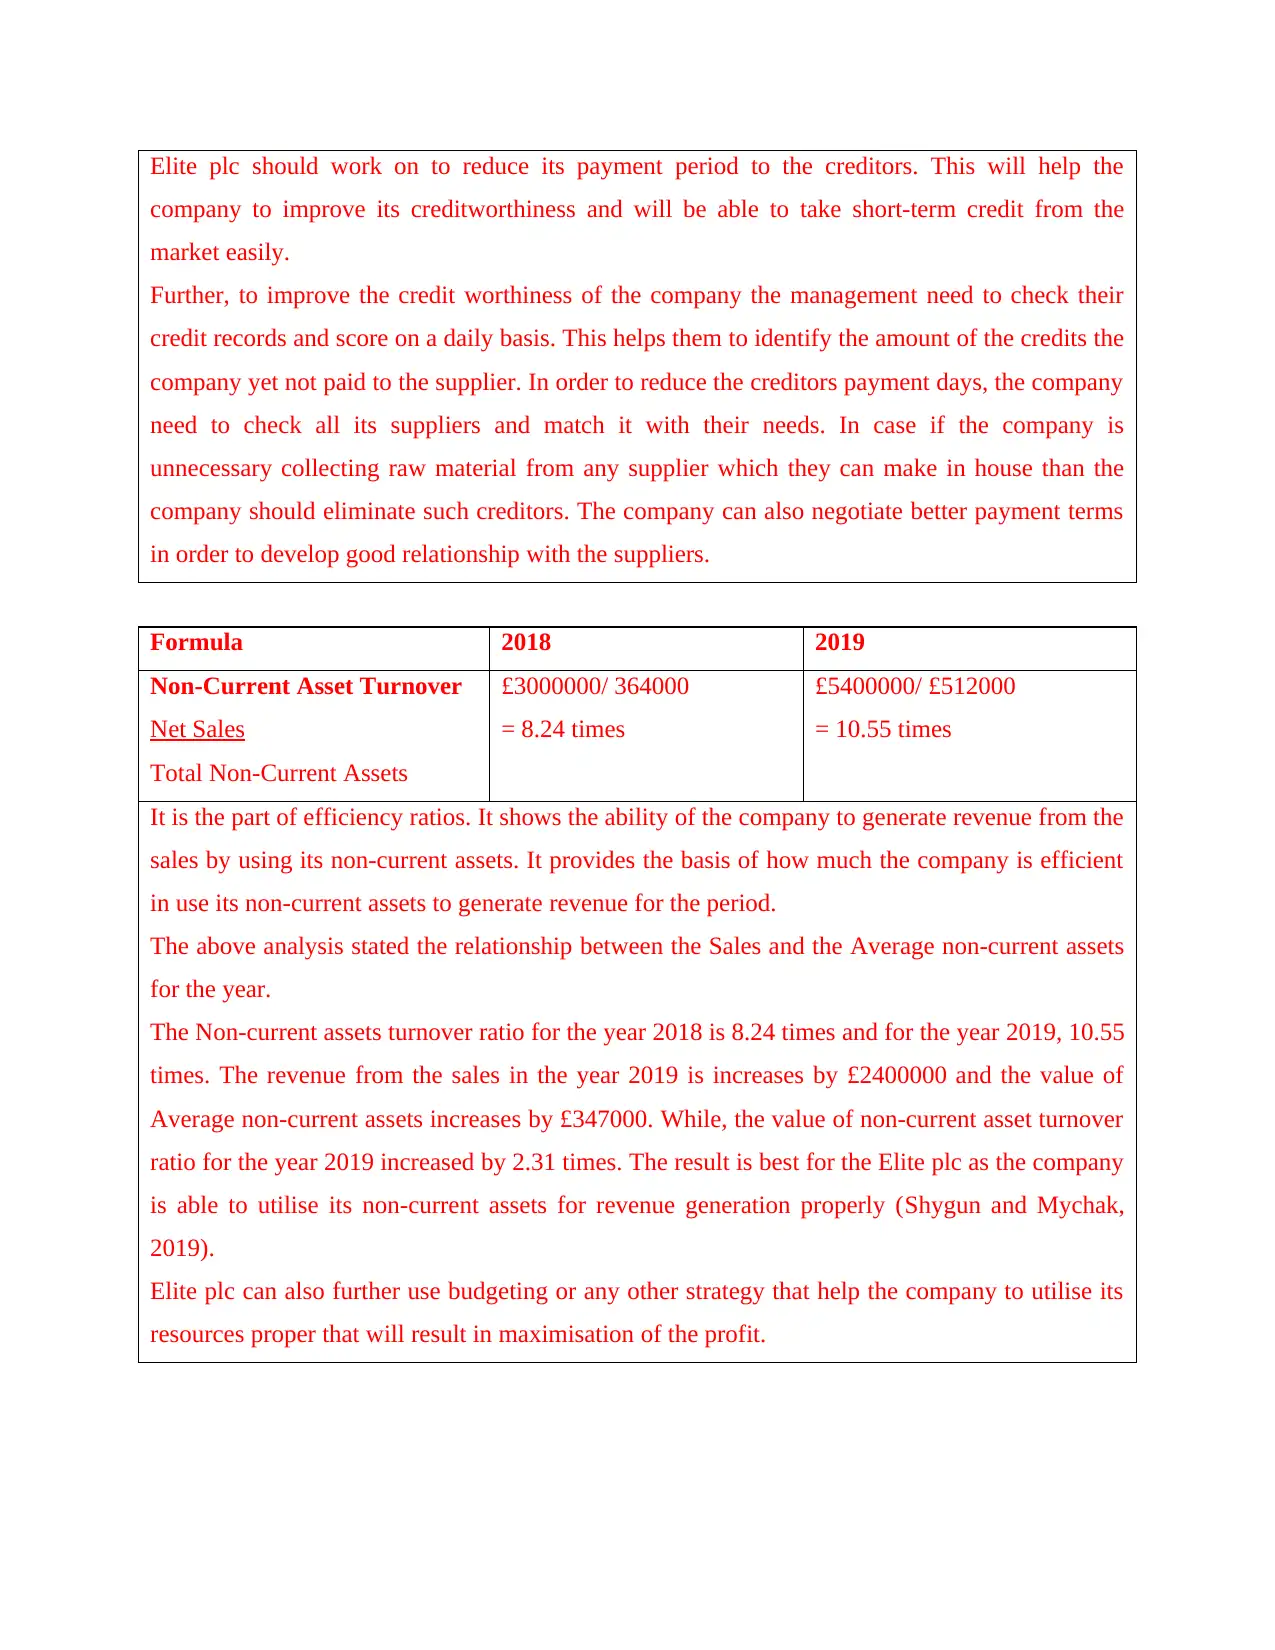
Formula 2018 2019
Non-Current Asset Turnover
Net Sales
Total Non-Current Assets
£3000000/ 364000
= 8.24 times
£5400000/ £512000
= 10.55 times
It is the part of efficiency ratios. It shows the ability of the company to generate revenue from the
sales by using its non-current assets. It provides the basis of how much the company is efficient
in use its non-current assets to generate revenue for the period.
The above analysis stated the relationship between the Sales and the Average non-current assets
for the year.
The Non-current assets turnover ratio for the year 2018 is 8.24 times and for the year 2019, 10.55
times. The revenue from the sales in the year 2019 is increases by £2400000 and the value of
Average non-current assets increases by £347000. While, the value of non-current asset turnover
ratio for the year 2019 increased by 2.31 times. The result is best for the Elite plc as the company
is able to utilise its non-current assets for revenue generation properly (Shygun and Mychak,
2019).
Elite plc can also further use budgeting or any other strategy that help the company to utilise its
resources proper that will result in maximisation of the profit.
company to improve its creditworthiness and will be able to take short-term credit from the
market easily.
Further, to improve the credit worthiness of the company the management need to check their
credit records and score on a daily basis. This helps them to identify the amount of the credits the
company yet not paid to the supplier. In order to reduce the creditors payment days, the company
need to check all its suppliers and match it with their needs. In case if the company is
unnecessary collecting raw material from any supplier which they can make in house than the
company should eliminate such creditors. The company can also negotiate better payment terms
in order to develop good relationship with the suppliers.
Formula 2018 2019
Non-Current Asset Turnover
Net Sales
Total Non-Current Assets
£3000000/ 364000
= 8.24 times
£5400000/ £512000
= 10.55 times
It is the part of efficiency ratios. It shows the ability of the company to generate revenue from the
sales by using its non-current assets. It provides the basis of how much the company is efficient
in use its non-current assets to generate revenue for the period.
The above analysis stated the relationship between the Sales and the Average non-current assets
for the year.
The Non-current assets turnover ratio for the year 2018 is 8.24 times and for the year 2019, 10.55
times. The revenue from the sales in the year 2019 is increases by £2400000 and the value of
Average non-current assets increases by £347000. While, the value of non-current asset turnover
ratio for the year 2019 increased by 2.31 times. The result is best for the Elite plc as the company
is able to utilise its non-current assets for revenue generation properly (Shygun and Mychak,
2019).
Elite plc can also further use budgeting or any other strategy that help the company to utilise its
resources proper that will result in maximisation of the profit.
CONCLUSION
This report concludes the ratio analysis of the Elite Plc. which indicate its profitability,
efficiency and liquidity position in the market. This report also concludes that the company need
to improve its efficiency ratio such as debtor’s collection period and creditors payment period.
And for this the report also recommend the strategy which help the company in achieving so
(Palepu and et.al, 2020). The report also states the current ratio of the company was poor which
indicate that the company is unable to pay its short-term obligation with the use of current assets.
The company need to finance the funds from the market in order to manage its working capital.
This report also recommend that further measures help the company in improving its liquidity
position. By conducting ratio analysis on the basis of its financial information it has been found
that Elite plc is able to optimise its revenue and profits in the year 2019 as compare to the year
2018. The gross profit ratio, operating profit ratio and return on capital employed shows better
results. The current ratio shows a slight decrease and the acid test ratio shows negative results.
While, the Trade receivable turnover ratio, trade payable turnover ratio and non-current turnover
ratio shows worse results. By improving the efficiency, Elite plc will be able to maximise profits.
⊘ This is a preview!⊘
Do you want full access?
Subscribe today to unlock all pages.
Trusted by 1+ million students worldwide
REFERENCES
Books and Journals
Chasanah, N. and Sucipto, A., 2019. Liquidity ratio, profitability, and solvency on stock returns
with capital structure as an intervening variable (study on food and beverage sub sector listed in
Indonesia Stock Exchange (Idx) period 2013-2017). Ekspektra: Jurnal Bisnis dan
Manajemen, 3(1). pp.52-68.
Ilter, C., 2019. A Discussion Paper on Accounts Payable Ratio. Acta Oeconomica
Pragensia, 2019(3-4), pp.85-94.
Kljenak and et.al, 2019. The operative profit margin and interest cost in retail food. Економика
пољопривреде, 66(3).
Mayes, T.R., 2020. Financial analysis with microsoft excel. Cengage Learning.
Mørch et.al, 2017. Maximizing the rate of return on the capital employed in shipping capacity
renewal. Omega, 67, pp.42-53.
Mulyadi, D. and Sihabudin, O.S., 2020. Analysis of Current Ratio, Net Profit Margin, and Good
Corporate Governance against Company Value. Systematic Reviews in Pharmacy, 11(1), pp.588-
600.
Palepu and et.al, 2020. Business analysis and valuation: Using financial statements. Cengage
AU.
Purwanti, T., 2019. An Analysis of Cash and Receivables Turnover Effect Towards Company
Profitability. International Journal of Seocology, pp.037-044.
Shygun, M. and Mychak, N., 2019. Ratio Analysis for Operations with Non-Current Assets Held
For Sale. Przestrzeń, Ekonomia, Społeczeństwo, (15/I), pp.149-167.
Wild, J., 2019. Financial Accounting: Information for Decisions, 9e.
Online
Financial analysis, 2021. [Online]. Available through
<https://efinancemanagement.com/financial-analysis >
Management Accounting - Ratio Analysis, 2021. [Online]. Available through <
https://www.tutorialspoint.com/accounting_basics/management_accounting_ratio_analysis.htm>
1 out of 10
Related Documents


Your All-in-One AI-Powered Toolkit for Academic Success.
+13062052269
info@desklib.com
Available 24*7 on WhatsApp / Email
![[object Object]](/_next/static/media/star-bottom.7253800d.svg)
Unlock your academic potential
Copyright © 2020–2026 A2Z Services. All Rights Reserved. Developed and managed by ZUCOL.