Financial Analysis and Investment Appraisal Report: Elton PLC
VerifiedAdded on 2020/01/07
|16
|5427
|215
Report
AI Summary
This report provides a comprehensive financial analysis of Elton PLC, examining its business performance through ratio analysis, interpretation of the profit and loss statement, and assessment of the statement of financial position. The analysis covers profitability, liquidity, solvency, and efficiency ratios for 2014 and 2015. The report also includes an evaluation of the cash flow statement, highlighting both inflows and outflows. Furthermore, the report delves into investment appraisal techniques such as NPV, ARR, and payback period, advising against a proposed investment. Finally, the report offers recommendations on sources of finance, suggesting bank loans and the issuance of shares. The report also acknowledges the limitations of financial statements.

FINANCIAL DECISION MAKING
Paraphrase This Document
Need a fresh take? Get an instant paraphrase of this document with our AI Paraphraser
TABLE OF CONTENTS
Executive summary..........................................................................................................................3
Part 1: Business performance Analysis............................................................................................3
Interpretation of statement of profit or loss.................................................................................3
Assessment of statement of financial position.............................................................................5
Analyzing the cash flow statement..............................................................................................7
Limitations of financial statements..............................................................................................7
Part 2: Investment Appraisal............................................................................................................8
Critically evaluating investment appraisal techniques by taking into account the benefits and
limitations of each method...........................................................................................................8
Advising the Board of Directors about the non-financial factors which Elton Plc need to
consider while expanding business operations in international market.....................................11
Advising higher management in relation to the sources of finance which they need to
undertake for raising finance.....................................................................................................12
Conclusion.....................................................................................................................................13
References......................................................................................................................................14
EXECUTIVE SUMMARY
Present report emphasis on assessing the financial performance of Elton plc. However,
with the help of ratio analysis, financial position of cited firm has been analysed and it resulted
that company is unable to maintain adequate amount of finance to carry out business operations.
But liquidity position of firm is suitable enough to overcome short term financial obligations.
Along with this researcher focuses on assessing the viability of available investment proposal for
Elton plc through tools like NPV, ARR and payback period and it has been suggested that firm
should reject the proposal. Lastly, two sources of funds has been suggested to top level
management of Elton plc i.e. bank loan and issue of shares.
PART 1: BUSINESS PERFORMANCE ANALYSIS
Business performance analysis means analyzing business performance on the basis of its
financial figures and strategic position that it have in the industry. In order to understand business
performance various models like SWOT and PESTEL are used along with ratio analysis. Hence,
it can be said that business performance analysis helps in reviewing firm internal and external
conditions.
1.2 Interpretation of statement of profit or loss
In general, ratio analysis refers to the financial tool of assessing the performance of
business on the four components of business i.e. profitability, solvency, efficiency and liquidity
(Uechi and et.al, 2015). Through the means of this, managers can easily evaluate the financial
health and performance of business in comparison to previous year performance, competitors
and industry averages. According to the given case, ratio analysis is an effective tool for the
management of Elton plc in regards to make strategic framework for improving the overall
performance of the company (Hatzinger, Böhlke and Sturchio, 2013).
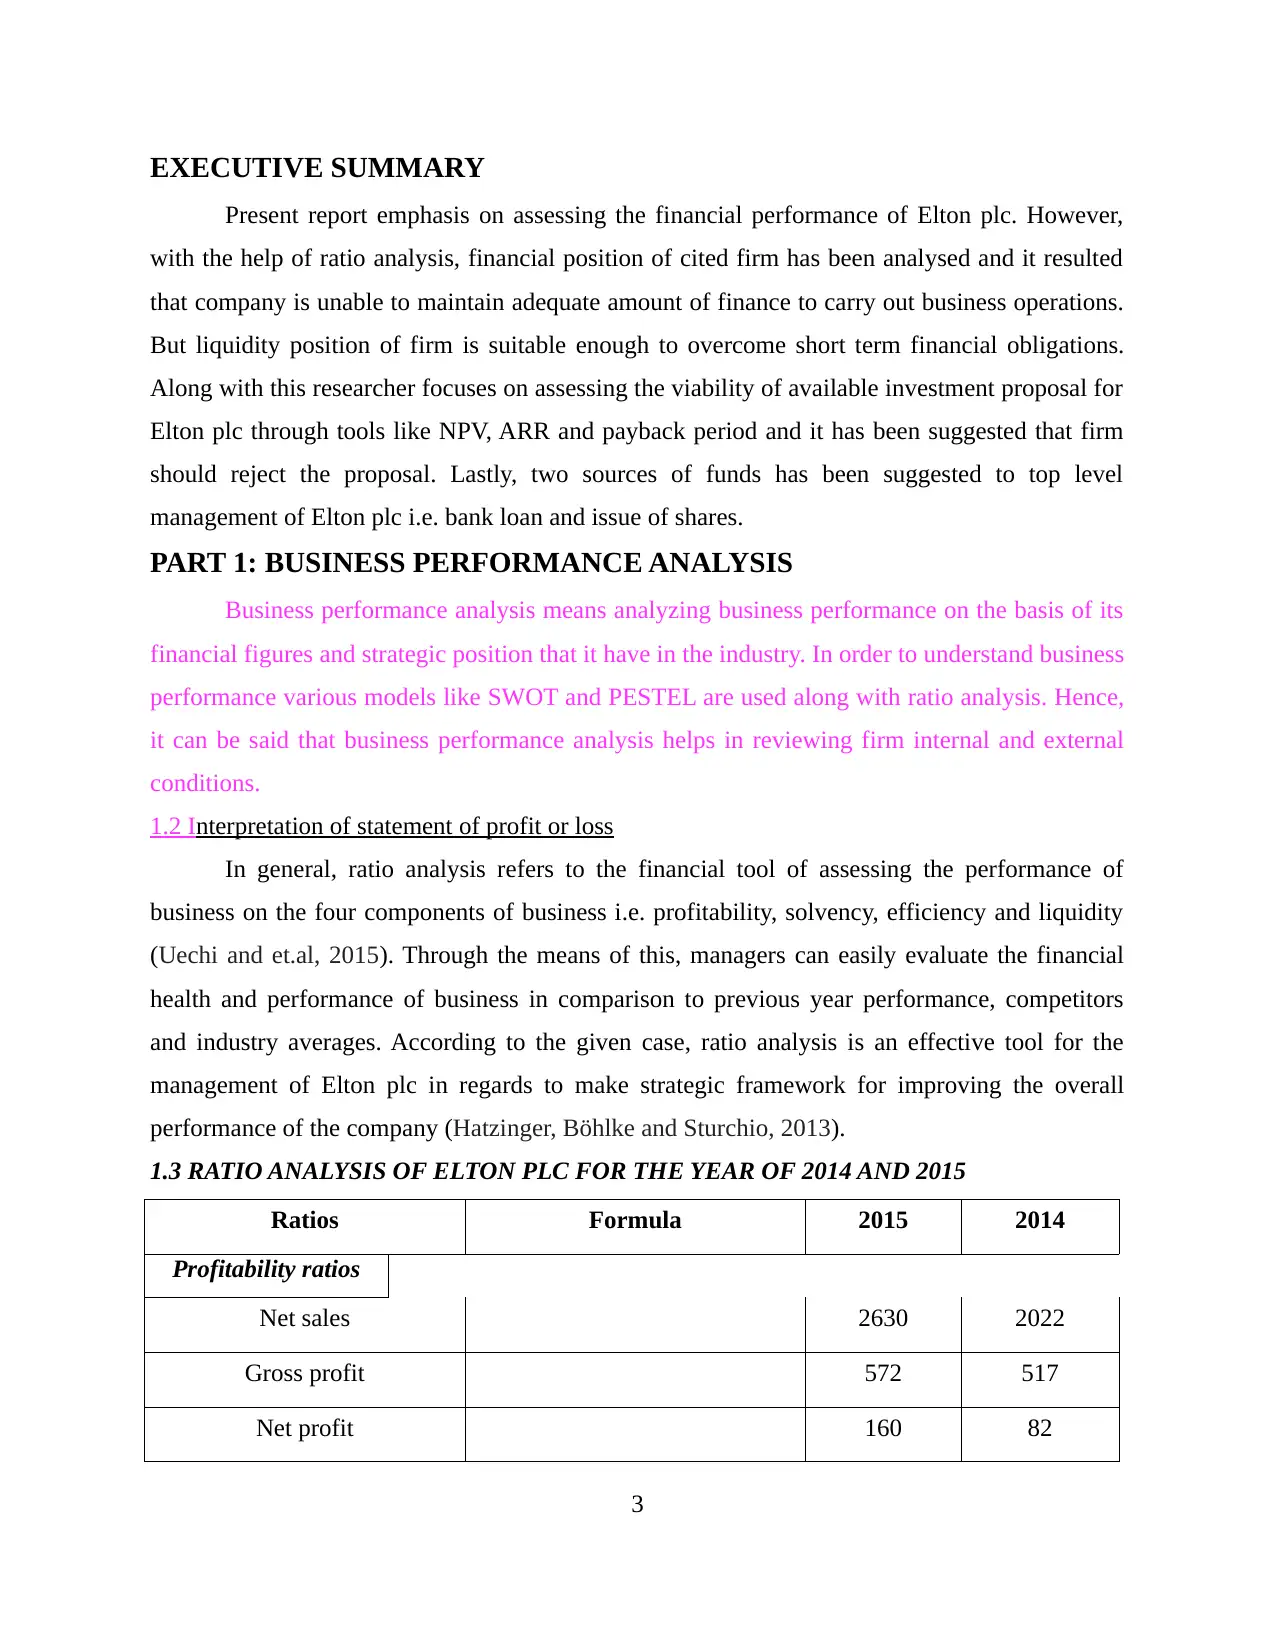
1.3 RATIO ANALYSIS OF ELTON PLC FOR THE YEAR OF 2014 AND 2015
Ratios Formula 2015 2014
Profitability ratios
Net sales 2630 2022
Gross profit 572 517
Net profit 160 82
3
Present report emphasis on assessing the financial performance of Elton plc. However,
with the help of ratio analysis, financial position of cited firm has been analysed and it resulted
that company is unable to maintain adequate amount of finance to carry out business operations.
But liquidity position of firm is suitable enough to overcome short term financial obligations.
Along with this researcher focuses on assessing the viability of available investment proposal for
Elton plc through tools like NPV, ARR and payback period and it has been suggested that firm
should reject the proposal. Lastly, two sources of funds has been suggested to top level
management of Elton plc i.e. bank loan and issue of shares.
PART 1: BUSINESS PERFORMANCE ANALYSIS
Business performance analysis means analyzing business performance on the basis of its
financial figures and strategic position that it have in the industry. In order to understand business
performance various models like SWOT and PESTEL are used along with ratio analysis. Hence,
it can be said that business performance analysis helps in reviewing firm internal and external
conditions.
1.2 Interpretation of statement of profit or loss
In general, ratio analysis refers to the financial tool of assessing the performance of
business on the four components of business i.e. profitability, solvency, efficiency and liquidity
(Uechi and et.al, 2015). Through the means of this, managers can easily evaluate the financial
health and performance of business in comparison to previous year performance, competitors
and industry averages. According to the given case, ratio analysis is an effective tool for the
management of Elton plc in regards to make strategic framework for improving the overall
performance of the company (Hatzinger, Böhlke and Sturchio, 2013).
1.3 RATIO ANALYSIS OF ELTON PLC FOR THE YEAR OF 2014 AND 2015
Ratios Formula 2015 2014
Profitability ratios
Net sales 2630 2022
Gross profit 572 517
Net profit 160 82
3
⊘ This is a preview!⊘
Do you want full access?
Subscribe today to unlock all pages.
Trusted by 1+ million students worldwide
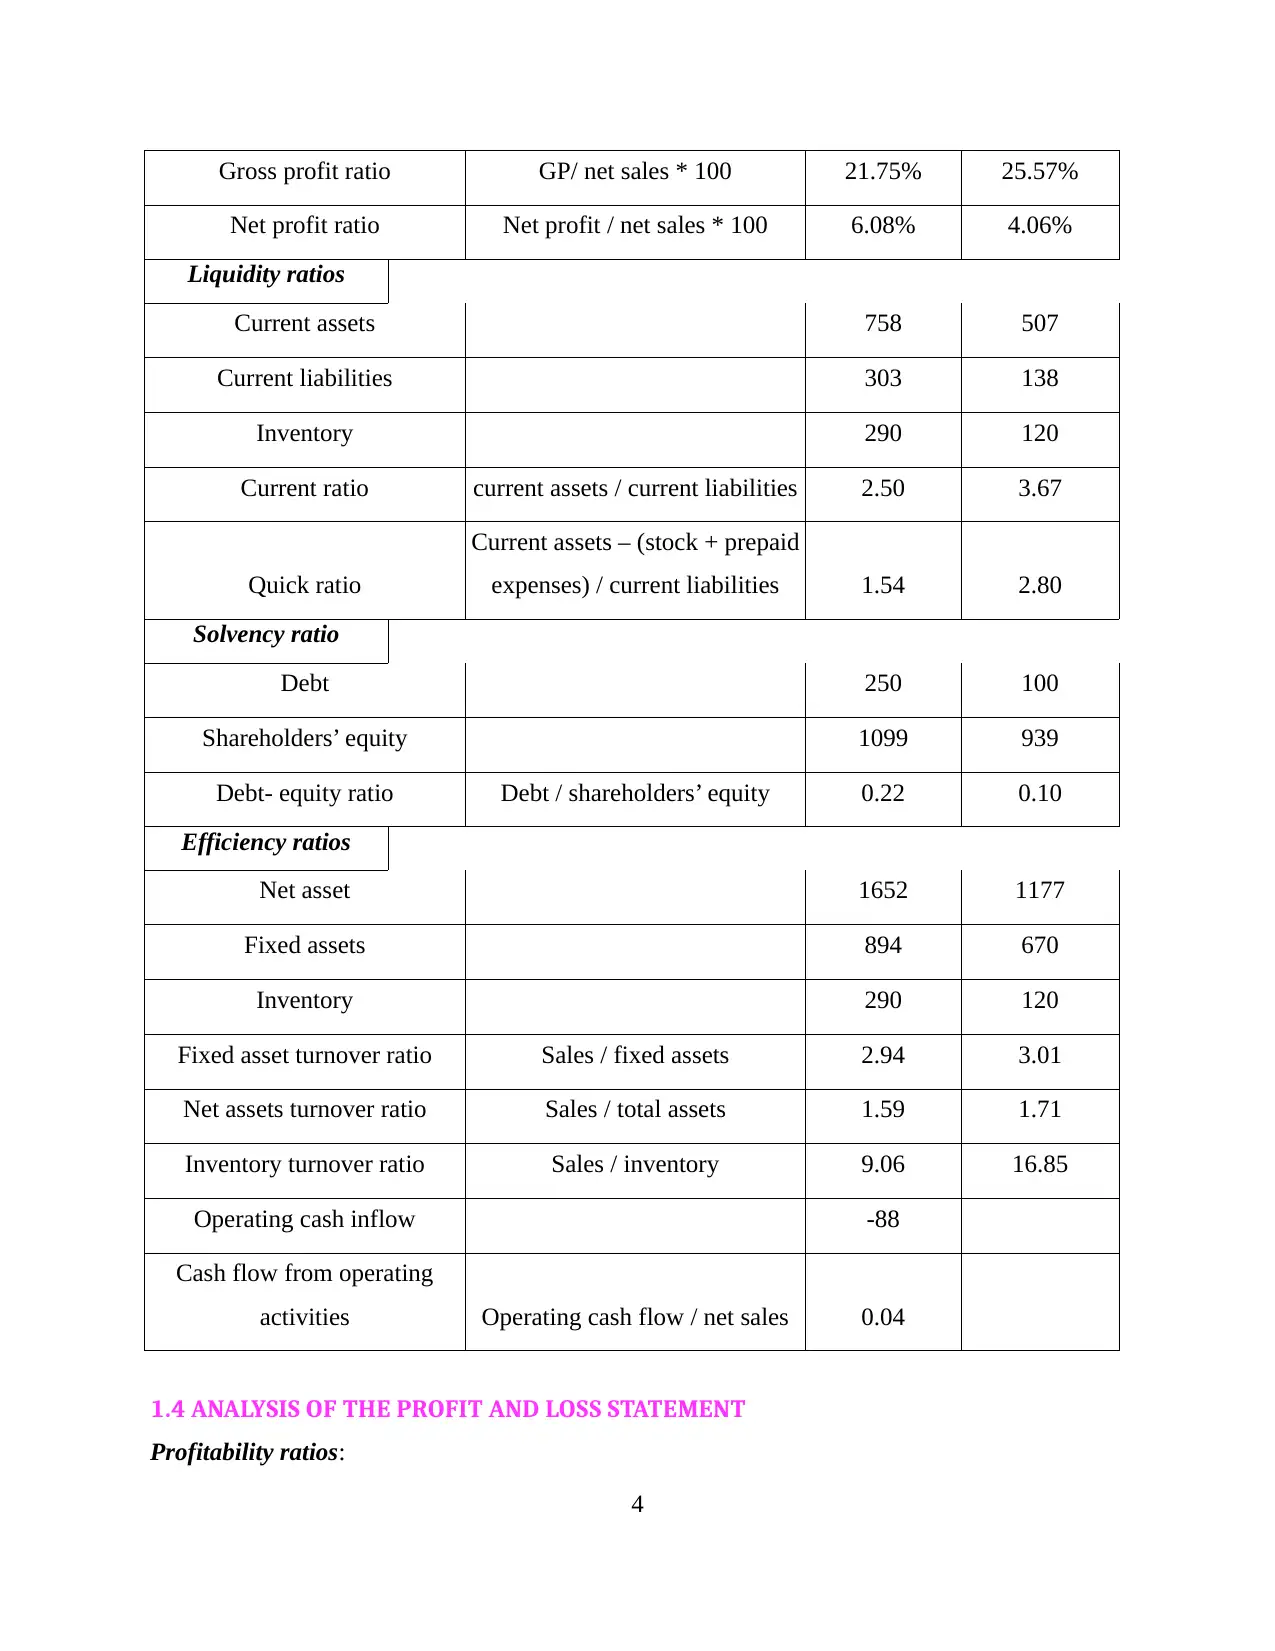
Gross profit ratio GP/ net sales * 100 21.75% 25.57%
Net profit ratio Net profit / net sales * 100 6.08% 4.06%
Liquidity ratios
Current assets 758 507
Current liabilities 303 138
Inventory 290 120
Current ratio current assets / current liabilities 2.50 3.67
Quick ratio
Current assets – (stock + prepaid
expenses) / current liabilities 1.54 2.80
Solvency ratio
Debt 250 100
Shareholders’ equity 1099 939
Debt- equity ratio Debt / shareholders’ equity 0.22 0.10
Efficiency ratios
Net asset 1652 1177
Fixed assets 894 670
Inventory 290 120
Fixed asset turnover ratio Sales / fixed assets 2.94 3.01
Net assets turnover ratio Sales / total assets 1.59 1.71
Inventory turnover ratio Sales / inventory 9.06 16.85
Operating cash inflow -88
Cash flow from operating
activities Operating cash flow / net sales 0.04
1.4 ANALYSIS OF THE PROFIT AND LOSS STATEMENT
Profitability ratios:
4
Paraphrase This Document
Need a fresh take? Get an instant paraphrase of this document with our AI Paraphraser
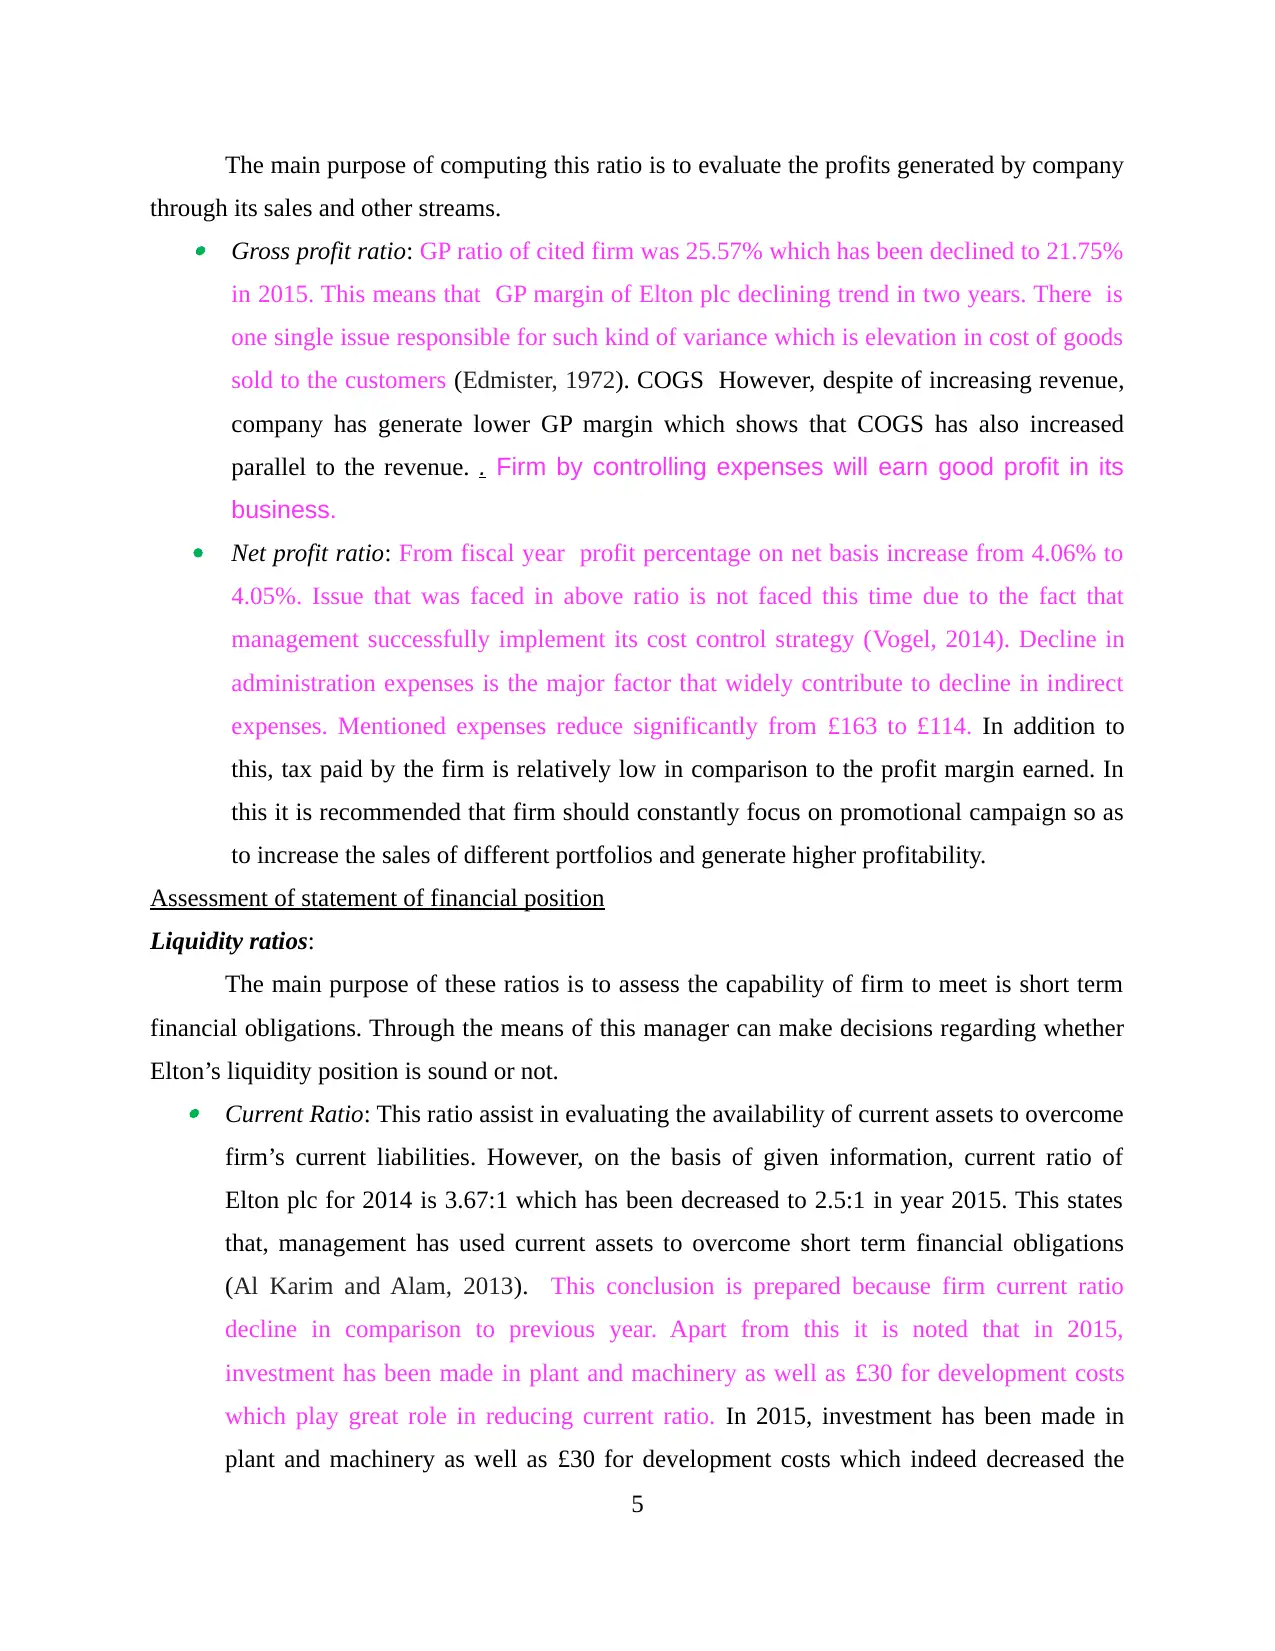
The main purpose of computing this ratio is to evaluate the profits generated by company
through its sales and other streams. Gross profit ratio: GP ratio of cited firm was 25.57% which has been declined to 21.75%
in 2015. This means that GP margin of Elton plc declining trend in two years. There is
one single issue responsible for such kind of variance which is elevation in cost of goods
sold to the customers (Edmister, 1972). COGS However, despite of increasing revenue,
company has generate lower GP margin which shows that COGS has also increased
parallel to the revenue. . Firm by controlling expenses will earn good profit in its
business.
Net profit ratio: From fiscal year profit percentage on net basis increase from 4.06% to
4.05%. Issue that was faced in above ratio is not faced this time due to the fact that
management successfully implement its cost control strategy (Vogel, 2014). Decline in
administration expenses is the major factor that widely contribute to decline in indirect
expenses. Mentioned expenses reduce significantly from £163 to £114. In addition to
this, tax paid by the firm is relatively low in comparison to the profit margin earned. In
this it is recommended that firm should constantly focus on promotional campaign so as
to increase the sales of different portfolios and generate higher profitability.
Assessment of statement of financial position
Liquidity ratios:
The main purpose of these ratios is to assess the capability of firm to meet is short term
financial obligations. Through the means of this manager can make decisions regarding whether
Elton’s liquidity position is sound or not. Current Ratio: This ratio assist in evaluating the availability of current assets to overcome
firm’s current liabilities. However, on the basis of given information, current ratio of
Elton plc for 2014 is 3.67:1 which has been decreased to 2.5:1 in year 2015. This states
that, management has used current assets to overcome short term financial obligations
(Al Karim and Alam, 2013). This conclusion is prepared because firm current ratio
decline in comparison to previous year. Apart from this it is noted that in 2015,
investment has been made in plant and machinery as well as £30 for development costs
which play great role in reducing current ratio. In 2015, investment has been made in
plant and machinery as well as £30 for development costs which indeed decreased the
5
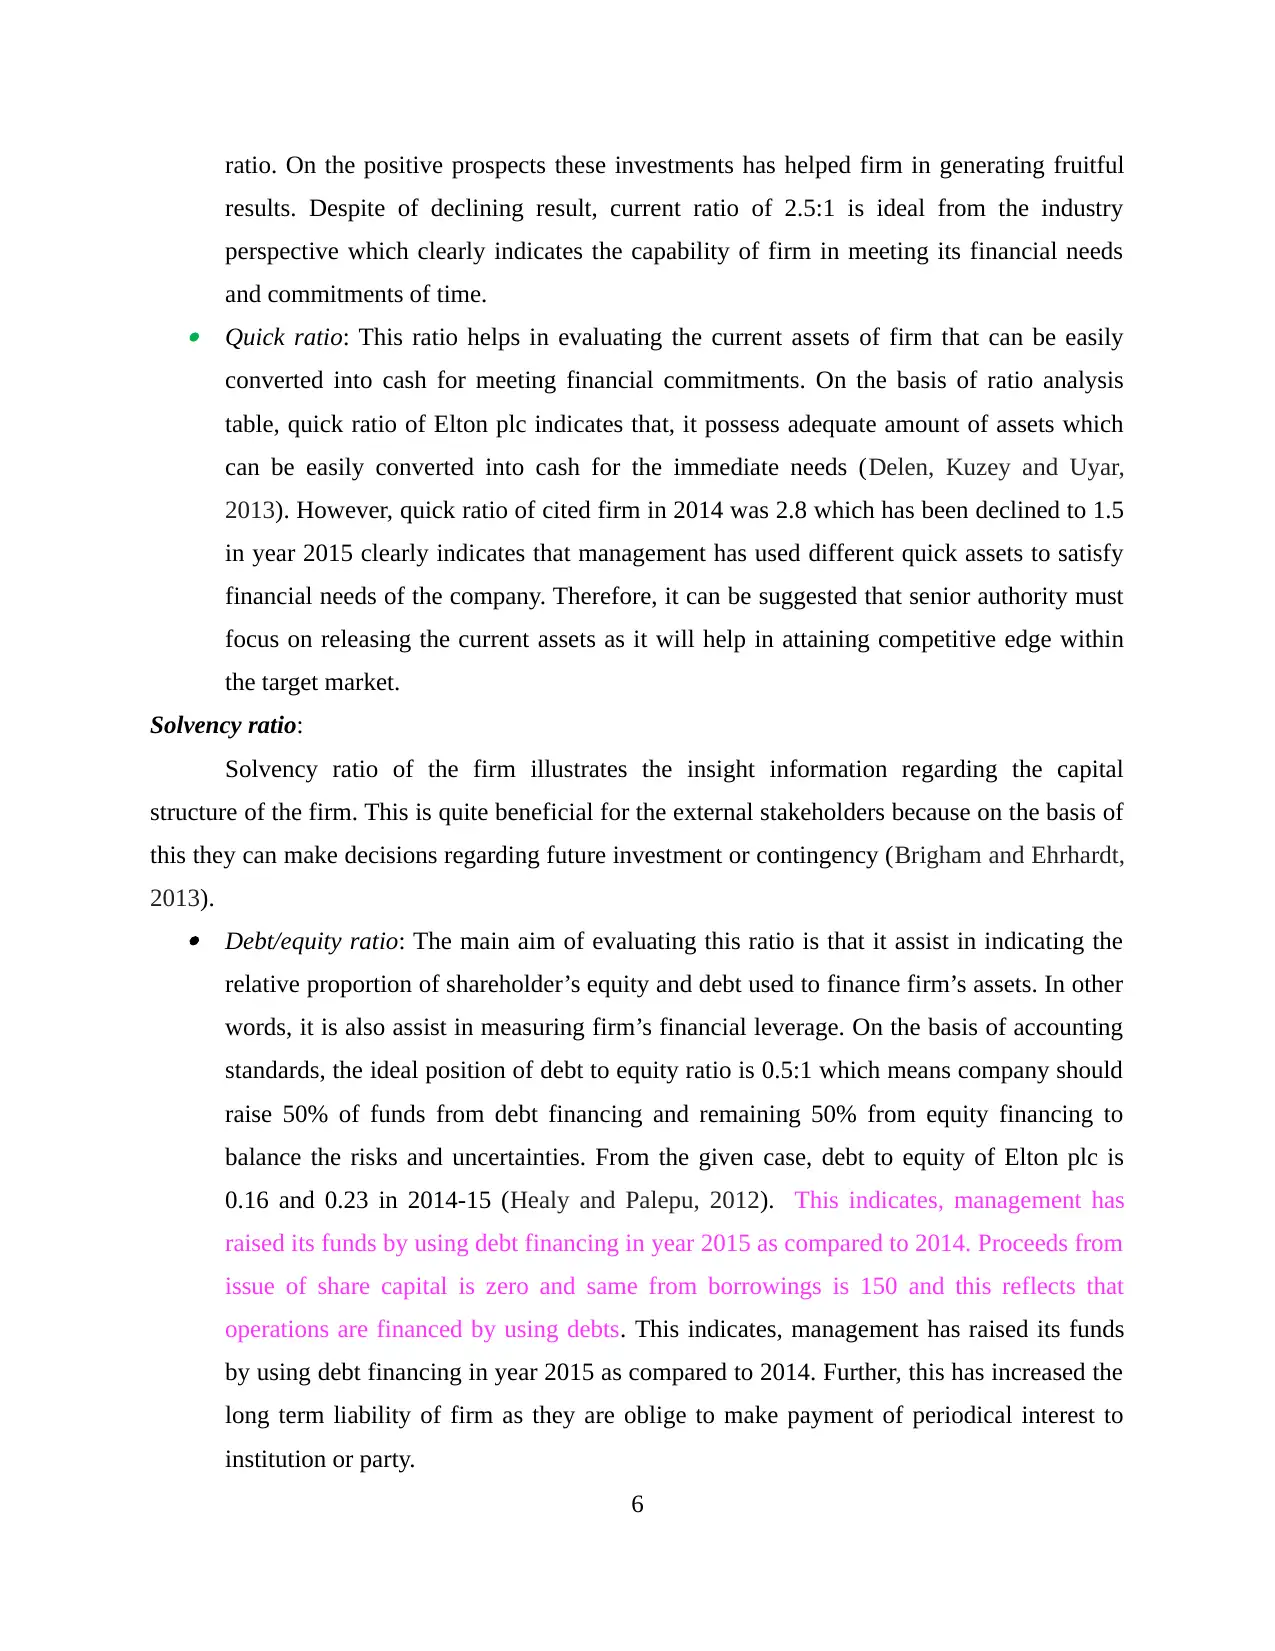
ratio. On the positive prospects these investments has helped firm in generating fruitful
results. Despite of declining result, current ratio of 2.5:1 is ideal from the industry
perspective which clearly indicates the capability of firm in meeting its financial needs
and commitments of time. Quick ratio: This ratio helps in evaluating the current assets of firm that can be easily
converted into cash for meeting financial commitments. On the basis of ratio analysis
table, quick ratio of Elton plc indicates that, it possess adequate amount of assets which
can be easily converted into cash for the immediate needs (Delen, Kuzey and Uyar,
2013). However, quick ratio of cited firm in 2014 was 2.8 which has been declined to 1.5
in year 2015 clearly indicates that management has used different quick assets to satisfy
financial needs of the company. Therefore, it can be suggested that senior authority must
focus on releasing the current assets as it will help in attaining competitive edge within
the target market.
Solvency ratio:
Solvency ratio of the firm illustrates the insight information regarding the capital
structure of the firm. This is quite beneficial for the external stakeholders because on the basis of
this they can make decisions regarding future investment or contingency (Brigham and Ehrhardt,
2013). Debt/equity ratio: The main aim of evaluating this ratio is that it assist in indicating the
relative proportion of shareholder’s equity and debt used to finance firm’s assets. In other
words, it is also assist in measuring firm’s financial leverage. On the basis of accounting
standards, the ideal position of debt to equity ratio is 0.5:1 which means company should
raise 50% of funds from debt financing and remaining 50% from equity financing to
balance the risks and uncertainties. From the given case, debt to equity of Elton plc is
0.16 and 0.23 in 2014-15 (Healy and Palepu, 2012). This indicates, management has
raised its funds by using debt financing in year 2015 as compared to 2014. Proceeds from
issue of share capital is zero and same from borrowings is 150 and this reflects that
operations are financed by using debts. This indicates, management has raised its funds
by using debt financing in year 2015 as compared to 2014. Further, this has increased the
long term liability of firm as they are oblige to make payment of periodical interest to
institution or party.
6
⊘ This is a preview!⊘
Do you want full access?
Subscribe today to unlock all pages.
Trusted by 1+ million students worldwide
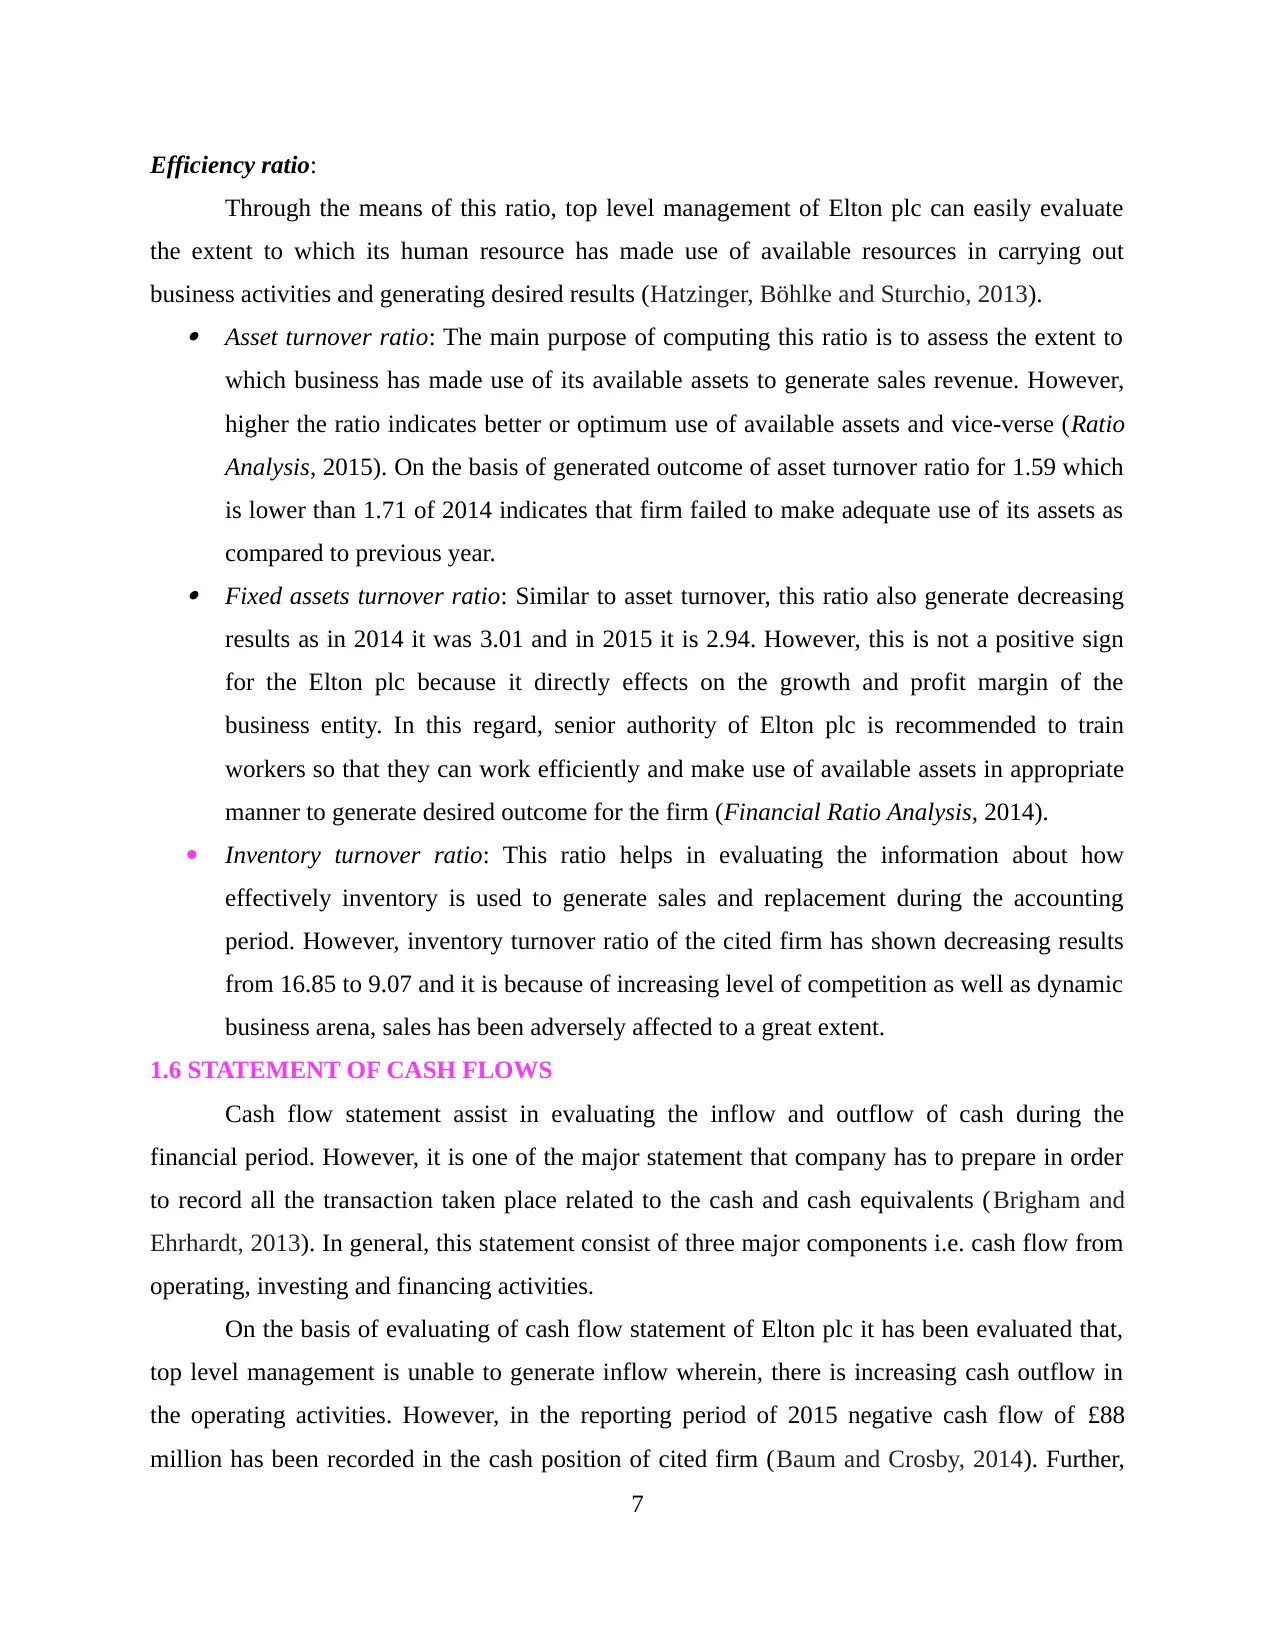
Efficiency ratio:
Through the means of this ratio, top level management of Elton plc can easily evaluate
the extent to which its human resource has made use of available resources in carrying out
business activities and generating desired results (Hatzinger, Böhlke and Sturchio, 2013). Asset turnover ratio: The main purpose of computing this ratio is to assess the extent to
which business has made use of its available assets to generate sales revenue. However,
higher the ratio indicates better or optimum use of available assets and vice-verse (Ratio
Analysis, 2015). On the basis of generated outcome of asset turnover ratio for 1.59 which
is lower than 1.71 of 2014 indicates that firm failed to make adequate use of its assets as
compared to previous year. Fixed assets turnover ratio: Similar to asset turnover, this ratio also generate decreasing
results as in 2014 it was 3.01 and in 2015 it is 2.94. However, this is not a positive sign
for the Elton plc because it directly effects on the growth and profit margin of the
business entity. In this regard, senior authority of Elton plc is recommended to train
workers so that they can work efficiently and make use of available assets in appropriate
manner to generate desired outcome for the firm (Financial Ratio Analysis, 2014).
Inventory turnover ratio: This ratio helps in evaluating the information about how
effectively inventory is used to generate sales and replacement during the accounting
period. However, inventory turnover ratio of the cited firm has shown decreasing results
from 16.85 to 9.07 and it is because of increasing level of competition as well as dynamic
business arena, sales has been adversely affected to a great extent.
1.6 STATEMENT OF CASH FLOWS
Cash flow statement assist in evaluating the inflow and outflow of cash during the
financial period. However, it is one of the major statement that company has to prepare in order
to record all the transaction taken place related to the cash and cash equivalents (Brigham and
Ehrhardt, 2013). In general, this statement consist of three major components i.e. cash flow from
operating, investing and financing activities.
On the basis of evaluating of cash flow statement of Elton plc it has been evaluated that,
top level management is unable to generate inflow wherein, there is increasing cash outflow in
the operating activities. However, in the reporting period of 2015 negative cash flow of £88
million has been recorded in the cash position of cited firm (Baum and Crosby, 2014). Further,
7
Paraphrase This Document
Need a fresh take? Get an instant paraphrase of this document with our AI Paraphraser
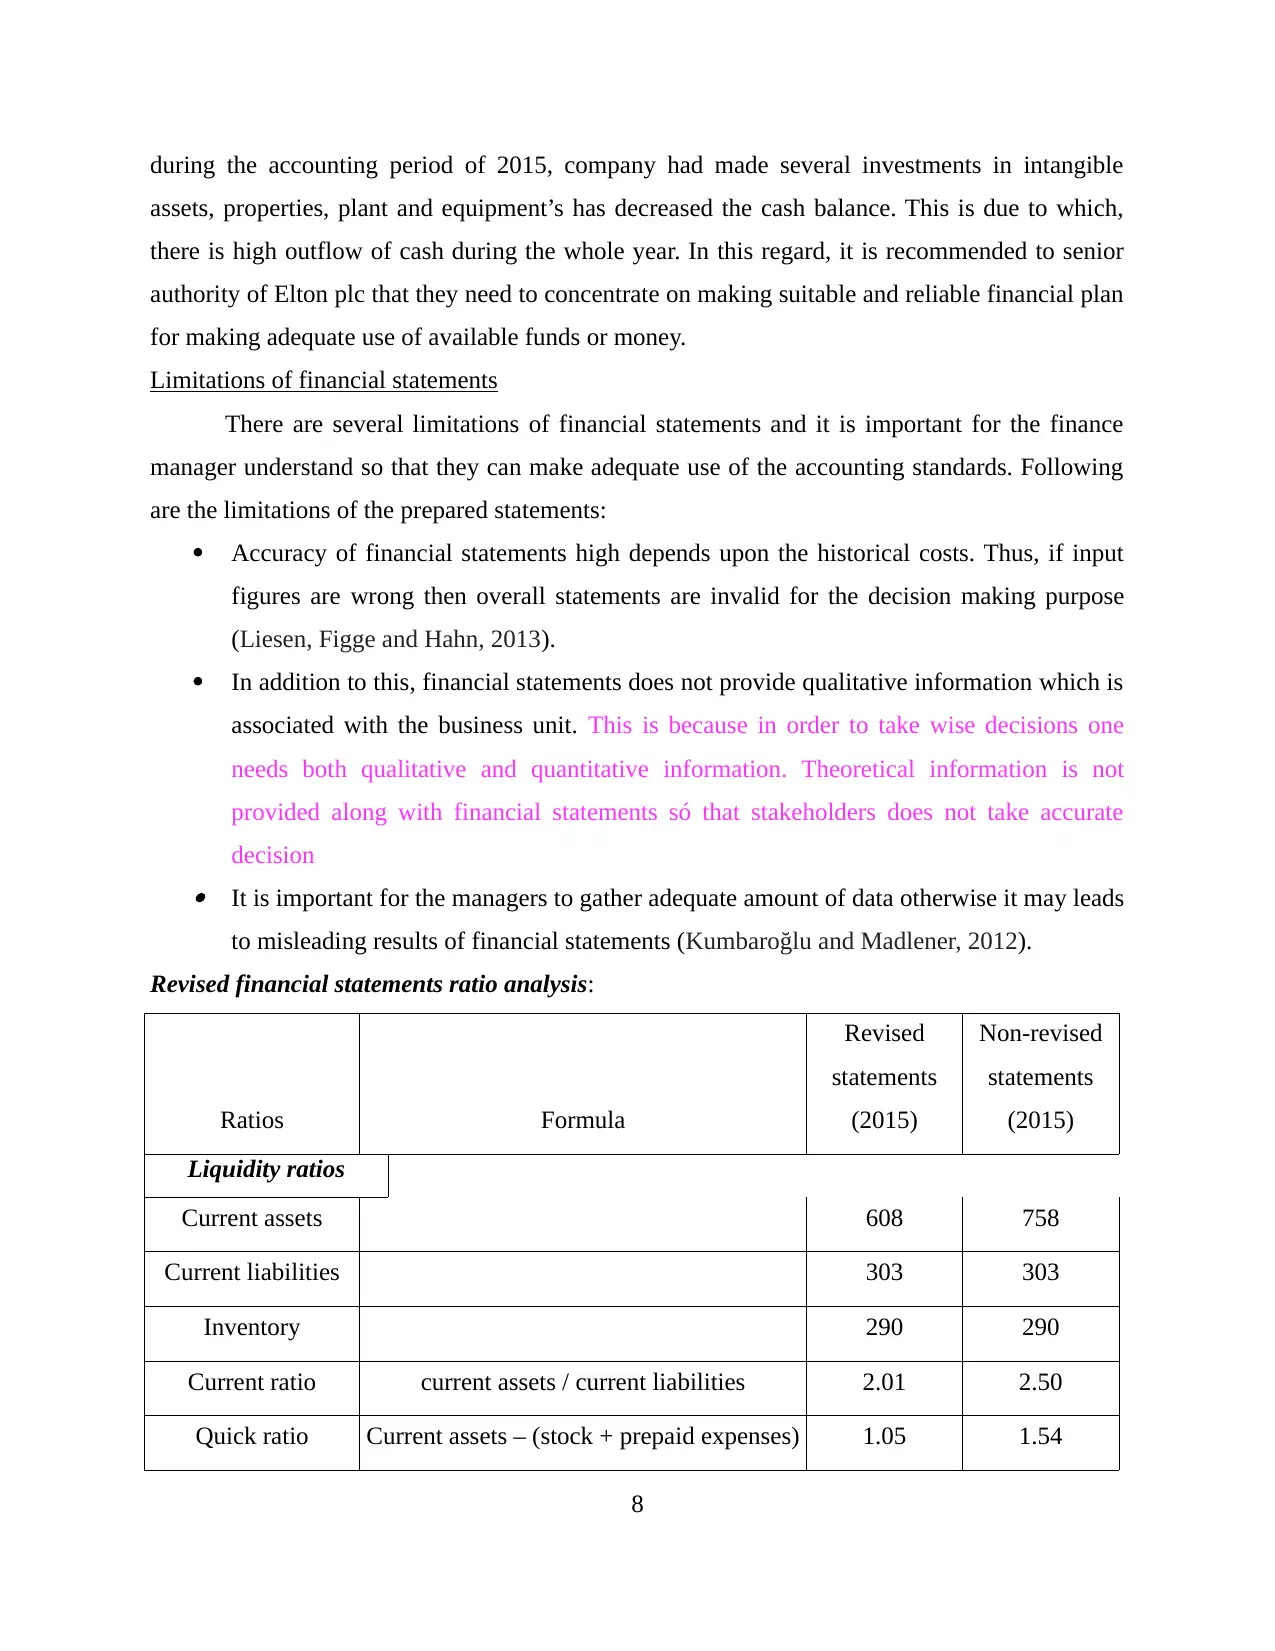
during the accounting period of 2015, company had made several investments in intangible
assets, properties, plant and equipment’s has decreased the cash balance. This is due to which,
there is high outflow of cash during the whole year. In this regard, it is recommended to senior
authority of Elton plc that they need to concentrate on making suitable and reliable financial plan
for making adequate use of available funds or money.
Limitations of financial statements
There are several limitations of financial statements and it is important for the finance
manager understand so that they can make adequate use of the accounting standards. Following
are the limitations of the prepared statements:
Accuracy of financial statements high depends upon the historical costs. Thus, if input
figures are wrong then overall statements are invalid for the decision making purpose
(Liesen, Figge and Hahn, 2013).
In addition to this, financial statements does not provide qualitative information which is
associated with the business unit. This is because in order to take wise decisions one
needs both qualitative and quantitative information. Theoretical information is not
provided along with financial statements só that stakeholders does not take accurate
decision It is important for the managers to gather adequate amount of data otherwise it may leads
to misleading results of financial statements (Kumbaroğlu and Madlener, 2012).
Revised financial statements ratio analysis:
Ratios Formula
Revised
statements
(2015)
Non-revised
statements
(2015)
Liquidity ratios
Current assets 608 758
Current liabilities 303 303
Inventory 290 290
Current ratio current assets / current liabilities 2.01 2.50
Quick ratio Current assets – (stock + prepaid expenses) 1.05 1.54
8
/ current liabilities
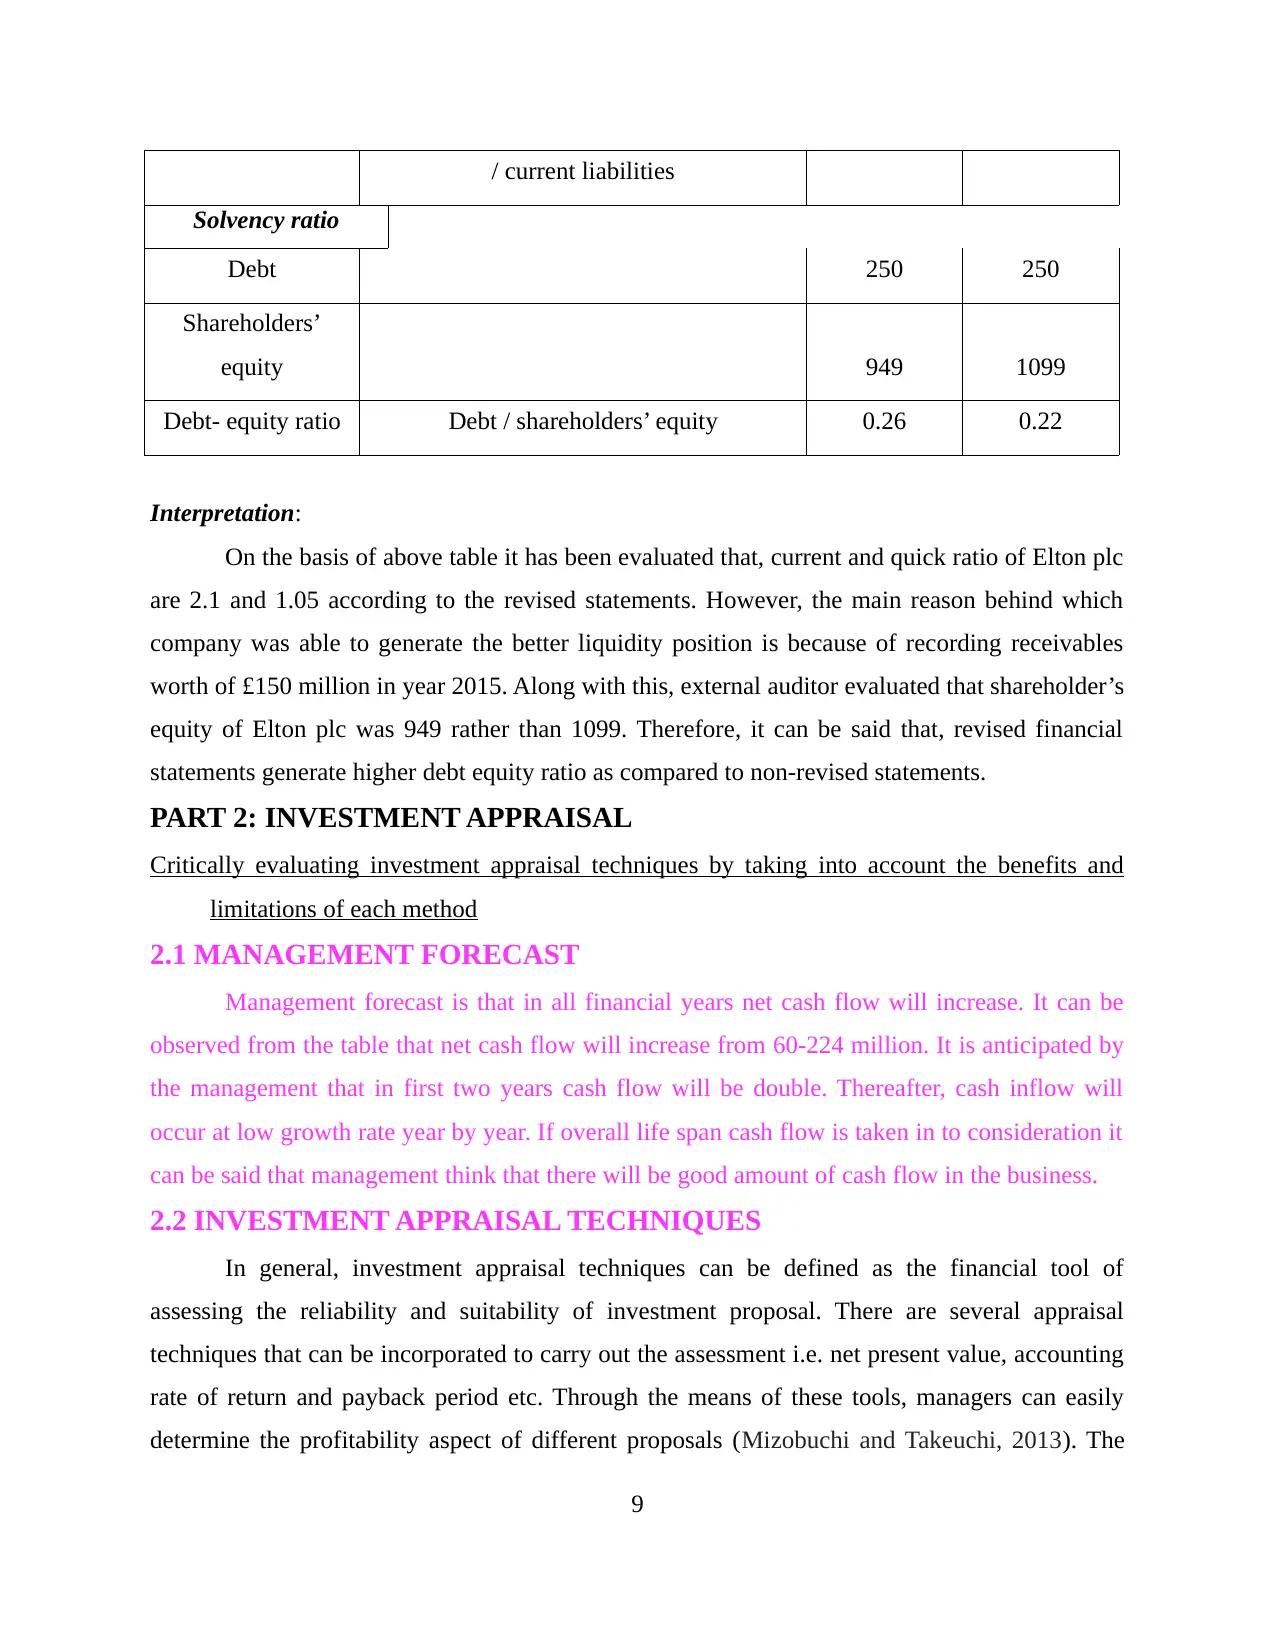
Solvency ratio
Debt 250 250
Shareholders’
equity 949 1099
Debt- equity ratio Debt / shareholders’ equity 0.26 0.22
Interpretation:
On the basis of above table it has been evaluated that, current and quick ratio of Elton plc
are 2.1 and 1.05 according to the revised statements. However, the main reason behind which
company was able to generate the better liquidity position is because of recording receivables
worth of £150 million in year 2015. Along with this, external auditor evaluated that shareholder’s
equity of Elton plc was 949 rather than 1099. Therefore, it can be said that, revised financial
statements generate higher debt equity ratio as compared to non-revised statements.
PART 2: INVESTMENT APPRAISAL
Critically evaluating investment appraisal techniques by taking into account the benefits and
limitations of each method
2.1 MANAGEMENT FORECAST
Management forecast is that in all financial years net cash flow will increase. It can be
observed from the table that net cash flow will increase from 60-224 million. It is anticipated by
the management that in first two years cash flow will be double. Thereafter, cash inflow will
occur at low growth rate year by year. If overall life span cash flow is taken in to consideration it
can be said that management think that there will be good amount of cash flow in the business.
2.2 INVESTMENT APPRAISAL TECHNIQUES
In general, investment appraisal techniques can be defined as the financial tool of
assessing the reliability and suitability of investment proposal. There are several appraisal
techniques that can be incorporated to carry out the assessment i.e. net present value, accounting
rate of return and payback period etc. Through the means of these tools, managers can easily
determine the profitability aspect of different proposals (Mizobuchi and Takeuchi, 2013). The
9
⊘ This is a preview!⊘
Do you want full access?
Subscribe today to unlock all pages.
Trusted by 1+ million students worldwide
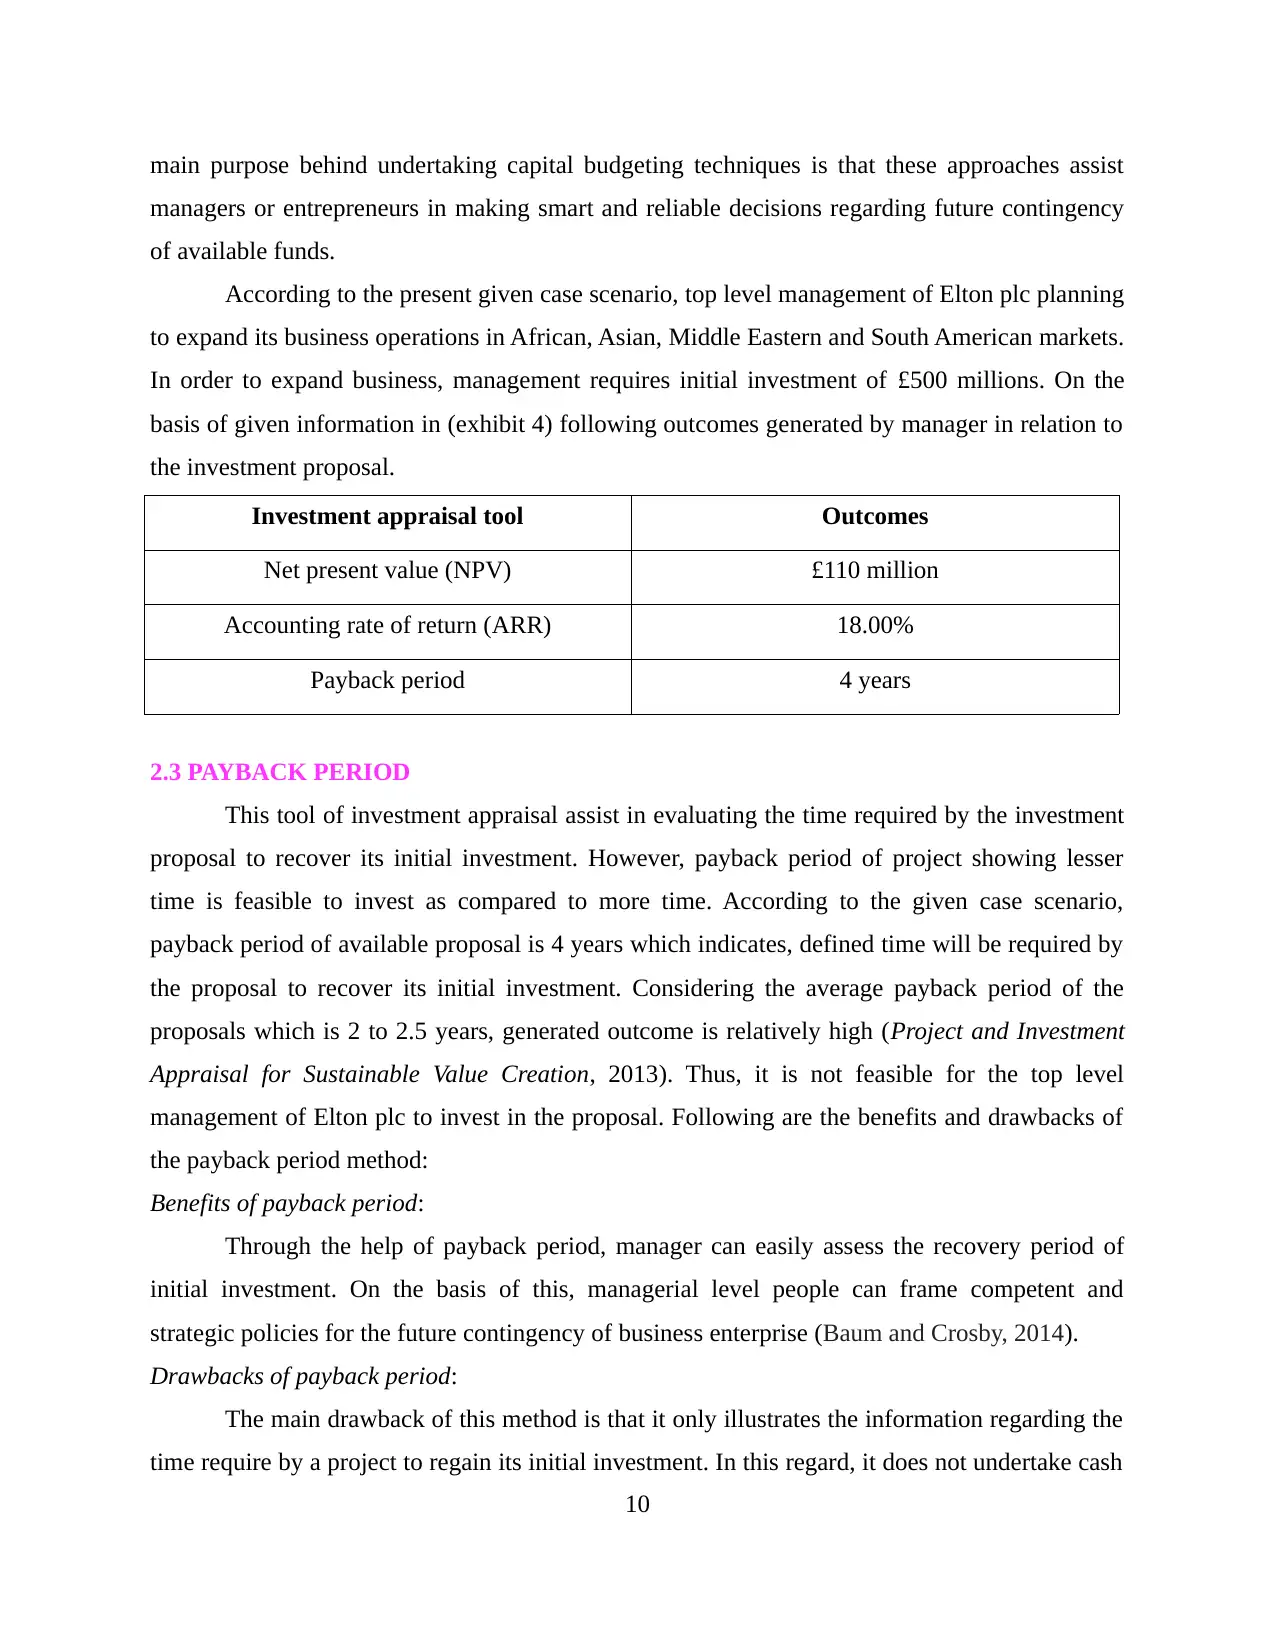
main purpose behind undertaking capital budgeting techniques is that these approaches assist
managers or entrepreneurs in making smart and reliable decisions regarding future contingency
of available funds.
According to the present given case scenario, top level management of Elton plc planning
to expand its business operations in African, Asian, Middle Eastern and South American markets.
In order to expand business, management requires initial investment of £500 millions. On the
basis of given information in (exhibit 4) following outcomes generated by manager in relation to
the investment proposal.
Investment appraisal tool Outcomes
Net present value (NPV) £110 million
Accounting rate of return (ARR) 18.00%
Payback period 4 years
2.3 PAYBACK PERIOD
This tool of investment appraisal assist in evaluating the time required by the investment
proposal to recover its initial investment. However, payback period of project showing lesser
time is feasible to invest as compared to more time. According to the given case scenario,
payback period of available proposal is 4 years which indicates, defined time will be required by
the proposal to recover its initial investment. Considering the average payback period of the
proposals which is 2 to 2.5 years, generated outcome is relatively high (Project and Investment
Appraisal for Sustainable Value Creation, 2013). Thus, it is not feasible for the top level
management of Elton plc to invest in the proposal. Following are the benefits and drawbacks of
the payback period method:
Benefits of payback period:
Through the help of payback period, manager can easily assess the recovery period of
initial investment. On the basis of this, managerial level people can frame competent and
strategic policies for the future contingency of business enterprise (Baum and Crosby, 2014).
Drawbacks of payback period:
The main drawback of this method is that it only illustrates the information regarding the
time require by a project to regain its initial investment. In this regard, it does not undertake cash
10
Paraphrase This Document
Need a fresh take? Get an instant paraphrase of this document with our AI Paraphraser
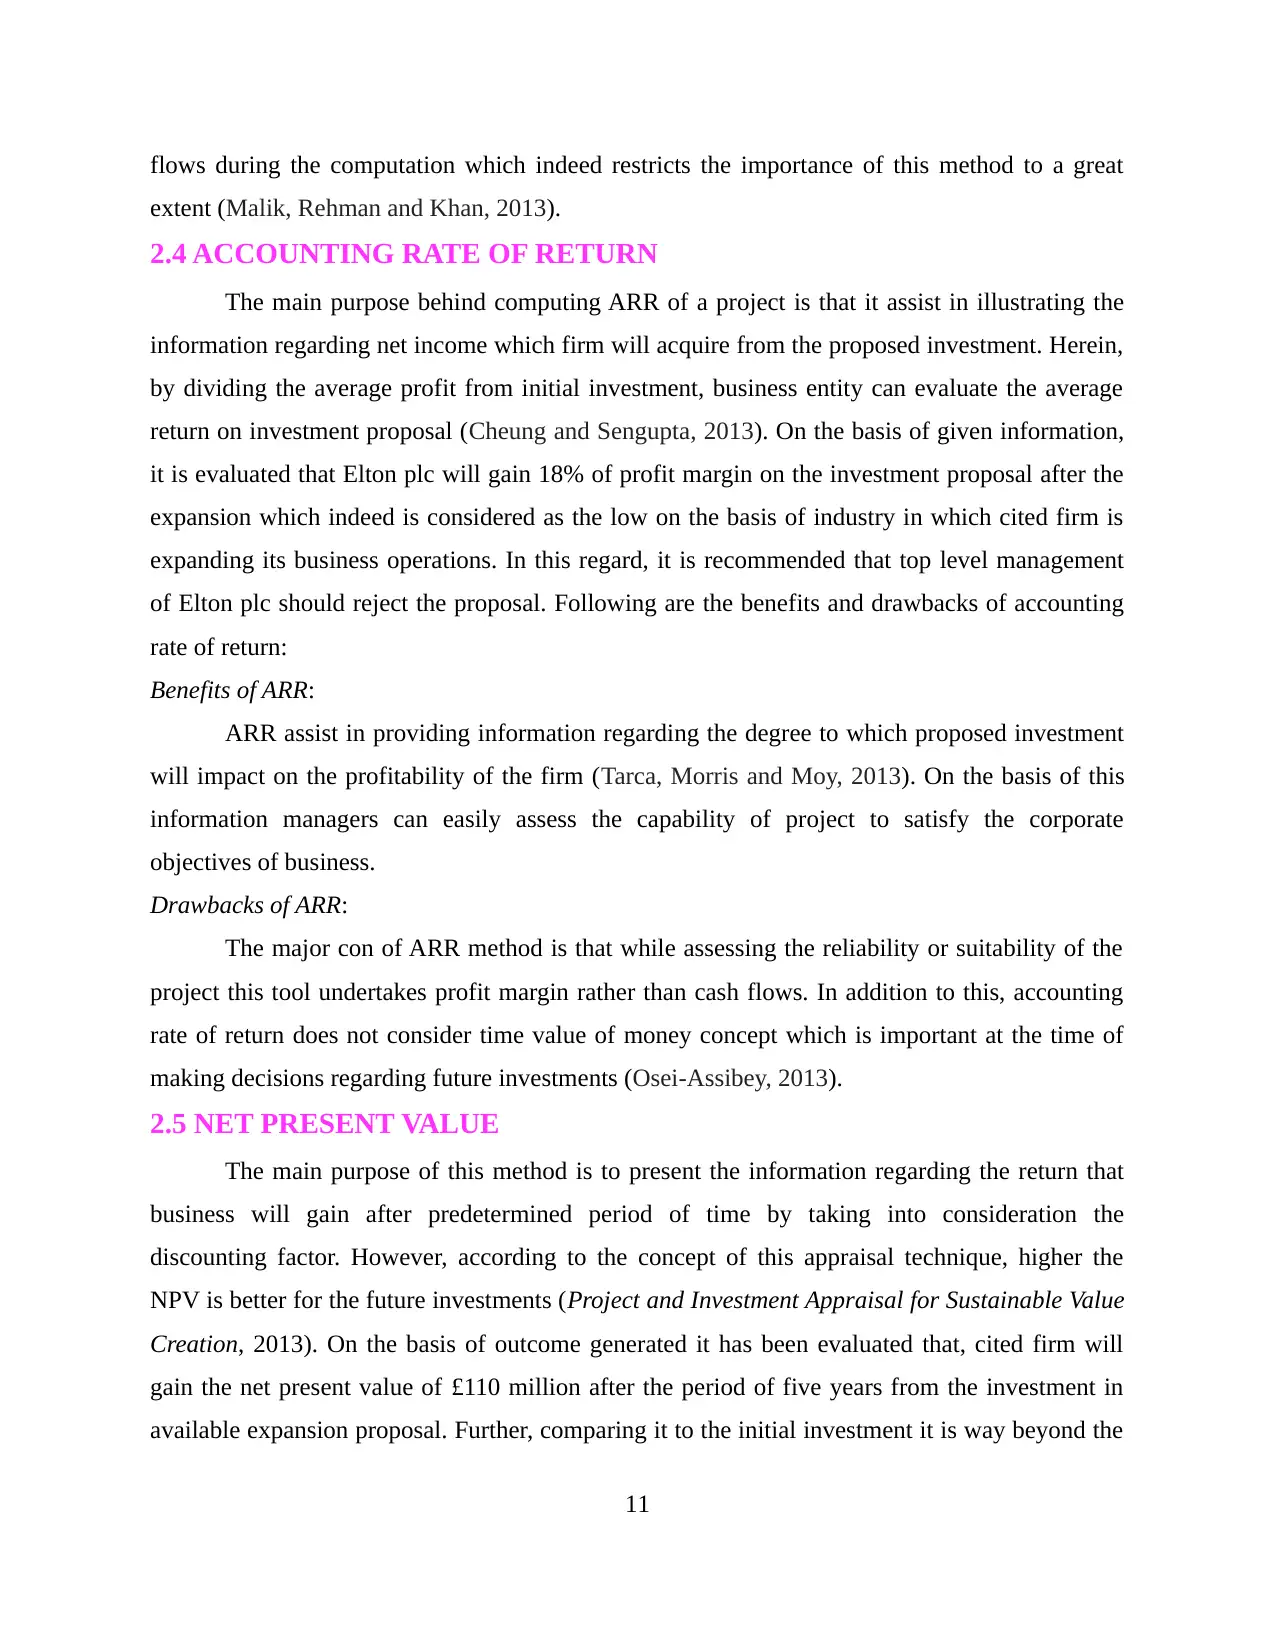
flows during the computation which indeed restricts the importance of this method to a great
extent (Malik, Rehman and Khan, 2013).
2.4 ACCOUNTING RATE OF RETURN
The main purpose behind computing ARR of a project is that it assist in illustrating the
information regarding net income which firm will acquire from the proposed investment. Herein,
by dividing the average profit from initial investment, business entity can evaluate the average
return on investment proposal (Cheung and Sengupta, 2013). On the basis of given information,
it is evaluated that Elton plc will gain 18% of profit margin on the investment proposal after the
expansion which indeed is considered as the low on the basis of industry in which cited firm is
expanding its business operations. In this regard, it is recommended that top level management
of Elton plc should reject the proposal. Following are the benefits and drawbacks of accounting
rate of return:
Benefits of ARR:
ARR assist in providing information regarding the degree to which proposed investment
will impact on the profitability of the firm (Tarca, Morris and Moy, 2013). On the basis of this
information managers can easily assess the capability of project to satisfy the corporate
objectives of business.
Drawbacks of ARR:
The major con of ARR method is that while assessing the reliability or suitability of the
project this tool undertakes profit margin rather than cash flows. In addition to this, accounting
rate of return does not consider time value of money concept which is important at the time of
making decisions regarding future investments (Osei-Assibey, 2013).
2.5 NET PRESENT VALUE
The main purpose of this method is to present the information regarding the return that
business will gain after predetermined period of time by taking into consideration the
discounting factor. However, according to the concept of this appraisal technique, higher the
NPV is better for the future investments (Project and Investment Appraisal for Sustainable Value
Creation, 2013). On the basis of outcome generated it has been evaluated that, cited firm will
gain the net present value of £110 million after the period of five years from the investment in
available expansion proposal. Further, comparing it to the initial investment it is way beyond the
11
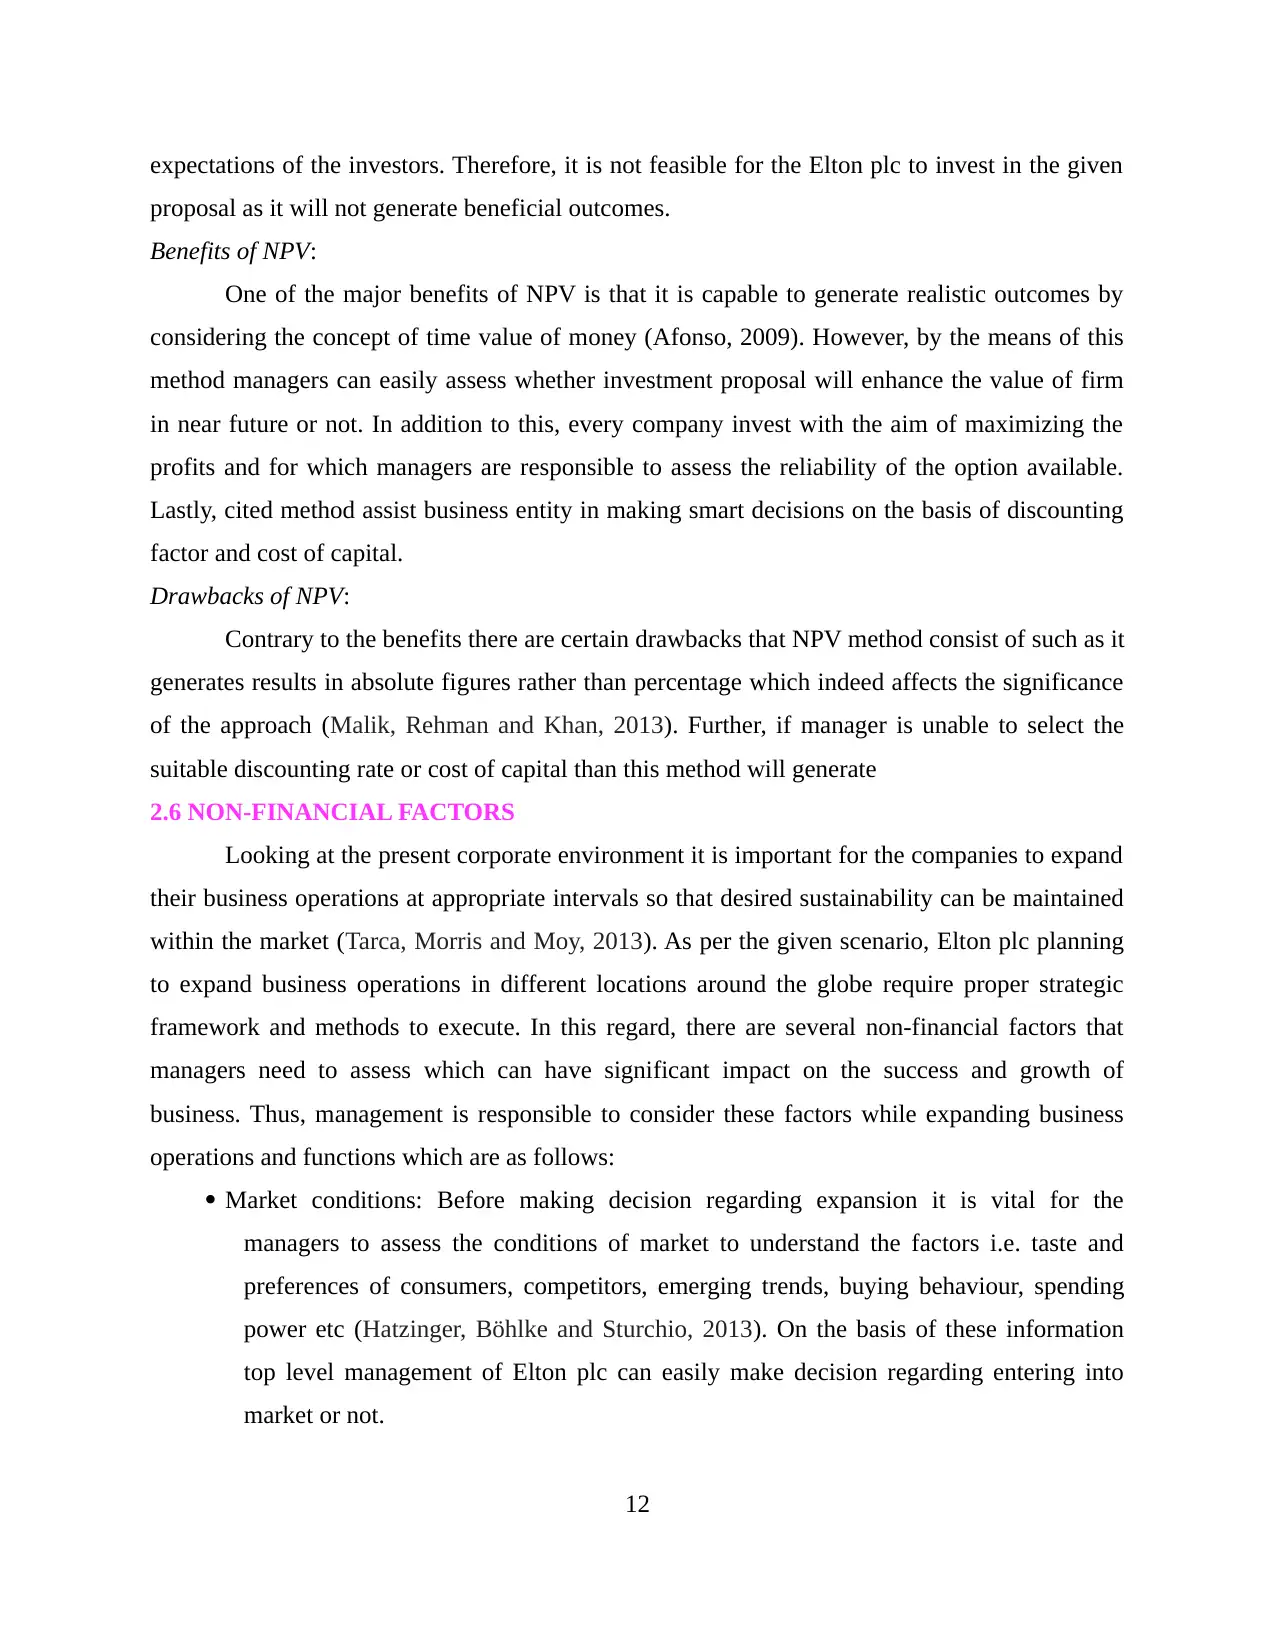
expectations of the investors. Therefore, it is not feasible for the Elton plc to invest in the given
proposal as it will not generate beneficial outcomes.
Benefits of NPV:
One of the major benefits of NPV is that it is capable to generate realistic outcomes by
considering the concept of time value of money (Afonso, 2009). However, by the means of this
method managers can easily assess whether investment proposal will enhance the value of firm
in near future or not. In addition to this, every company invest with the aim of maximizing the
profits and for which managers are responsible to assess the reliability of the option available.
Lastly, cited method assist business entity in making smart decisions on the basis of discounting
factor and cost of capital.
Drawbacks of NPV:
Contrary to the benefits there are certain drawbacks that NPV method consist of such as it
generates results in absolute figures rather than percentage which indeed affects the significance
of the approach (Malik, Rehman and Khan, 2013). Further, if manager is unable to select the
suitable discounting rate or cost of capital than this method will generate
2.6 NON-FINANCIAL FACTORS
Looking at the present corporate environment it is important for the companies to expand
their business operations at appropriate intervals so that desired sustainability can be maintained
within the market (Tarca, Morris and Moy, 2013). As per the given scenario, Elton plc planning
to expand business operations in different locations around the globe require proper strategic
framework and methods to execute. In this regard, there are several non-financial factors that
managers need to assess which can have significant impact on the success and growth of
business. Thus, management is responsible to consider these factors while expanding business
operations and functions which are as follows:
Market conditions: Before making decision regarding expansion it is vital for the
managers to assess the conditions of market to understand the factors i.e. taste and
preferences of consumers, competitors, emerging trends, buying behaviour, spending
power etc (Hatzinger, Böhlke and Sturchio, 2013). On the basis of these information
top level management of Elton plc can easily make decision regarding entering into
market or not.
12
⊘ This is a preview!⊘
Do you want full access?
Subscribe today to unlock all pages.
Trusted by 1+ million students worldwide
1 out of 16
Related Documents


Your All-in-One AI-Powered Toolkit for Academic Success.
+13062052269
info@desklib.com
Available 24*7 on WhatsApp / Email
![[object Object]](/_next/static/media/star-bottom.7253800d.svg)
Unlock your academic potential
Copyright © 2020–2026 A2Z Services. All Rights Reserved. Developed and managed by ZUCOL.