Comprehensive Financial Statement Analysis Report: Example Corporation
VerifiedAdded on 2023/01/20
|14
|3396
|74
Report
AI Summary
This report presents a financial statement analysis of Example Corporation, evaluating its financial performance through profitability and liquidity ratios. It begins with an executive summary and table of contents, followed by an introduction to financial statements, their components, and accounting equations. The report then delves into the essential components of financial statements, including the balance sheet, income statement, and cash flow statement, along with their usage and limitations. It discusses the three main accounting equations and two key accounting assumptions: going concern and materiality. The core of the report involves calculating and interpreting various financial ratios, such as current ratio, quick ratio, working capital ratio, and time interest earned ratio, to assess the company's financial health. The report also compares the calculated values with industry averages. Finally, the report offers recommendations based on the analysis and concludes with a summary of findings and a list of references.
Running head: FINANCIAL STATEMENT ANALYSIS
FINANCIAL STATEMENT ANALYSIS
Name of the Student
Name of the University
Author Note
FINANCIAL STATEMENT ANALYSIS
Name of the Student
Name of the University
Author Note
Paraphrase This Document
Need a fresh take? Get an instant paraphrase of this document with our AI Paraphraser
1
FINANCIAL STATEMENT ANALYSIS
Executive Summary
The report is prepared to demonstrate the evaluation of the financial performance of Example
Corporation. Assessment of the financial position is done by evaluating the profitability and
liquidity position of the company. The interpretation of the financial statements of Example
Corporation is done for evaluating the financial health of the business. Such interpretation is
done by computing various ratios such as profit margin, gross profit margin, time interest earned
ratio, return on shareholders’ investment, working capital, quick ratio and current ratio. In
addition to this, report also demonstrates the comparison of the values computed with that of
industry value to measure the performance of company with that of industry.
2
FINANCIAL STATEMENT ANALYSIS
Table of Contents
Introduction......................................................................................................................................3
Essential components of financial statements and their usage........................................................3
Three main accounting equations....................................................................................................5
Two assumptions used in Accounting.............................................................................................6
Summary of the finding from calculations:.....................................................................................7
Comparing with the industrial values:...........................................................................................10
Recommendations:........................................................................................................................11
Conclusion:....................................................................................................................................12
References list:...............................................................................................................................13
⊘ This is a preview!⊘
Do you want full access?
Subscribe today to unlock all pages.
Trusted by 1+ million students worldwide
3
FINANCIAL STATEMENT ANALYSIS
Introduction
A financial statement can be defined as an instrument, which is used to record the
financial performance of a company and provides information about the financial and operating
position of a company (insert citation). Various parties like external auditors, government
agencies and others audit these. The accuracy of these statements is of primary importance to all
their users as any misleading information can lead to bad decisions. They also suffer from other
inherent limitations like assumptions, unavailability of information at the time of preparation and
variations of interpretations among its users. It is universally accepted that great care should be
taken in the preparation of financial statements. Like every scientific approach, preparation of
financial statements is done using accounting equations which are the basis for the double entry
system. It also considers certain assumptions which are useful in the classification of items and
their treatment in the financial statements.
Essential components of financial statements and their usage
There are various types of financial statements prepared by a company in a given
financial year which record different aspects of a business. Some of the most prominent financial
statements are Balance Sheet, Income statement and statement of cash flow. The balance sheet
keeps a record of the assets, liabilities and the total equity of the company at a specific point in
time. It is used mostly to determine the net worth of the company which means how much is the
value of the company after meeting all of its liabilities with its current resources. Although it is
considered to be a very reliable source of information, it suffers from its own limitations. One of
them is the time factor. The balance sheet provides information only for a specific period of time.
Hence its usefulness diminishes with the passage of time and it is needed to be prepared again
for a different period. Another limitation is the accounting system used in the preparation of all
Paraphrase This Document
Need a fresh take? Get an instant paraphrase of this document with our AI Paraphraser
4
FINANCIAL STATEMENT ANALYSIS
the financial statements. Depreciation and amortisation and other items differ on the basis of the
accounting treatment and hence they vary on a company basis. Income statement records the
revenue generated and expenses incurred by the company in a given financial year. It is
considered to be more dynamic than the balance sheet and is used by the users to obtain more
current information. One of the limitations of income statement is that it fails to keep track of the
cash flow involved in the business. Due to the nature of accrual concept, income statement is the
most manipulated financial statement in order to present a positive picture of the financial
position of a company. It also suffers from other limitations like that of the balance sheet.
Statement of cash flow records only those activities which involve the inflow and outflow of
cash and its equivalents. Cash flow statement is highly useful in determining the liquidity of the
company. It is also helpful in the areas of budgeting, planning and controlling of the cash outlay
produced in a given period. Some of the limitations suffered by cash flow statement are due to its
nature. It does not show the profit earned by a company in a given year and also does not help in
the process of capital management. Like all financial statements, its usage in the real world is
limited by the time factor and it can only be used to interpret results. There is no chance to obtain
fully reliable results using this statement.
Operational decisions are those activities which are essential for the efficient functioning of the
business on a daily basis. Though these are in agreement with the long term strategies and aims
of the business, they are arrived at in a very short span of time.
Every financial statement consists of many smaller components which are highly useful in the
process of decision making. Balance sheet consists of stock lying at the end of the year which
can be useful in preparing the sales strategy for the current year. The amount can be used to sell
previous year’s stock first. Balance sheet also consists of debtors which is useful in preparing the
5
FINANCIAL STATEMENT ANALYSIS
credit policy for this year. The effectiveness of the measures adopted in the previous year are
also understood through this value. Income statement is the most useful tool when there is a
necessity for comparison with other companies of same industry. Some of the useful components
of Income statement are cost of goods sold, depreciation, gross profit, EBITDA and general and
administrative expenses incurred. The main role played by these statements is that they provide
information about the costs incurred by the company. It is helpful to the managers in identifying
areas where the costs are more and in coming up with measures to reduce such costs. The most
important financial statement with regard to operational decision making is the cash flow
statement. While income statement and balance sheet contain items which may not have been
received but have been accrued, the cash flow statement gives a clear indication about a
company’s ability to sustain operations. It indicates whether the company can meet any short
term expenses within a short notice or not. Any fall in the cash flow ratios is a warning to the
managers. It is an indication to them that there is something wrong with one of the aspects of the
business and it needs to be worked on to improve the operational position.
Three main accounting equations
Accounting equations is a tool, which explains the relationship between different
components of the financial statements. One of the most popular accounting equations is Assets
= Liabilities + Owner’s equity. This equation can be derived from the balance sheet and is the
basis for the double entry system of accounting. It is also known as the basic accounting
equation. It explains that the assets of a company are always equal to the liabilities of it as equity
is a liability to the business.
Another important equation is Net Revenue = Revenue – Expenses. This is important because it
just does not suggest the amount of revenue but also considers the expenses incurred to earn that
⊘ This is a preview!⊘
Do you want full access?
Subscribe today to unlock all pages.
Trusted by 1+ million students worldwide
6
FINANCIAL STATEMENT ANALYSIS
revenue. It also shows costs in proportion to the revenue and is helpful to the managers in setting
up financial goals for the future like increasing revenues and reducing costs.
The final equation is Net Margin = Net Profit/Sales. This equation is a better measure than gross
margin because it is arrived at after deducting all the expenses that directly or indirectly
contribute towards achieving the sales. Gross margin is calculated by deducting only the cost of
goods. This is not a good measure as it does not consider other expenses like salaries of
employees, office expenses and other indirect expenses. The higher the net margin, the better is
the financial performance of the company.
Two assumptions used in Accounting
Assumptions is defined as something that is assumed as true even without the existence
of a proper proof to support it. The most used assumption in the preparation of the financial
statements is the going concern assumption. As suggested by the name itself, this concept
assumes that a business intends to carry on conducting its business for the near future and has no
immediate plans of winding up. This assumption is the reason that instead of writing off all
expenses in a given year, some of them are amortized due to their nature of providing benefits
for more than a single financial year. Some of the items, which are accounted for using the going
concern concept, are deferred revenue, depreciation, and advertisement expenditure.
Materiality is another accounting assumption that plays an important role in determining how an
item is presented in the financial statements. The main aspect, which is considered while
determining the materiality of an item, is the nature of the item and the impact it would have on
the financial statements. This assumption is the reason for considering the purchase of a dustbin
as a petty expense rather than as an investment in an asset.
Paraphrase This Document
Need a fresh take? Get an instant paraphrase of this document with our AI Paraphraser
7
FINANCIAL STATEMENT ANALYSIS
Summary of the finding from calculations:
In this section of the report, the financial position of Example Corporation is evaluated by
the computation of different ratios along with presenting the working of the calculated values.
All the ratios have been calculated based on the financial year ending 2017. The computation of
all the ratios is presented graphically based on which the interpretations have been done.
Current ratio of Example Corporation is obtained by dividing current assets by current
liabilities. The value of current assets and current liabilities is recorded at $ 89000 and $ 61000
respectively. Current ratio obtained by the computation is 1.46 and working capital is same as
current ratio and the figure comes as same as 1.46. It is favorable for the organization to have
higher current ratio because it implies that the company is making enough money from
operations to settle its current liabilities. For understanding the concept of working capital, it
indicates that the current assets have more than the current liabilities and therefore firm is not
required to sell its assets to pay off its current liabilities (Kidwell et al., 2016). However, it is
required to compare the values with industry average to determine the accuracy of the financial
position.
Quick ratio is computed by subtracting inventories from current assets and dividing it by
current liabilities. Value of quick ratio of Example Corporation is 1 which indicates that the
company has as many quick assets as current liabilities and liabilities can be easily paid of suing
quick assets.
Working capital ratio is computed by dividing current assets by current liabilities and it is
considered desirable to have higher working capital ratio. Working capital ratio of Example
Corporation is 1.46 which is more than 1 and this has the implication that the current liabilities
8
FINANCIAL STATEMENT ANALYSIS
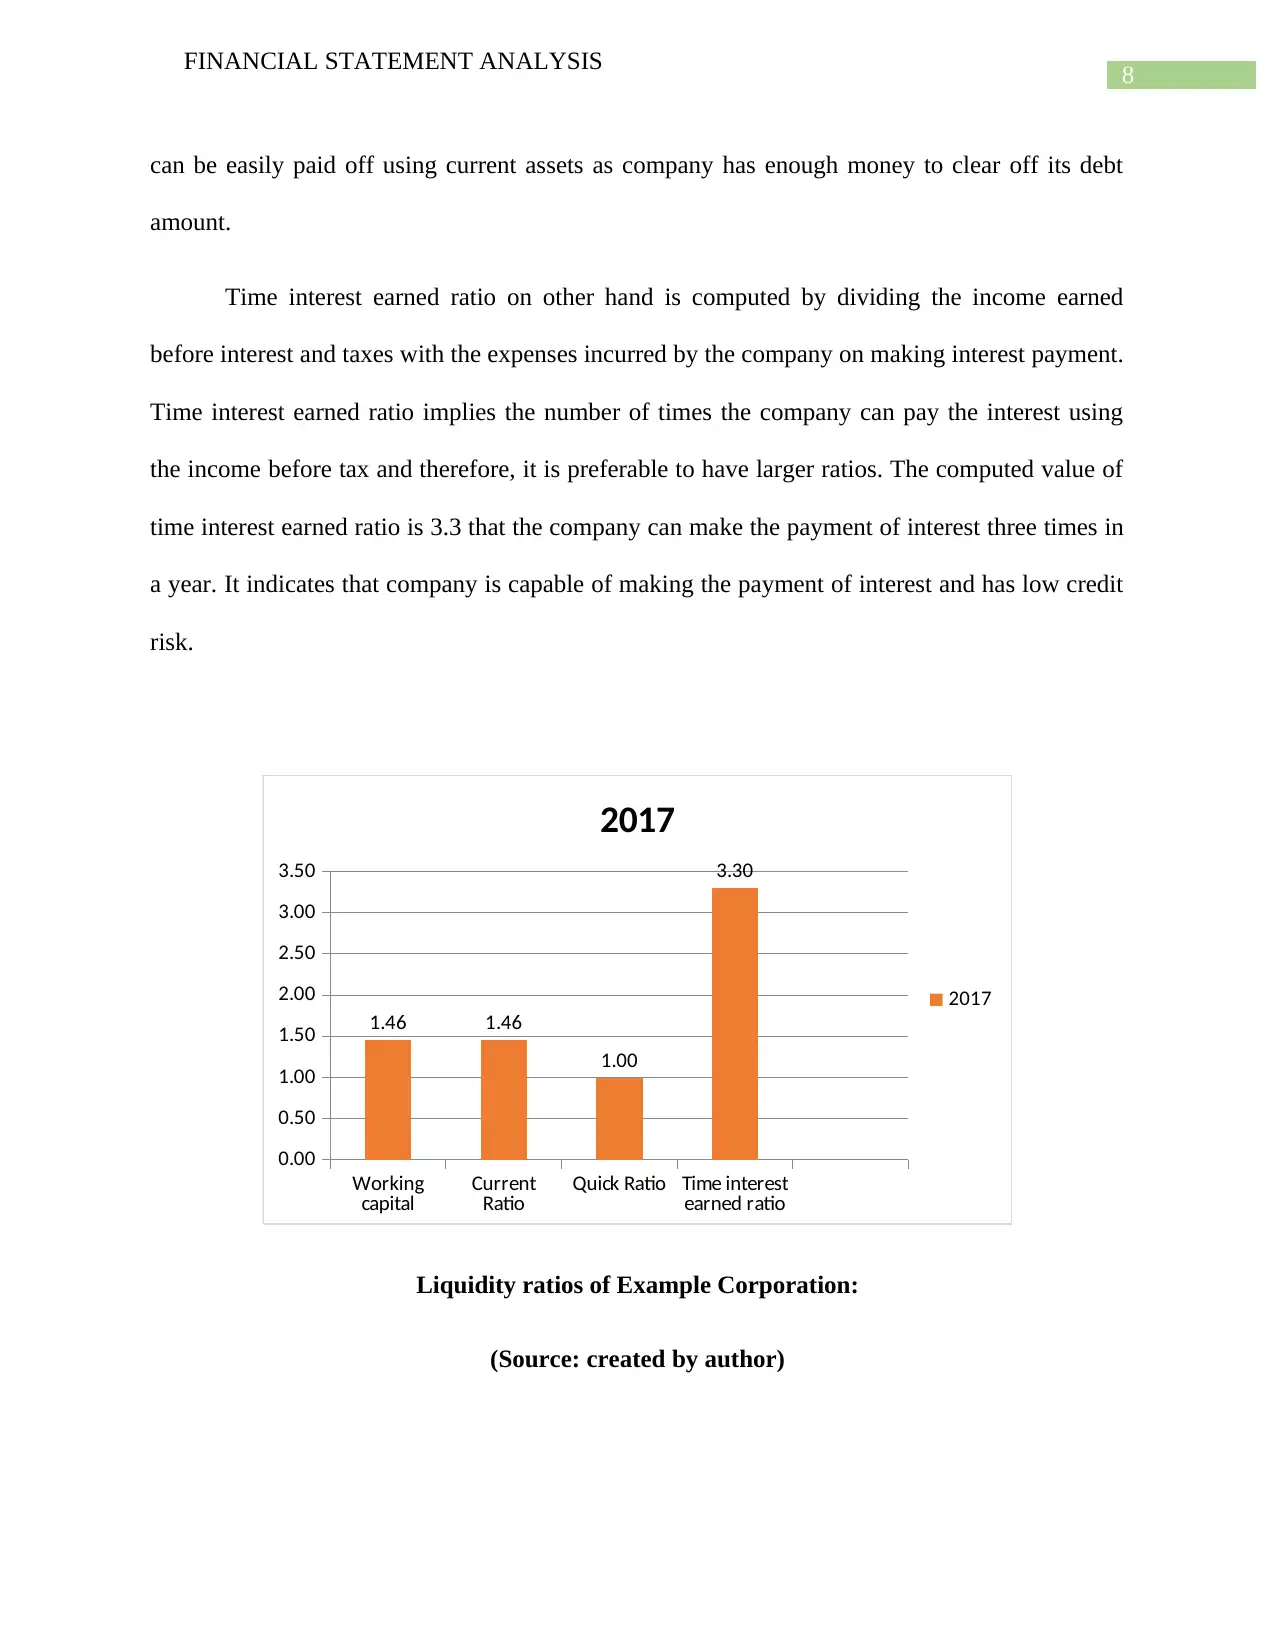
can be easily paid off using current assets as company has enough money to clear off its debt
amount.
Time interest earned ratio on other hand is computed by dividing the income earned
before interest and taxes with the expenses incurred by the company on making interest payment.
Time interest earned ratio implies the number of times the company can pay the interest using
the income before tax and therefore, it is preferable to have larger ratios. The computed value of
time interest earned ratio is 3.3 that the company can make the payment of interest three times in
a year. It indicates that company is capable of making the payment of interest and has low credit
risk.
Working
capital Current
Ratio Quick Ratio Time interest
earned ratio
0.00
0.50
1.00
1.50
2.00
2.50
3.00
3.50
1.46 1.46
1.00
3.30
2017
2017
Liquidity ratios of Example Corporation:
(Source: created by author)
FINANCIAL STATEMENT ANALYSIS
can be easily paid off using current assets as company has enough money to clear off its debt
amount.
Time interest earned ratio on other hand is computed by dividing the income earned
before interest and taxes with the expenses incurred by the company on making interest payment.
Time interest earned ratio implies the number of times the company can pay the interest using
the income before tax and therefore, it is preferable to have larger ratios. The computed value of
time interest earned ratio is 3.3 that the company can make the payment of interest three times in
a year. It indicates that company is capable of making the payment of interest and has low credit
risk.
Working
capital Current
Ratio Quick Ratio Time interest
earned ratio
0.00
0.50
1.00
1.50
2.00
2.50
3.00
3.50
1.46 1.46
1.00
3.30
2017
2017
Liquidity ratios of Example Corporation:
(Source: created by author)
⊘ This is a preview!⊘
Do you want full access?
Subscribe today to unlock all pages.
Trusted by 1+ million students worldwide
9
FINANCIAL STATEMENT ANALYSIS
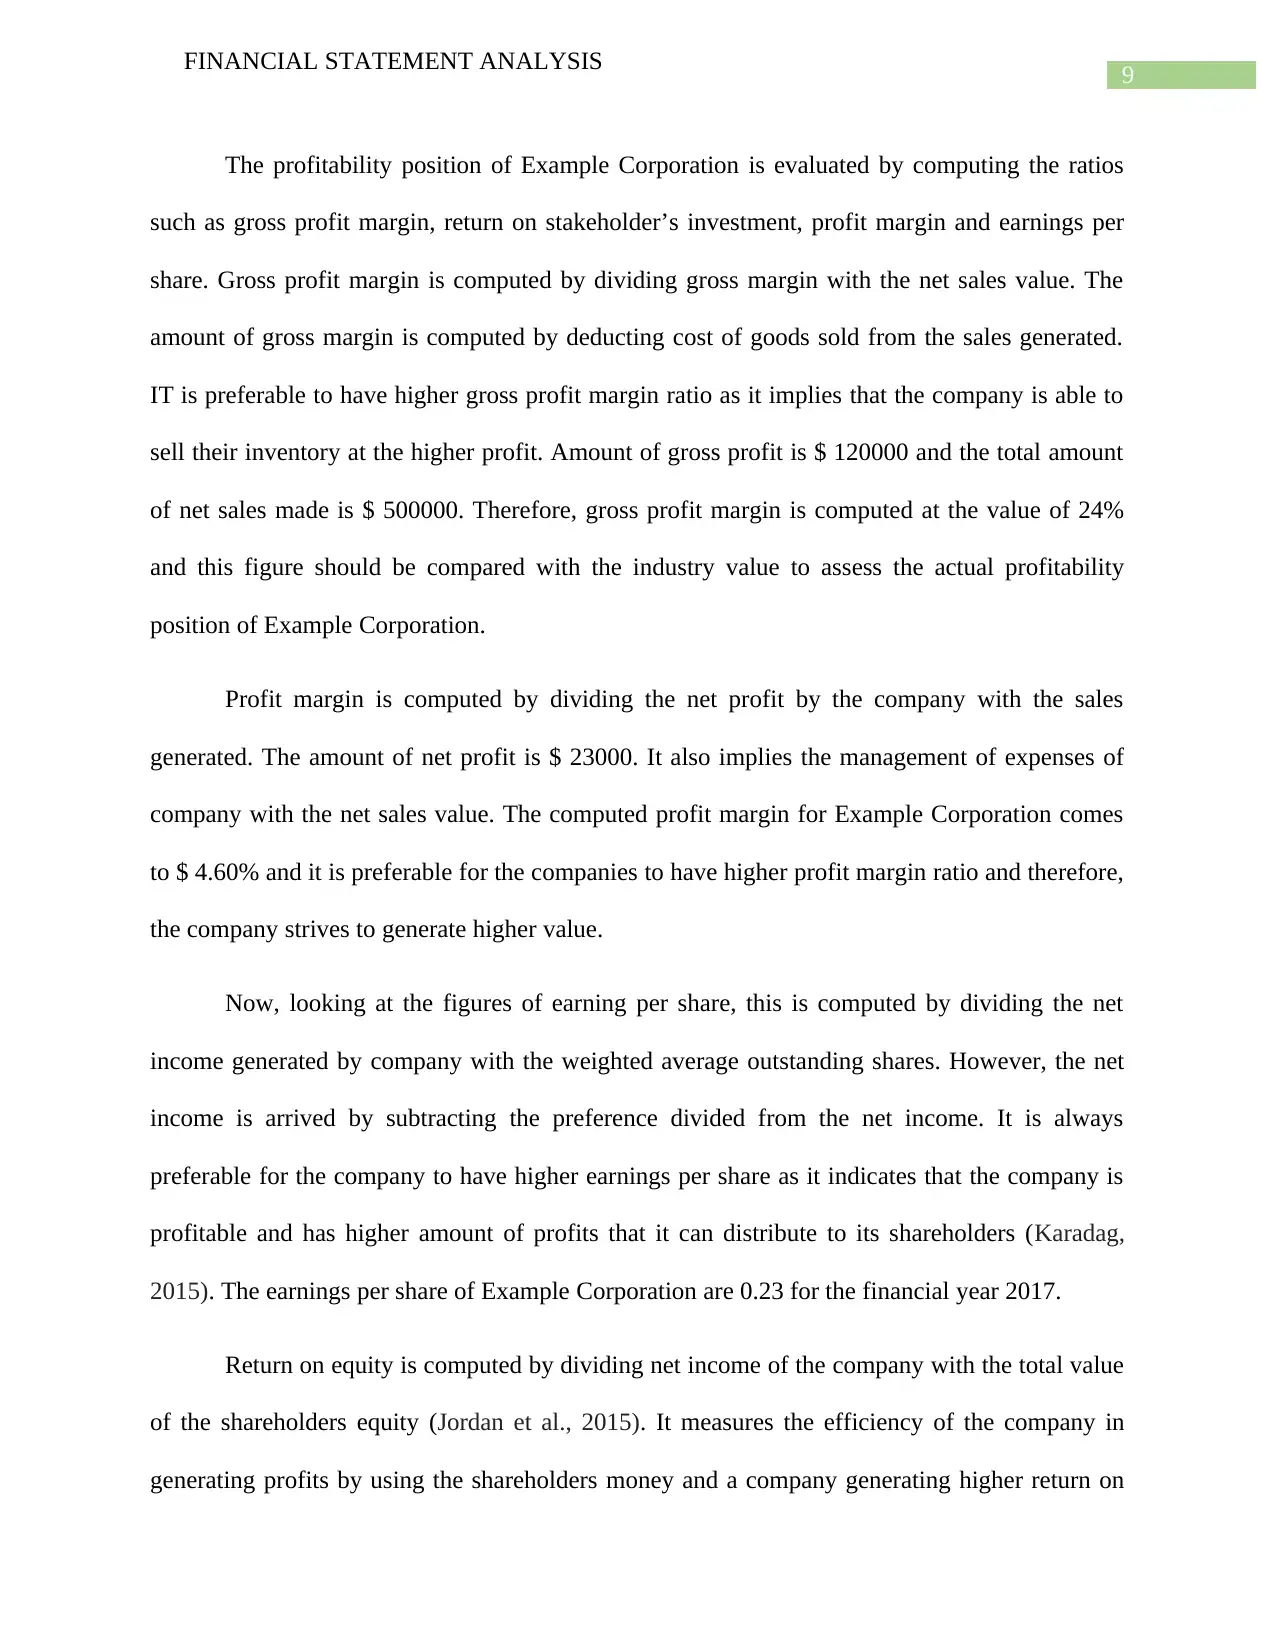
The profitability position of Example Corporation is evaluated by computing the ratios
such as gross profit margin, return on stakeholder’s investment, profit margin and earnings per
share. Gross profit margin is computed by dividing gross margin with the net sales value. The
amount of gross margin is computed by deducting cost of goods sold from the sales generated.
IT is preferable to have higher gross profit margin ratio as it implies that the company is able to
sell their inventory at the higher profit. Amount of gross profit is $ 120000 and the total amount
of net sales made is $ 500000. Therefore, gross profit margin is computed at the value of 24%
and this figure should be compared with the industry value to assess the actual profitability
position of Example Corporation.
Profit margin is computed by dividing the net profit by the company with the sales
generated. The amount of net profit is $ 23000. It also implies the management of expenses of
company with the net sales value. The computed profit margin for Example Corporation comes
to $ 4.60% and it is preferable for the companies to have higher profit margin ratio and therefore,
the company strives to generate higher value.
Now, looking at the figures of earning per share, this is computed by dividing the net
income generated by company with the weighted average outstanding shares. However, the net
income is arrived by subtracting the preference divided from the net income. It is always
preferable for the company to have higher earnings per share as it indicates that the company is
profitable and has higher amount of profits that it can distribute to its shareholders (Karadag,
2015). The earnings per share of Example Corporation are 0.23 for the financial year 2017.
Return on equity is computed by dividing net income of the company with the total value
of the shareholders equity (Jordan et al., 2015). It measures the efficiency of the company in
generating profits by using the shareholders money and a company generating higher return on
FINANCIAL STATEMENT ANALYSIS
The profitability position of Example Corporation is evaluated by computing the ratios
such as gross profit margin, return on stakeholder’s investment, profit margin and earnings per
share. Gross profit margin is computed by dividing gross margin with the net sales value. The
amount of gross margin is computed by deducting cost of goods sold from the sales generated.
IT is preferable to have higher gross profit margin ratio as it implies that the company is able to
sell their inventory at the higher profit. Amount of gross profit is $ 120000 and the total amount
of net sales made is $ 500000. Therefore, gross profit margin is computed at the value of 24%
and this figure should be compared with the industry value to assess the actual profitability
position of Example Corporation.
Profit margin is computed by dividing the net profit by the company with the sales
generated. The amount of net profit is $ 23000. It also implies the management of expenses of
company with the net sales value. The computed profit margin for Example Corporation comes
to $ 4.60% and it is preferable for the companies to have higher profit margin ratio and therefore,
the company strives to generate higher value.
Now, looking at the figures of earning per share, this is computed by dividing the net
income generated by company with the weighted average outstanding shares. However, the net
income is arrived by subtracting the preference divided from the net income. It is always
preferable for the company to have higher earnings per share as it indicates that the company is
profitable and has higher amount of profits that it can distribute to its shareholders (Karadag,
2015). The earnings per share of Example Corporation are 0.23 for the financial year 2017.
Return on equity is computed by dividing net income of the company with the total value
of the shareholders equity (Jordan et al., 2015). It measures the efficiency of the company in
generating profits by using the shareholders money and a company generating higher return on
Paraphrase This Document
Need a fresh take? Get an instant paraphrase of this document with our AI Paraphraser
10
FINANCIAL STATEMENT ANALYSIS
equity is viewed positively by the company. Return on equity for the example corporation is
7.96% and this percentage needs to be compared with the industry average for determining the
performance of the company.
Gross Profit
Margin Operating
Profit Margin Earning per
share Return on
Equity
0.00%
5.00%
10.00%
15.00%
20.00%
25.00%
30.00%
24.00%
4.60%
23.00%
7.96%
2017
2017
Profitability ratio of Example Corporation:
(Source: created by author)
Comparing with the industrial values:
This section demonstrates the comparison of the computed values of ratios with the
industry values. The gross profit margin of Example Corporation is more than the industry
values of 24% with the later being at value of 22%. This implies that the company is selling the
inventories at higher profits compared to industry. Profit margin of industry is at 3.7% while the
profit margin of company is more than the industry at the value of 4.6% which indicates that the
company is generating more revenue than generated by industry.
11
FINANCIAL STATEMENT ANALYSIS
Now, looking at the value of earning per share, the industry value is $ 0.24 compared to
earnings per share for Example corporation at $ 0.23. This indicates that the profitability aspect
of the company is less than the industry. Time interest earned ratio of the company is 3.3 which
are more that the industry average of 3. Higher value of time interest earned ratio of company
compared to industry value, implies that the number of time company is making payment of
interest frequently than the industry. Higher ratio is considered favorable as it is viewed by the
creditors that the company is less risky and they can lend to the company (Brigham et al., 2016).
Return on the shareholder investment generated by industry is 6% while that generated
by the company is 7.96%. It is always consider desirable for the company to have higher return
on equity as it is considered profitable for the investors. Therefore, the performance o f company
in terms of generating return on the investment made by the shareholders is better than the return
generated by the industry.
Recommendations:
It is observed that the earnings per share of the company is lower than the industry values
It is therefore recommended to the company to increase its earnings per share. Example
Corporation can increase its earnings per share by repurchasing their own stocks.
It is also observed from the financial figures of the company that the total amount of
expenses is increasing with higher figures reported in year 2017 as against 2016.
Example Corporation is recommended to reduce the overall expenses so as to increase
the total amount of net profits generated by the company.
⊘ This is a preview!⊘
Do you want full access?
Subscribe today to unlock all pages.
Trusted by 1+ million students worldwide
1 out of 14
Related Documents


Your All-in-One AI-Powered Toolkit for Academic Success.
+13062052269
info@desklib.com
Available 24*7 on WhatsApp / Email
![[object Object]](/_next/static/media/star-bottom.7253800d.svg)
Unlock your academic potential
Copyright © 2020–2026 A2Z Services. All Rights Reserved. Developed and managed by ZUCOL.