Financial Analysis of Farsons and Heineken: FAME Report Analysis
VerifiedAdded on 2023/01/18
|24
|4801
|37
Report
AI Summary
This report provides a comprehensive financial analysis of Farsons and Heineken, two companies involved in the production, sales, and distribution of branded beverages. The analysis employs various financial tools, including profitability, leverage, liquidity, and efficiency ratios, to evaluate their performance. The report examines operating profit margins, net profit margins, return on assets, and return on equity to assess profitability. It also investigates debt-equity ratios and debt-asset ratios for leverage. Liquidity is evaluated through current and quick ratios, while efficiency is assessed using receivable turnover, payable turnover, asset turnover, and inventory days ratios. Additionally, shareholder ratios are analyzed. The report includes horizontal analysis, comparing financial data over multiple years, and discusses working capital and cash flow. The analysis reveals that Farsons generally demonstrates stronger financial performance compared to Heineken across several key metrics. The report concludes with a comparative overview and insights into the financial health and operational efficiency of both companies.

Financial Analysis
Management & Enterprise -
FAME
Management & Enterprise -
FAME
Paraphrase This Document
Need a fresh take? Get an instant paraphrase of this document with our AI Paraphraser
Table of Contents
INTRODUCTION...........................................................................................................................3
MAIN BODY...................................................................................................................................3
Evaluation of financial performance of Farsons and Heineken..................................................3
Evaluation of horizontal analysis of Farsons and Heinikein.......................................................7
Evaluation of vertical analysis of Farsons and Heinikein..........................................................8
Evaluation of working capital of Farsons and Heineken............................................................8
Evaluation of cash flows of Farsons and Heineken....................................................................9
CONCLUSION..............................................................................................................................10
REFERENCES..............................................................................................................................11
APPENDIX....................................................................................................................................12
INTRODUCTION
Financial analysis management can be defined as a process of evaluation of business
reports, budgets, business project and various transactions related to finance to analyze the
company's performance and efficiency. It is helpful for the business to review the historical trend
and frame future policies for the business. It is helpful to investor to analyze the profitability to
invest in the firm. Financial analysis of the enterprises includes various tools like ratio analysis,
profit and loss statement, balance sheets, working capital and cash flow statements. All these
financial tools are helpful in analyzing the business of the company on financial grounds. Here
we are going to analyze the Heineken and Farsons. These are the organisations that are busy in
production, sales as well as distribution of branded beverages. It includes import, retailing and
wholesale of wines as well as spirits.
MAIN BODY
Evaluation of financial performance of Farsons and Heineken.
Profitability ratio
Operating profit margins:- It identifies the profit made by the organisation after paying
all of its variable costs like payoff, rent, raw material before payment of interest and tax. This
type of ratio keeps the cost in control which results in the efficiency of firm. It can be calculated
by dividing the firm's operating profit by the net sales. Company's operating profit shows that
how efficient it is working and what is return on its operational cost (Zou and Li, 2018). Higher
the variability of operating cost higher will be the risk associated with the business. The analysis
of operating profit margin of Farsons and Heineken shows that the operating profit margin ratio
of Farsons is showing increasing trends which shows it can efficiently meet the operational
efficiency while Heineken shows the declining trend in its operating profit margin ratio which is
not favorable for the company. Hence, Farsons is more efficient than Heinken in attaining
operational efficiency.
Net profit margin:- It is the total net income and profitability arrived from the total
revenue. It can be calculated by division of net profit by revenue. It is expressed in terms of
percentage. It is equal to net income shown in income statements. It shows the overall
profitability of the company. Higher net profit margin will show higher convertibility of sales
into net profit and vice versa. The analysis of net profit margin shows that the net profit of
Heineken is declining as company is not able to convert its sales into net profit. While net profit
⊘ This is a preview!⊘
Do you want full access?
Subscribe today to unlock all pages.
Trusted by 1+ million students worldwide
ratio of Farsons is increasing over the last 4 years which shows that company is performing well
after paying all the expenses and cost. Here Farsons is able to effectively control its costs and
and able to provide goods and services at significantly higher price than its cost. Company is
generating good profits.
Return on assets :-It shows the profitability of company on the basis of total assets of
the company. This ratio gives an idea about effectiveness of Assets of the company in generating
profitability for the company (Al-Hares and Saleem, 2017). The positive value shows the high
amount of profit generated from the usage of company's assets. The ratio of ROA in case of both
the companies is positive. The Farsons is 7 and Heineken is 4. So it may be interpreted that
Farsons is making more efficient use of assets as compared to Heineken. Here Farsons is more
efficient to gain profit from the available resources.
Return on Equity :-It is measurement of how company is generating profits from the
investment made by share holders. The above analysis shows that Return on equity of Heineken
is declining whereas Farsons is increasing from 8 to 12 over 4 years. Here it is interpreted that
Farsons has made more profits from the investment made by equity shareholders. While
Heineken is making less profits out of the investment made by the shareholders in the company.
Leverage ratio
Debt equity ratio :- It is company, s total liability divided by shareholders fund. Higher
the debt equity ratio shows the higher creditor financing as compared to investors financing.
High Debt equity ratio shows the association of high risk with the company, it means company is
aggressive in part of employing external debt in its capital (Arunachalam, Chen and Davey,
2016). The analysis pd D/E ratio of both the companies shows the higher trend which interprets
that it is not favourable for the company. It shows that company is not able to make sufficient
cash to meet its debt obligation.
Debt Assets Ratio :-This ratio is indicator of company's financial leverage. It shows the
total liabilities that firm has against its Assets. It is total of assets owned on the credit basis by
the company. Higher the ratio higher will be degree of leverage and higher will be risk
associated with the company. If ratio is equivalent to 1 then company has equal amount of assets
and liabilities hence company will be highly leveraged. While when ratio is higher than 1 than
liabilities will be more than assets owned by the company. The analysis shows that ratio of both
the companies is less than 1 which is favorable for both the companies. It states that assets of
Paraphrase This Document
Need a fresh take? Get an instant paraphrase of this document with our AI Paraphraser
company are not financed by debts. Hence, both the companies has fewer liabilities as compared
to its assets.
Liquidity ratio
Current ratio :- It identifies company's obligation to pay its short-term debts or
debts from within a year. It helps the company how to increase its current assets and pay off its
debts and other payable. It involves the comparison of firm's total possession with the existing
liabilities. The current ratio can also be referred as working capital ratio and helpful to company
in understanding organisation's capability to cover its short-term liabilities. The current ratio of
Heineken is increasing over the last four years which shows that company is efficiently making
use of its current assets and able to pay off its short term debts. While on the other hand Farsons
is able to attain ideal current ratio of 2:1.It aslo indicates Farsons ability to pay off short term
debts and company is also making efficient use of its resources (Nataraja, Chilale and Ganesh,
2018). It can be interpreted that Farsons has better liquidity position as compared to Heineken.
Quick ratio :- It is referred as an indicator of short-term liquid orientation of company .It
measures the company's short term obligation to pay off its debts with the available liquid assets.
The analysis shows that the quick ratio of both the company is shown increasing which is
favorable for both the companies. Both companies have better liquidity position within the
industry. These both have capacity to pay their current liabilities without additional finance and
selling assets or inventories of the company.
Efficiency ratio
Receivable turnover ratio :- It shows the company's efficiency in collection of money
and receivables which are owned by its clients. It shows how company manages and collects the
debts from the clients whom company has provided credit. And also how quickly the debts are
collected from them. It is also called account receivable turnover ratio. It is calculated by
dividing net credit sales by average account receivables. Lower receivable turnover ratio is not
favorable as it shows the poor collection process. While higher ratio indicates favorable
collection process for the company. The receivable turnover ratio of Farsons is higher than
Heineken. Which shows Farsons is more efficient in collection of its receivables.
Payable turnover ratio :-It is helpful in measuring the rates at which company payoffs
to its suppliers. It shows number of times company pay offs to settle its accounts payable. It
shows how many times a company pays to settle its debts over a accounting period. High ratio
indicates that company is making payment on time and not taking too long in making payments.
Here ratio of both companies Farsons and Heineken are stable and hence both company is paying
its creditors on time and not taking too long for payments.
Assets turnover ratio :- It measures the total value of frm's sales relative to the
company's assets. It shows investor how companies are using their assets to generate sales for the
company. It is used to analyse the use of assets and identification of weakness of the firm. Here it
can be interpreted that both companies are making better use of its assets as the ratio of both is
rising. This indicates that companies are more efficient in using its assets. The ratio is positive
indicator for the company's efficiency.
Inventory days ratio :- It helps in measuring of the average number of days a firm holds
the stock earlier to selling to the potential consumers in the market. It calculates the number of
days the fund is locked with the inventory. The high ratio shows the inventory is fast moving
while low ratio indicates inventory is slow moving (Al-Hares and Saleem, 2017). The inventory
days ratio of both the companies is high which indicates that stock of both the firms is fast
moving. And companies does not hold inventory for long time or does not hold excess inventory.
Shareholders ratio
Shareholders equity ratio :- It shows the ratio of company's assets funded by the equity
shareholders of the company. It is calculated by dividing total shareholders equity by total assets
of the company. It is expressed in percentage form. Lower ratio indicates more debts are to be
paid for the company's assets. The interpretation of both the companies evaluates that the
Shareholder's equity ratio for both the companies is stable over the 4 years so. Company is
having better financial stability in the industry. This states that company is stable for the long run
and is less dependent on external debts. This indicates overall favorable for both the companies
Farsons and Heineken.
The above interpretation of various accounting ratios of Farsons and Heineken shows that
Farsons is efficient as compared to Heineken. The profitability ratio indicates the favorable
outcomes for Farsons as compared to Heineken. The Farsons is having increasing trends in all
profitability ratio which is favorable for the company. Favorable ratio shows the efficiency of the
company in using the assets and other resources.
The next ratio is liquidity ratio. They indicate the debtors' ability to pay off the current obligation
without raising the capital. The above analysis indicates that both the companies have better
⊘ This is a preview!⊘
Do you want full access?
Subscribe today to unlock all pages.
Trusted by 1+ million students worldwide
liquidity position to pay off its debts. The leverage position of both the companies is considered
to be favorable. The efficiency ratio indicates the efficiency in using internal assets and
liabilities. The interpretation shows the stable efficiency ratio for both the companies. Which is
favorable for the companies. Here companies had to work more efficiently to increase its
efficiency ratio. The last is shareholders ratio refers to the return received from the investment
made by shareholder. Here , in this case shareholders ratio of both the companies is stable over
the 4 years. Which is a favorable part for both the companies.
Evaluation of horizontal analysis of Farsons and Heinikein
Farsons
The horizontal analysis of Farsons shows that taking 2015 as the base year the revenue
for the company has increased 8.62%in year 2016 which declined in year 2017 at 2.42% and it
again increased in year 2018 at 7.79%.operating profit declined in year 2017 and again got raise
by 14.08% in year 2018 (Chen, Song and Xu, 2015). Profit before tax also shows same trends in
the following years. The overall profit of the company has shown declined trends in year 2018
The balance sheet for the company shows that assets of the company has been declined
by 11% in year 2018 as compared to previous year. But total liabilities for Fearsons has also
been increased over the years which is unfavorable on the part of company.
Heineken
The revenue of the company has shown incresed trend in year 2017 but it again got
declined in year 2018.profit for the company has again shown the same trend which got declined
by 3% in year 2018.
The balance sheet of company shows that total assets of the company has shown
increasing trend over the year. Which is favorable for the company. And total liabilities for the
company had a great decline of 100% in year 2018 as compared to base year 2105.
Evaluation of vertical analysis of Farsons and Heinikein
Farsons
Operational profit has increasing trend over the 4 years. Overall profit for the company
has also been increased over the period (Maitra and Mani, 2017). The balance sheet of the
company shows stable growth of company in terms of assets and liabilities over the years.
Heineken
Paraphrase This Document
Need a fresh take? Get an instant paraphrase of this document with our AI Paraphraser
The overall trend of profit for the company has shown declining trend over the years.
Balance sheet reveals that liabilities and assets of the company has been stable and has not been
fluctuations over the years.
Evaluation of working capital of Farsons and Heineken.
Working capital
It is a difference between current liabilities and Current assets of an organiastion. These current
assets include account receivables, cash, debtors while current assets includes accounts payable,
creditors (Page and Ayres, 2018). It is capital employed for day to day operations of the
business. It is also called as net working capital of the firm. There are different types of working
capital which are as follows temporary, permanent, gross and net working capital. The working
capital is company's ability to meet out its current obligations. For example:- the debt due from
debtors within 1 year. It is result of various activities like payment to creditors, credit sales and
purchase, etc. It is calculated to know the sufficiency of current assets against current liabilities.
Farsons
It is very important for the company to analyze the working capital needs. It will be
helpful in making major decisions related to the company. Farsons must evaluate the working
capital before making any decisions. It shows the timeline for due payment of liabilities for the
company. The analysis will be helpful to the company to get the idea about requirement of extra
capital for long term objectives of the company (Maitra and Mani, 2017). It is helpful in
determining rather Farsons will need to employ more capital for its long term objectives. The
analysis of working capital before making decisions will be helpful in maximizing the efficiency
of the company's operations. It would be helpful in efficient working of operations and
profitability of the company. It also maintains accounts payable and debts of the company.
Heineken
Heineken to analyze the working capital can use age accounts payable report. It divides
the accounts payable into the bracket of 30 days. This is helpful for the company in analyzing the
need of cash and cash equivalents for short term needs. It will be also analyze the priority to pay
accounts payable (Danthurebandara and et.al., 2015). It gives a firm view about when a firm
have to make payment for its outstanding obligations. Heineken can analyse the debtors through
the working capital analysis. The analysis will be done on the basis of short term age reports and
time buckets. The results of the analyses have to revised for the clients who have payment of
debts later to the end date. So it bwill provide more appropriate outcome of cash flows. The
efficient analysis of the working capital will be helpful for the company to maintain a balance
between current liabilities and current assets of the company. Thus, effective working capital is
helpful in maintaining various ratios such as inventory turnover ratio, capital ratio. These ratios
are helpful in assisting the company about the maintenance of areas for attaining maximum
liquidity and profitability. These will be helpful to company to achieve financial obligation but
also will be helpful for success growth of the company.
Evaluation of cash flows of Farsons and Heineken.
Farsons
From the cash flow analysis of Farsons it can be evaluated that cash flow margin ratio of
the firm has been increased from year 2017 to 2018. The cash flow margin ratio in year 2017 is
0.17 and 0.24 in year 2018. It indicates that company's ability to repay the amount has been
increased over the years. It shows positive growth of company over the year.
The cash flow coverage ratio of company has been improved from year 2017 to year
2018. The coverage ratio in year 2017 was 0.25 while it was 0.34 in year 2018. This shows
improved ability of the company to meet its liabilities.
The current liabilities coverage ratio of the company has been increased over the year as
compared to previous year. This ration in year 2017 was 0.63 and in year 208 it was improved to
0.70.Thus, it can be indicated that ability to pay current liabilities by Farson has been increased
over the year.
The evaluation of Farsons cash flows shows that company has improved its cash flow in year
2018 as compared to year 2017. hence, it is favorably on the part of the company.
Heineken
From the cash flow analysis of Heineken it can be evaluated that cash flow margin ratio
of the company has been declined from year 2017 to 2018 (Acar and Arslan, 2017). The ratio in
year 2017 is 0.22 while in year 2018 it was 0.20. It shows that company's capability is reduced
for converting the sales into cash flow.
Cash flow coverage ratio of the firm has been increased from year 2017 to 2018. It was
0.18 in 2017 while it was 0.20 in year 2018.
⊘ This is a preview!⊘
Do you want full access?
Subscribe today to unlock all pages.
Trusted by 1+ million students worldwide
Current liability coverage ratio of the Heineken has increased in year 2018 when
compared to year 2018. The ratio in 2017 was 0.47 while in 2018 it was 0.53. This shows that
company has sufficient amount of cash to pay the outstanding liabilities of the company.
Thus, it may be concluded from the above evaluation of Heineken has also improved in
its cash flow except cash flow margin ratio. Company should take measures to increase margin
ratio.
CONCLUSION
From the above report it can be concluded that Farsons and Heineken has strong financial
growth over the years. Both the companies has shown a great pace of growth from year 2015 till
2018. Now, companies has great liquidity to pay off their liabilities. Comparatively, Farsons has
a better financial ratios than that of Heineken. Thus, the companies are efficient in achieving
their financial growth.
Paraphrase This Document
Need a fresh take? Get an instant paraphrase of this document with our AI Paraphraser
REFERENCES
Books and Journals
Acar, M. S. and Arslan, O., 2017. Exergo-economic Evaluation of a new drying system Boosted
by Ranque-Hilsch vortex tube. Applied Thermal Engineering. 124. pp.1-16.
Al-Hares, O. M. and Saleem, K., 2017. Islamic banks financial performance and implications of
Basel III standards in the GCC: An Empirical Analysis. Review of Economics &
Finance. 7 pp.80-97.
Arunachalam, M., Chen, C. and Davey, H., 2016. Financial sustainability of local authorities in
New Zealand: Performance analysis and coping strategies. New Zealand Journal of
Applied Business Research. 14(1). p.19.
Chen, J., Song, M. and Xu, L., 2015. Evaluation of environmental efficiency in China using data
envelopment analysis. Ecological indicators. 52. pp.577-583.
Danthurebandara, M and et.al., 2015. Valorization of thermal treatment residues in enhanced
landfill mining: environmental and economic evaluation. Journal of Cleaner
Production. 99. pp.275-285.
Maitra, P. and Mani, S., 2017. Learning and earning: Evidence from a randomized evaluation in
India. Labour Economics. 45. pp.116-130.
Nataraja, N. S., Chilale, N. R. and Ganesh, L., 2018. Financial Performance of Private
Commercial Banks in India: Multiple Regression Analysis. Academy of Accounting
and Financial Studies Journal. 22(2). pp.1-12.
Page, C. and Ayres, R., 2018. Policy Logic: Creating policy and evaluation capital in your
organisation. Evaluation Journal of Australasia. 18(1). pp.45-63.
Zou, L. and Li, X., 2018, August. Research on the Financial Performance Evaluation of
Chongqing Listed Companies in Strategic Emerging Industries. In International
Conference on Management Science and Engineering Management. (pp. 1683-1694).
Springer, Cham.
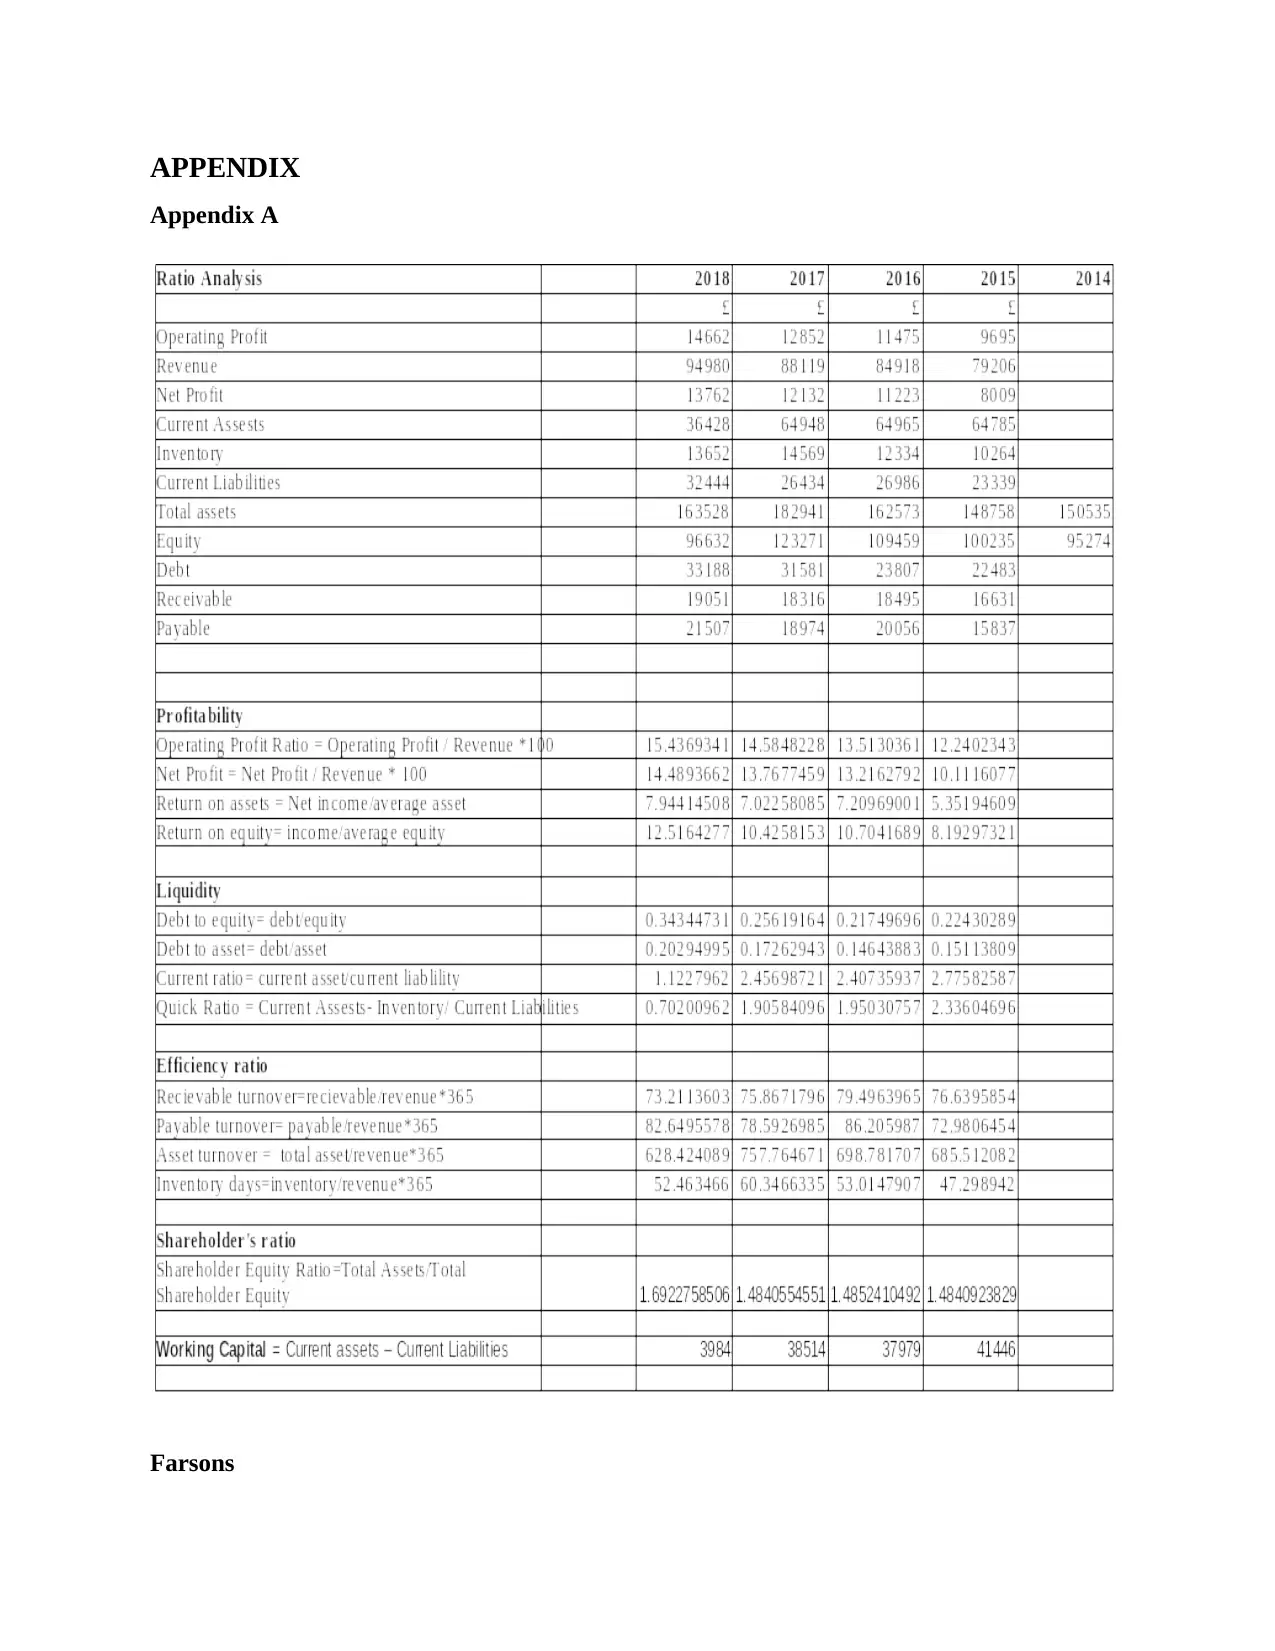
APPENDIX
Appendix A
Farsons
Appendix A
Farsons
⊘ This is a preview!⊘
Do you want full access?
Subscribe today to unlock all pages.
Trusted by 1+ million students worldwide
1 out of 24
Related Documents


Your All-in-One AI-Powered Toolkit for Academic Success.
+13062052269
info@desklib.com
Available 24*7 on WhatsApp / Email
![[object Object]](/_next/static/media/star-bottom.7253800d.svg)
Unlock your academic potential
Copyright © 2020–2026 A2Z Services. All Rights Reserved. Developed and managed by ZUCOL.