Financial Analysis Management & Enterprise (FAME) Report - Analysis
VerifiedAdded on 2023/01/18
|23
|3819
|60
Report
AI Summary
This report presents a comprehensive financial analysis of two companies, Heineken N.V. and Farsons, within the food and beverage industry. The analysis employs vertical and horizontal analysis techniques applied to the income statements and balance sheets of both companies over a four-year period (2015-2018). The report also includes a detailed ratio analysis, focusing on profitability ratios to assess the financial health and performance of each company. The findings reveal trends in revenue, expenses, and profitability, providing insights into the companies' financial stability, efficiency, and overall operational performance. The analysis provides critical insights on CFS in order to assist in decision making.
Financial Analysis
Management & Enterprise -
FAME
Management & Enterprise -
FAME
Paraphrase This Document
Need a fresh take? Get an instant paraphrase of this document with our AI Paraphraser
TABLE OF CONTENTS
INTRODUCTION...........................................................................................................................1
TASK 1............................................................................................................................................1
TASK 2............................................................................................................................................6
TASK 3............................................................................................................................................7
CONCLUSION................................................................................................................................7
REFERENCES................................................................................................................................8
APPENDIX......................................................................................................................................9
INTRODUCTION
Financial analysis management is considered to be one of the effective tool which is
useful in critically examining the operations and fiscal stability of business. This report helps in
analysing the working capital of the company for past two years. This study also helps in gaining
critical insight on CFS in order to assist in decision making.
Food and beverage industry consists of all those companies which helps in processing
raw food, package them and distribute them. This mainly comprises of packaged food, non-
alcoholic and alcoholic beverages. Simonds Farson Cisk plc is a food and beverage company in
Malta which was established in 1928. This company tends to produce various range of soft
drinks and beer. Farsons company mainly focuses on production of high quality award winning
beers which mainly includes ales, lagers and stouts under the brand name of “Farsons” and
“Cisk”. Heineken N.V. a company in Dutch which was established in 1864 by Gerard Adriaan
Heineken. This brand mainly own a portfolio of around 170 beer brands.
TASK 1
Financial analysis is useful in examining whether the company is financially stable,
profitable, solvent, etc. It also helps in examining the project, budget process and various other
financial transactions in order to determine the suitability and productivity of business enterprise.
a.) Vertical analysis
This is an effective method of financial statements where they focus on analysing each
line of item presented as a percentage of the particular base figure in particular financial
statement (Schroeder, Clark, and Cathey, 2019). Vertical analysis is considered to be important
because it helps in analysing the finances of the particular period.
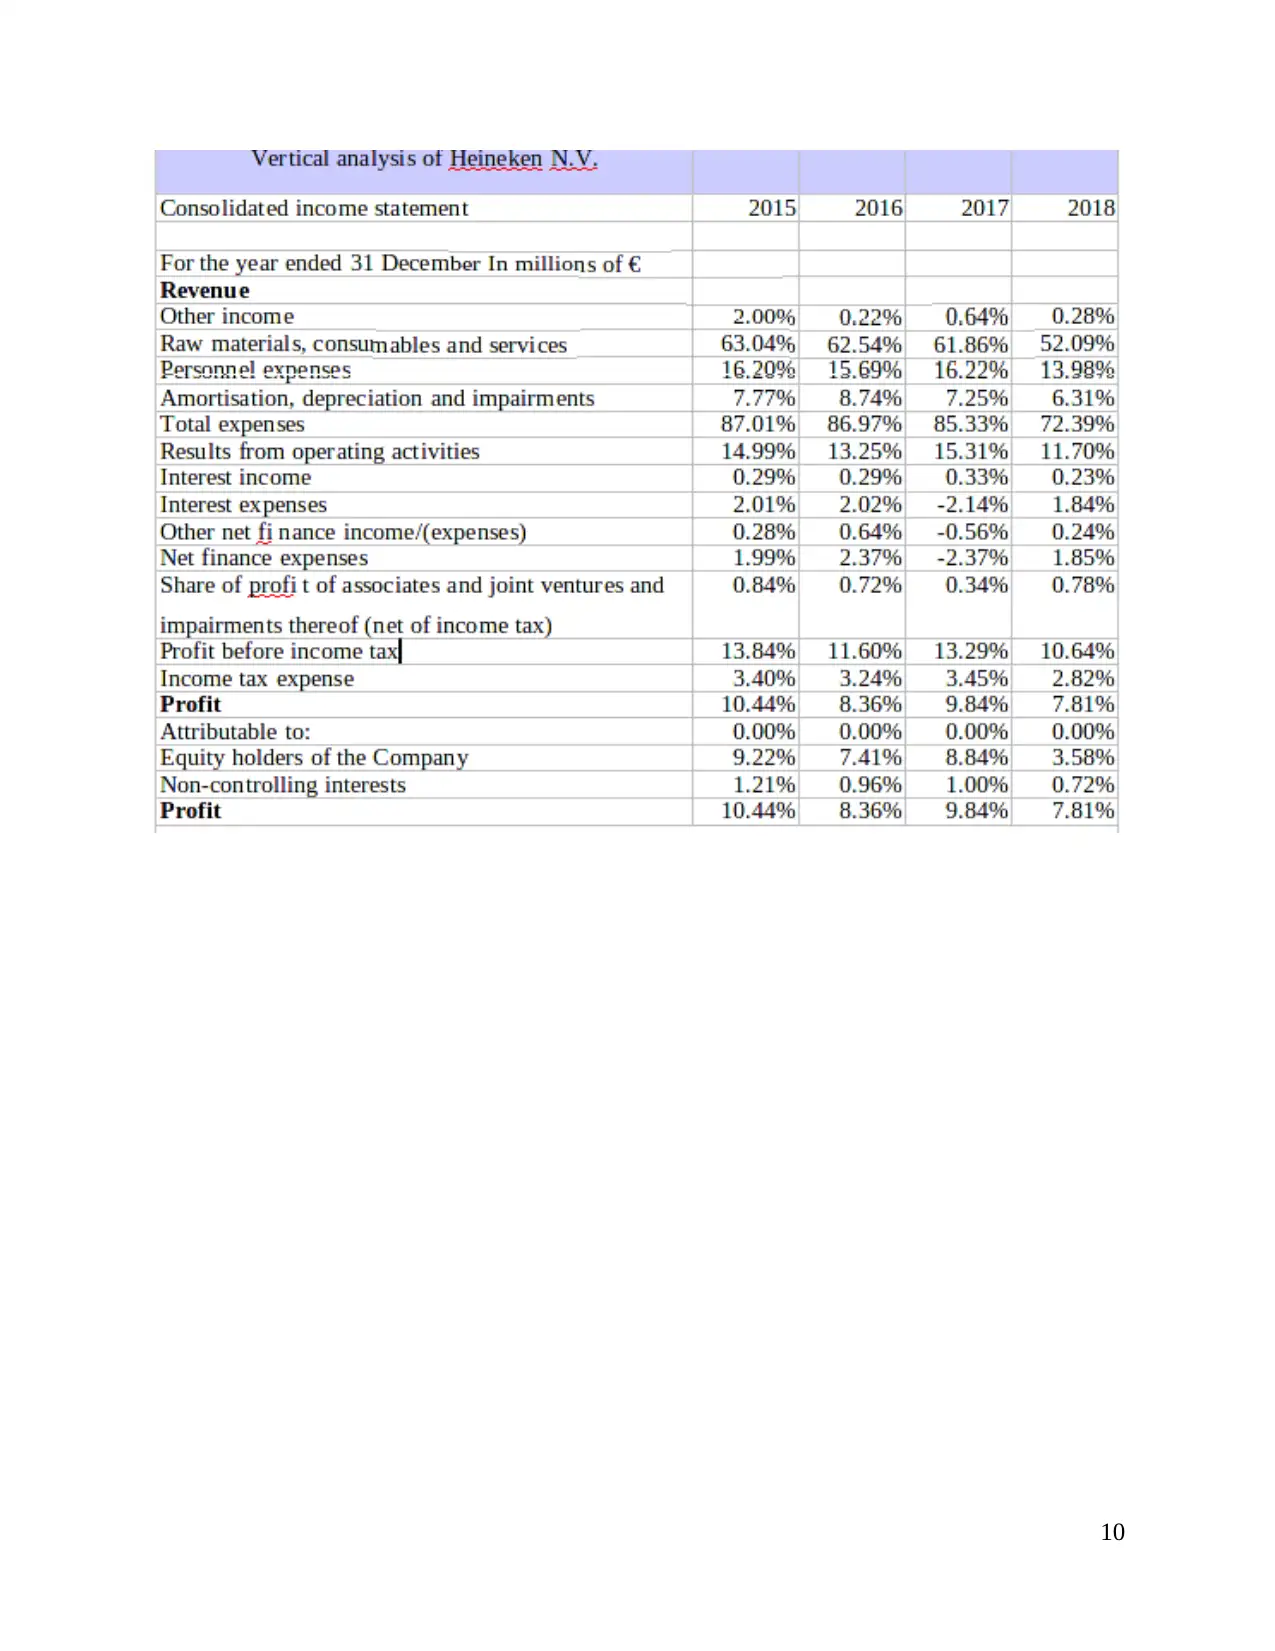
Vertical analysis of P&L statement of Heineken N.V.
Interpretation: From the above conducted analysis of the P&L statement of Heineken
N.V. It has been evaluated that, the profit of the company for 2015 is 10.44% and it has been
decreasing year after year. The profit of the company has reduced to 7.81% in 2018. The other
income of the company has gone lower from 2015 to 2018. This in turn states that, there is lower
level of income which in turn largely influences the operations of the business. The total
expenses of the company has reduced from 87.01% in 2015 to 72.39% in 2018. This in turn
helps institution in managing the finances of the organization.
Vertical analysis of income statement of Farsons company
1
Financial analysis management is considered to be one of the effective tool which is
useful in critically examining the operations and fiscal stability of business. This report helps in
analysing the working capital of the company for past two years. This study also helps in gaining
critical insight on CFS in order to assist in decision making.
Food and beverage industry consists of all those companies which helps in processing
raw food, package them and distribute them. This mainly comprises of packaged food, non-
alcoholic and alcoholic beverages. Simonds Farson Cisk plc is a food and beverage company in
Malta which was established in 1928. This company tends to produce various range of soft
drinks and beer. Farsons company mainly focuses on production of high quality award winning
beers which mainly includes ales, lagers and stouts under the brand name of “Farsons” and
“Cisk”. Heineken N.V. a company in Dutch which was established in 1864 by Gerard Adriaan
Heineken. This brand mainly own a portfolio of around 170 beer brands.
TASK 1
Financial analysis is useful in examining whether the company is financially stable,
profitable, solvent, etc. It also helps in examining the project, budget process and various other
financial transactions in order to determine the suitability and productivity of business enterprise.
a.) Vertical analysis
This is an effective method of financial statements where they focus on analysing each
line of item presented as a percentage of the particular base figure in particular financial
statement (Schroeder, Clark, and Cathey, 2019). Vertical analysis is considered to be important
because it helps in analysing the finances of the particular period.
Vertical analysis of P&L statement of Heineken N.V.
Interpretation: From the above conducted analysis of the P&L statement of Heineken
N.V. It has been evaluated that, the profit of the company for 2015 is 10.44% and it has been
decreasing year after year. The profit of the company has reduced to 7.81% in 2018. The other
income of the company has gone lower from 2015 to 2018. This in turn states that, there is lower
level of income which in turn largely influences the operations of the business. The total
expenses of the company has reduced from 87.01% in 2015 to 72.39% in 2018. This in turn
helps institution in managing the finances of the organization.
Vertical analysis of income statement of Farsons company
1
⊘ This is a preview!⊘
Do you want full access?
Subscribe today to unlock all pages.
Trusted by 1+ million students worldwide
Interpretation: From the conducted synthesis of the income statement of Farsons
company. It has been evaluated that, the profit of the organization has been increasing year after
year, i.e., the profit has raised from 10% in 2015 to 14% in 2018. This in turn states that,
company is growing and making enormous profit which leads sustainability and success for the
Farsons company. The sales of the company has reduced every year from 63% in 2015 to 62% in
2016 and 61% in 2017 and 2018. This in turn states that company is in better position to increase
their profit by attaining economies of scale. The operating profit of the company tends to
determine the income and expenses of the company excluding income tax expense and interest
expense. The operational earnings of the organization has increased to 12% in 2015 to 15% in
2018. The company is in a good position because of the increase in operating profit. This states
that, company has enough profit after paying for various variable cost of production. Profit
before tax in determines the profitability of organization before paying for income tax. The profit
before tax has been increasing every year from 12% in 2015 to 12% in 2016 to 13% in the 2017
and to 14% in 2018. This states that, company has been increasing its profit every year by
deducting all expenses including interest expense.
Vertical analysis of Balance sheet of Heineken N.V.
Interpretation: From the above conducted analysis of the balance sheet of Heineken N.V.
It has been investigated that, intangible assets are considered to be one of the most important in
the group of non current assets with 57% value in 2015 to 55% in 2018. Trade and trade
receivables have been considered to be at high percentage in total current assets for all the last
four years. This states that company has been generating high level of cash collection from the
customers. Loans and borrowings are considered to be at the highest in the non- current
liabilities. The company has been taking higher loans for effectively carrying out the operations
of the business. This in turn results in higher interest payment for the company which leads to
lower profitability. Trade and other paybles is considered to have the highest percentage among
current liabilities base of organization for 2015, 2016, 2017 and 2018. This states that,
organization has been purchasing high products on credit which are to be compensable on a
future date.
Vertical analysis of Balance sheet of Farsons company
Interpretation: From the above conducted analysis of the income statement of Farson
company It has been evaluated that, the company has invested high amount of money in plat and
2
Paraphrase This Document
Need a fresh take? Get an instant paraphrase of this document with our AI Paraphraser
machinery. The plant, property and equipments consists of 95% of total non- current assets in
2015. It has reduced to 92% in 2016 and furthermore, it has increased to 94% in 2017 and in
2018 it has reduced to 92%. This leads to higher operational efficiency and generation of higher
profits. The retained earning of the company has increased over the years. In 2015 the retained
earnings consists of 39%, in 2016 it has increased to 43% to 45% in 2017 and has decreased to
40% in 2018. This states that, company has been maintaining enough profit in order to meet any
contingency events. Farson company has been taking loan from and borrowings which mainly
consists of most of the non- current liabilities in 2015, 2016, 2017 and 2018. Trade and other
payables are considered to be highest in the line of total current liabilities.
b.) Horizontal analysis
This method is useful in comparing the financial ratios of the company and
benchmarking various line of items for a particular accounting period. This is also referred to as
a trend analysis which is very useful in determining the relative change in the various line items
over a period of time (Bogdanova and et.al., 2016). It is very useful in determining the cause of
the change in the particular accounts for particular accounting period.
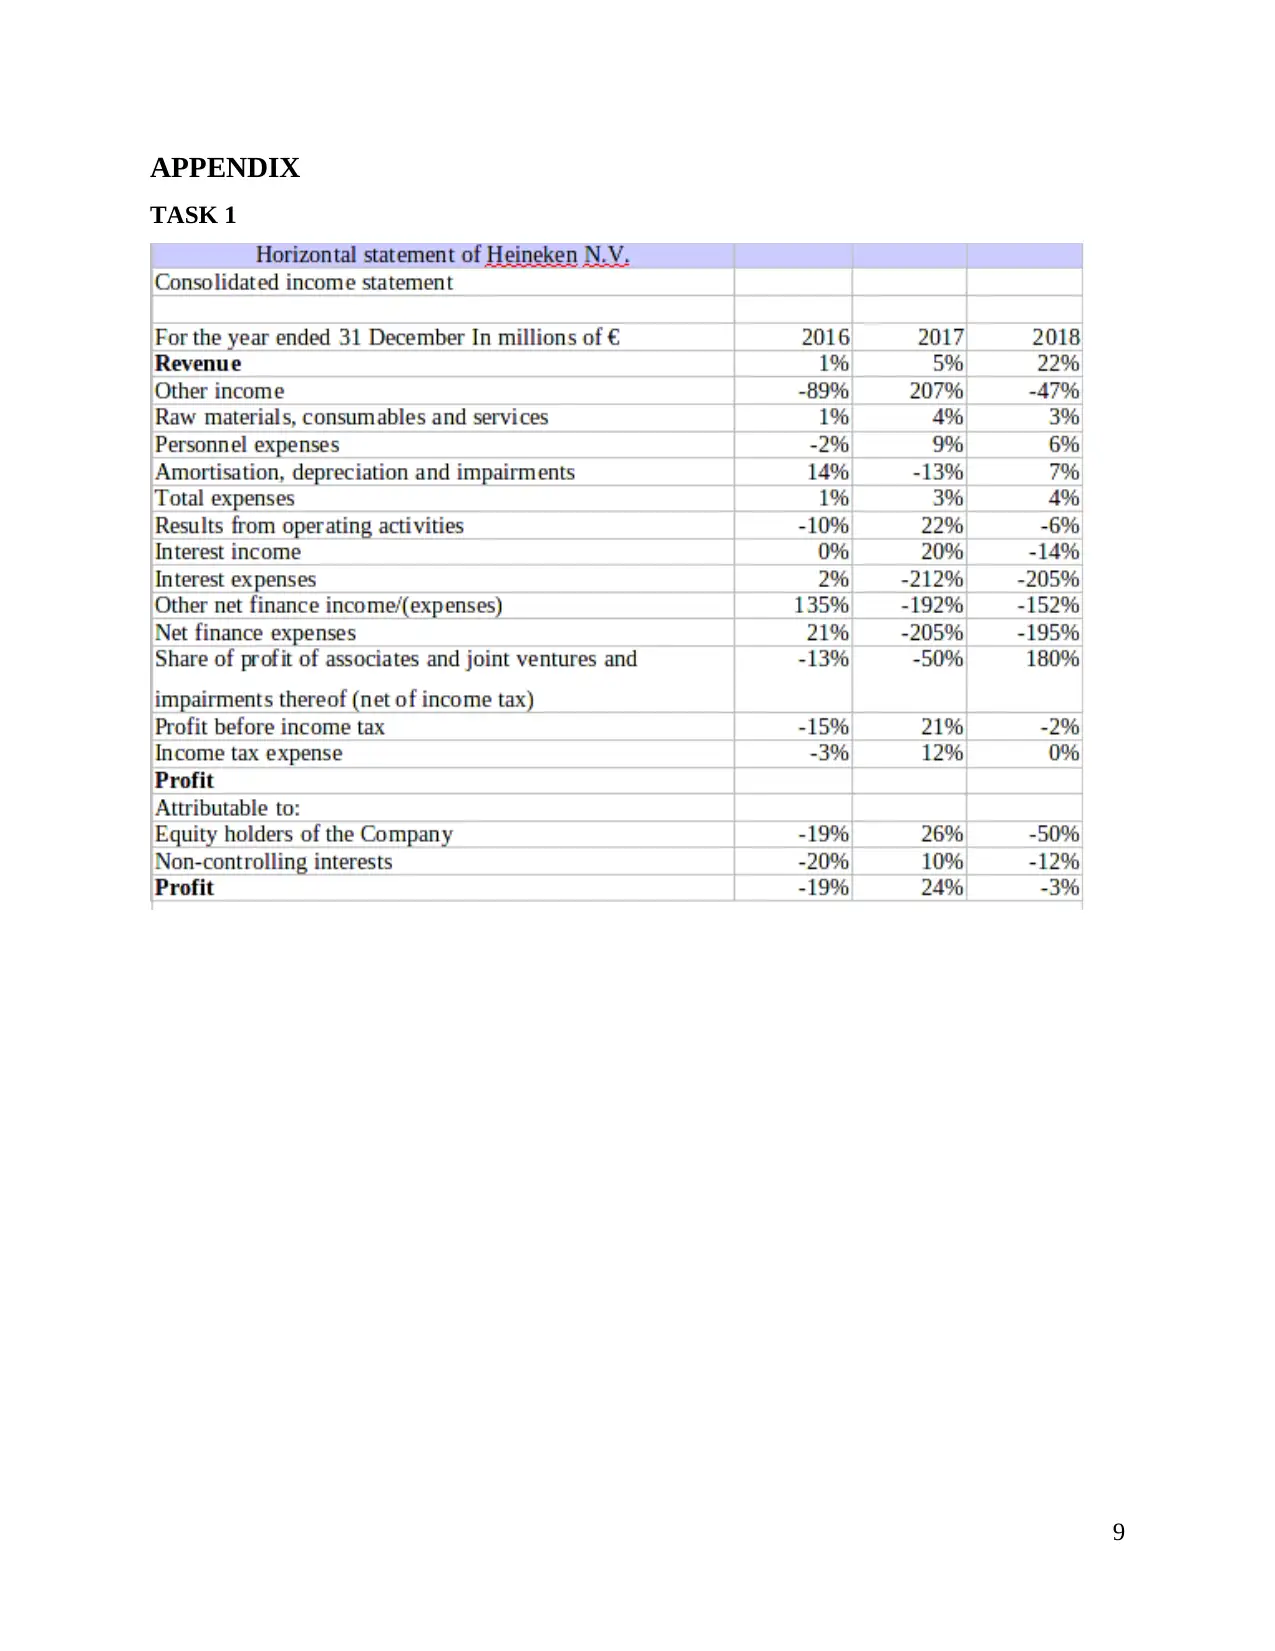
Horizontal analysis of P&L statement of Heineken N.V.
Interpretation: From the above conducted analysis of the P&L statement of Heineken
N.V. It has been evaluated that, revenue of the organization has increased from 1% in 2016 to
22% in 2018. Increase in revenue states that, the sales of the company has been increasing from
one period to the next period. This helps in determining the trend of institution which leads to
higher sustainability of the business. The total expenses of the company has increased due to
increase in sales. This results in higher expenses to produce and deliver the particular goods and
services. The expenditure of the organization has inflated over the years from 1% in 2016 to 3%
in 2017 to 4% in 2018. The profit earned before income and tax of the Heineken N.V. is
estimated to be from -15% in 2016 to 21% in 2017 to -2% in 2018.
Horizontal analysis of income statement of Farsons company
Interpretation: From the above conducted analysis of the income statement of Farsons
company. It has been evaluated that, the cost of sales of the company in 2016 was 7% in 2017
was 1% and in 2018 it has increased to 8%. The cost of sales of the company helps in evaluating
the carrying value of the particular goods and services. This in turn states that cost associated
with the delivering of goods and services to the company tend to largely affect the operations of
3
2015. It has reduced to 92% in 2016 and furthermore, it has increased to 94% in 2017 and in
2018 it has reduced to 92%. This leads to higher operational efficiency and generation of higher
profits. The retained earning of the company has increased over the years. In 2015 the retained
earnings consists of 39%, in 2016 it has increased to 43% to 45% in 2017 and has decreased to
40% in 2018. This states that, company has been maintaining enough profit in order to meet any
contingency events. Farson company has been taking loan from and borrowings which mainly
consists of most of the non- current liabilities in 2015, 2016, 2017 and 2018. Trade and other
payables are considered to be highest in the line of total current liabilities.
b.) Horizontal analysis
This method is useful in comparing the financial ratios of the company and
benchmarking various line of items for a particular accounting period. This is also referred to as
a trend analysis which is very useful in determining the relative change in the various line items
over a period of time (Bogdanova and et.al., 2016). It is very useful in determining the cause of
the change in the particular accounts for particular accounting period.
Horizontal analysis of P&L statement of Heineken N.V.
Interpretation: From the above conducted analysis of the P&L statement of Heineken
N.V. It has been evaluated that, revenue of the organization has increased from 1% in 2016 to
22% in 2018. Increase in revenue states that, the sales of the company has been increasing from
one period to the next period. This helps in determining the trend of institution which leads to
higher sustainability of the business. The total expenses of the company has increased due to
increase in sales. This results in higher expenses to produce and deliver the particular goods and
services. The expenditure of the organization has inflated over the years from 1% in 2016 to 3%
in 2017 to 4% in 2018. The profit earned before income and tax of the Heineken N.V. is
estimated to be from -15% in 2016 to 21% in 2017 to -2% in 2018.
Horizontal analysis of income statement of Farsons company
Interpretation: From the above conducted analysis of the income statement of Farsons
company. It has been evaluated that, the cost of sales of the company in 2016 was 7% in 2017
was 1% and in 2018 it has increased to 8%. The cost of sales of the company helps in evaluating
the carrying value of the particular goods and services. This in turn states that cost associated
with the delivering of goods and services to the company tend to largely affect the operations of
3
the business. The gross profit of the company has reduced from 18% in 2016 to 4% in 2017 to
8% in 2018. Gross profit is referred to as the profit made by the company after the deduction of
all the cost which is mainly associated with the sale of particular products and services. The
operating profit of the company in 2016 is estimated to be 18%, but it has lowered to 14% in
2018. The profit before tax of the company has also reduced from 23% in 2015 to 13% in 2017
to 18% in 2018. The profit of the company has reduced from 40% in 2016 to 13% in 2018.
Horizontal analysis of Balance sheet of Heineken N.V.
Interpretation: From the above conducted analysis of the balance sheet statement of
Heineken N.V. It has been evaluated that, other investment and receivables of the company has
decreased from 3% to -100% which in turn states that company has not been effectively utilizing
the funds present in the company. The total assets of the organization has inflated from -2% in
2016 to 4% in 2017. Further, it has reduced to 2% in 2018. The total liabilities of the company
has been reduced from 9% in 2016 to 7% in 2017.
Horizontal analysis of Balance sheet of Farsons company
Interpretation: From the above conducted analysis of the balance sheet statement of
Farsons company. It has been evaluated that, plant, property and equipments of the company has
increased from 12% in 2016 to 23% in 2017. Furthermore, it has reduced to 6% in 2018.
Reduction in the total non- current states that, there is a decline in the cash which in turn also
adversely leads to decline in long term values of the business. The total assets of the company
has also increased from 9% in 2016 to 13% in 2017 to -11% in 2018. Trade and other payables
of the company has been in negative but is reducing over a period of time. This in turn states
that, company is focusing on paying off its liabilities which in turn results in lower debt to the
company. The borrowings of the company has reduced from 67% in 2016 to 45% in 2017.
Furthermore, the borrowings has increased to 120% in 2018 which leads to higher interest
payment to the bank.c.) Ratio analysis
This is referred to as a quantitative method where they focus on gaining insight on the company's
profitability, liquidity and solvency position. Ratio analysis is useful in assessing the operations
of the business (Herasymovych, 2017).
Ratio analysis of Heineken N.V. And Farson company
Profitability ratio
4
⊘ This is a preview!⊘
Do you want full access?
Subscribe today to unlock all pages.
Trusted by 1+ million students worldwide
This ratio is useful in determining the profits earned by the company for particular
accounting period (Yu, 2015, June).
Operating profit ratio: This helps in determining the amount of profit earned by the
company after the payment of variable cost associated with production. The operating profit of
the Heineken N.V. has increased over the years from 12% in 2015 to 13% in 2016 to 14% in
2017 to 15% in 2018. This states that, Heineken N.V. has been effectively increasing the profit
every year after paying off the operational expenses. On the contrary, the operating profit of the
Farson company has been reducing over the years from 14% in 2015 to 13% in 2016 to 12% in
2017 to 11% in 2018. This in turn states that, the company has not been effectively utilizing the
resources of the company.
Net profit: The net profit of the Heineken N.V. has increased over the years from 10% in
2015 to 13% in 2016 to 13% in 2017 to 14% in 2018. This states that, Heineken N.V. has been
very effective in converting sales into profit (Zheng and Su, L.D., 2015). On the contrary, the net
profit of the Farson company has been reducing over the years from 10% in 2015 to 8% in 2016
to 8% in 2017 to 7% in 2018. This in turn states that, the higher cost is attached to the company
in selling goods which leads to lower profitability.
Return on assets: The return on assets of the Heineken N.V. has increased over the years
from 5% in 2015 to 7% in 2016 to 7% in 2017 to 7.9% in 2018. This states that, Heineken
N.V. has been effectively utilizing the resources to generate higher profit. On the contrary, the
return on assets of the Farson company have minor difference over the years.
Return on equity: The return on equity of the Heineken N.V. has increased over the
years from 8% in 2015 to 10% in 2016 to 10% in 2017 to 12% in 2018. This in turn states,
Heineken N.V. has been generating higher profit. On the contrary, the return on equity of the
Farson company has reduced from 15% in 2015 to 13% in the year 2018. This states that,
Farson company is not efficient in generating profits.
Liquidity ratio
Debt to equity ratio: Heineken N.V. has increased its debt to equity ratio from 0.22 in
2015 to 0.34 in 2018. This states that, company has improved its debt obligation. On the
contrary, Farson company has high debt equity ratio of 0.81 in 2018.
5
Paraphrase This Document
Need a fresh take? Get an instant paraphrase of this document with our AI Paraphraser
Current ratio: The current ratio of Heineken N.V. has reduced from 2.77 in 2015 to 1.12
times in 2018. 1:2 is considered the appropriate ratio. On the contrary, Farson company has
much less current ratio to pay off its liabilities as compared to Heineken N.V.
Efficiency ratio
Inventory days: Heineken N.V. has increased the inventory days from 47 days in 2015 to
52 days in 2018. This states that, the company is building up the inventory which leads to high
outflow of cash. On the contrary, Farson company has been using inventory appropriately
because it has lower inventory days of 26 in 2018.
Shareholder's ratio
Shareholder's equity ratio: Heineken N.V. has increased the shareholder's equity ratio
from 1.48 in 2015 to 1.69 in 2018. On the contrary, Farson company has reduced the
shareholder's equity ratio from 2.96 in 2015 to 2.69 in 2018. Farson company has high
shareholder's equity ratio as compared to Heineken N.V. in 2018. This states that, company has
been reducing its operating expense and increasing revenue.
TASK 2
Net working capital is referred to as financial metric which helps in determining the
operational liquidity of the business. The working capital is the difference between the CA and
CL of the organization.
Importance of working capital
This is an effective metric because it helps in enhancing the goodwill of the organisation.
It is very useful in strengthening the financial position of the organisation (Xie, 2015,
November). Effective working capital helps in smooth business operations and is very useful in
effectively overcoming any financial crisis.
Working capital of Heineken N.V. and Farson company
The working capital of Heineken N.V. for 2015 is estimated to be 41446 and it has been
reduced to 3984 in 2018. The positive net working capital of the institution states that, company
has the ability to pay off its short term obligations. Decrease in working capital of the business is
considered to be the source of fund for the company. On the contrary, The working capital of
Farson company for 2015 is estimated to be -2602 and it has been to -1380 in 2018. The
negative working capital of the company states that, company has high liabilities.
6
TASK 3
Cash flow is the amount of cash been generated and amount of cash that has been flowed
out of the business is presented in the cash flow statement (Ding, 2015, April). This is considered
to be one of the effective way in determining the cash inflows and outflows of the company.
Cash flow of Heineken N.V.
Interpretation: From the above conducted analysis of the income statement of Heineken
N.V. company. It has been evaluated that, the cash flow from operating activity has increased
from 3882 in 2017 to 4388 in 2018. This means company has been effectively managing the cash
and current assets and liabilities of company. The cash flow used in investing activity is -2355 in
2018 as compared with -2965 in 2017. The cash flow used in financing activity is -967 in 2018
as compared with -966 in 2017. The negative cash from financing activity states that company
has been performing in debt and is also making dividends to the stockholders.
Cash flow of Farson company
Interpretation: From the above conducted analysis of the income statement of Farsons
company. It has been evaluated that, the cash flow from operating activity has increased from
13135 in 2017 to 20893 in 2018. The cash used in investing activity is -19714 in 2017 to -21407
in 2018. The negative cash from investing activity tends to evaluate that the company has been
investing more for future growth (Fauzan and Nugraha, 2018, December). The net cash used in
from financing activity in 2018 is -656. The negative cash from financing activity tends to
indicate that, company has been running out of capital which in turn leads to additional
borrowing, higher interest payment and lower profitability.
CONCLUSION
This study summarizes that, Heineken N.V. Has been performing good as compared with
Farson company. The company tends to generate higher net profit as compared with the Farson
company. On the contrary, Farson company has been using inventory appropriately because it
has lower inventory days. This means optimum stocking and effective utilization of financial
resources.
7
⊘ This is a preview!⊘
Do you want full access?
Subscribe today to unlock all pages.
Trusted by 1+ million students worldwide
REFERENCES
Books and Journals
Bogdanova, S.V and et.al., 2016. Management of small innovational enterprise under the
conditions of global competition: possibilities and threats. European Research
Studies.19(2). p.268.
Ding, Y., 2015, April. Enterprise Financial Management System Analysis and Design based on
ERP. In International Conference on Advances in Mechanical Engineering and Industrial
Informatics. Atlantis Press.
Fauzan, H. and Nugraha, D.P., 2018, December. Analysis on Financial Performance Influence
Toward Market Performance with ERM (Enterprise Risk Management) Implementation
Category as Moderator Variable. In Journal of International Conference Proceedings (Vol.
1, No. 2).
Herasymovych, I., 2017. Mechanisms and Tools of Accounting and Financial Engineering in
Enterprise Management. Accounting and finance, (1), pp.25-32.
Xie, M., 2015, November. The Design of the Securities Enterprise Customer Relationship
Management System. In 2015 International Conference on Industrial Technology and
Management Science. Atlantis Press.
Yu, J., 2015, June. Synergistic Model Construction of Enterprise Financial Management
Informatization. In 2015 2nd International Conference on Electrical, Computer
Engineering and Electronics. Atlantis Press.
Zheng, J. and Su, L.D., 2015. The analysis of standardized administration in enterprise financial
accounting. In Management, Information and Educational Engineering (pp. 1149-1152).
CRC Press.
8
Paraphrase This Document
Need a fresh take? Get an instant paraphrase of this document with our AI Paraphraser
APPENDIX
TASK 1
9
TASK 1
9
10
⊘ This is a preview!⊘
Do you want full access?
Subscribe today to unlock all pages.
Trusted by 1+ million students worldwide
1 out of 23
Related Documents


Your All-in-One AI-Powered Toolkit for Academic Success.
+13062052269
info@desklib.com
Available 24*7 on WhatsApp / Email
![[object Object]](/_next/static/media/star-bottom.7253800d.svg)
Unlock your academic potential
Copyright © 2020–2026 A2Z Services. All Rights Reserved. Developed and managed by ZUCOL.