Financial Performance Analysis and Assessment: Farsons vs. Heineken
VerifiedAdded on 2023/01/18
|18
|3859
|38
Report
AI Summary
This report conducts a comprehensive financial analysis of Farsons and Heineken, two prominent companies in the brewing and beverage industry. The analysis encompasses vertical and horizontal assessments of their income statements and financial position statements over a four-year period, highlighting trends in gross profit, net profit, assets, liabilities, and stockholder's equity. The report also delves into the importance of working capital management for both companies and provides a critical examination of their annual cash flow statements, evaluating their cash flow activities. The findings offer insights into the financial performance, strengths, and weaknesses of each company, aiding in informed decision-making and strategic planning.

FINANCIAL ANALYSIS
MANAGEMENT & ENTERPRISE
MANAGEMENT & ENTERPRISE
Paraphrase This Document
Need a fresh take? Get an instant paraphrase of this document with our AI Paraphraser
Contents
INTRODUCTION...........................................................................................................................1
1. FINANCIAL PERFORMANCE ANALYSIS.............................................................................1
Assessment of financial performance of Farsons...................................................................2
Assessment of financial performance of Heineken................................................................7
Ratio analysis........................................................................................................................12
2. IMPORTANCE OF ASSESSING THE WORKING CAPITAL..............................................14
Working capital management of Farsons.............................................................................14
Working capital management of Heineken..........................................................................14
3. CRITICAL ASSESSMENT OF THE ANNUAL CASH FLOW STATEMENT.....................14
Cash flows of Heineken........................................................................................................14
Cash flows of Farsons..........................................................................................................15
CONCLUSION..............................................................................................................................15
REFERENCES..............................................................................................................................16
INTRODUCTION
Financial analysis evaluate business, economic trend, building financial policy, long term
goals investors will examine a company's financial statement, income statement, balance sheet,
cash flow statement (Karanina, Bykova and Ilysheva, 2014). Financial ratios are used to evaluate
it performance as compared to other company financial analysis will provide best project for the
companies. To evaluate the financial statements, financial statements of Farson and Heineken are
taken. these company’s ideals in providing best beers and brewers to its consumer's and its
clients. these companies have created market in local as well as international platform. This
report will include the financial ratios of both the companies, along with vertical, horizontal
analysis, further for making decision, importance of analysing of the working capital. Finally,
report will include a critical analysis of annual cash flow statements of both the company for two
years, finding will be accurate for making better decision for the firm.
1. FINANCIAL PERFORMANCE ANALYSIS
Overview of Farsons
Farsons group established in 1928, since then group is engaged in the brewing of beers
and beverages. it also involves in production and sale, distribution of beverages (Zeghal and El
Aoun, 2016). In the competitive environment where the world’s leading food and beverage are
competitive with each other, Farsons is committed to hold highest product standards and services
in the portfolio, as a leading group of companies with an annual turnover in excess of euro 95
million. The group also focuses on innovation and export of beverages including wines and
spirits will also help in ongoing growth and success. The aim of organisation is to grow both on
local as well as on international business, with investment in million Farsons is ensuring its
clients and consumer, gets best quality standard beer with new beverage packing facility. It
focuses on providing better quality of beverage to gain loyalty from consumers and to build
meaningful partnership with other competitive brands to enhance its business.
Overview of Heineken
Heineken is the world's leading portfolios of beer brands and is one of the world's leading
brewers in terms of sales volume and profitability. It includes more than 200 international
premiums, regional, speciality beers. It has a good network of distribution beer and breweries,
Heineken is giving good competition in domestic as well as international market with world class
1
⊘ This is a preview!⊘
Do you want full access?
Subscribe today to unlock all pages.
Trusted by 1+ million students worldwide

brands of beer and brewers for its customers and for clients. With variety of cocktail and brewers
and of beer consumer is enjoying their times. Heineken is taking over the market of brewers by
providing better quality beer to it consumer and client. it has capture local and international
market by distributors of beer and brewers to its clients (Farrell and Gallagher, 2015).
Assessment of financial performance of Farsons
Vertical analysis
A form of analysis that involves report of profits and loss and financial position statement
of organisation. All revenue report numbers are separated by the sales number so the revenue
statement estimates are sales figures. All the elements of financial position statements are split
by total assets of organisation in order to transform the figures of financial position statements
into percentages of figures of total assets (Bekele, 2016).
Income statement
Based on the vertical assessment of Farsons ' income statement, it was estimated that the gross
margin of the firm was 37.97 percent in 2015, that was boosted to 38.82 percent in 2016 or 38.64
percent or 38.95 percent in both in 2017 and 2018 (Muscat, 2013).
2
Paraphrase This Document
Need a fresh take? Get an instant paraphrase of this document with our AI Paraphraser
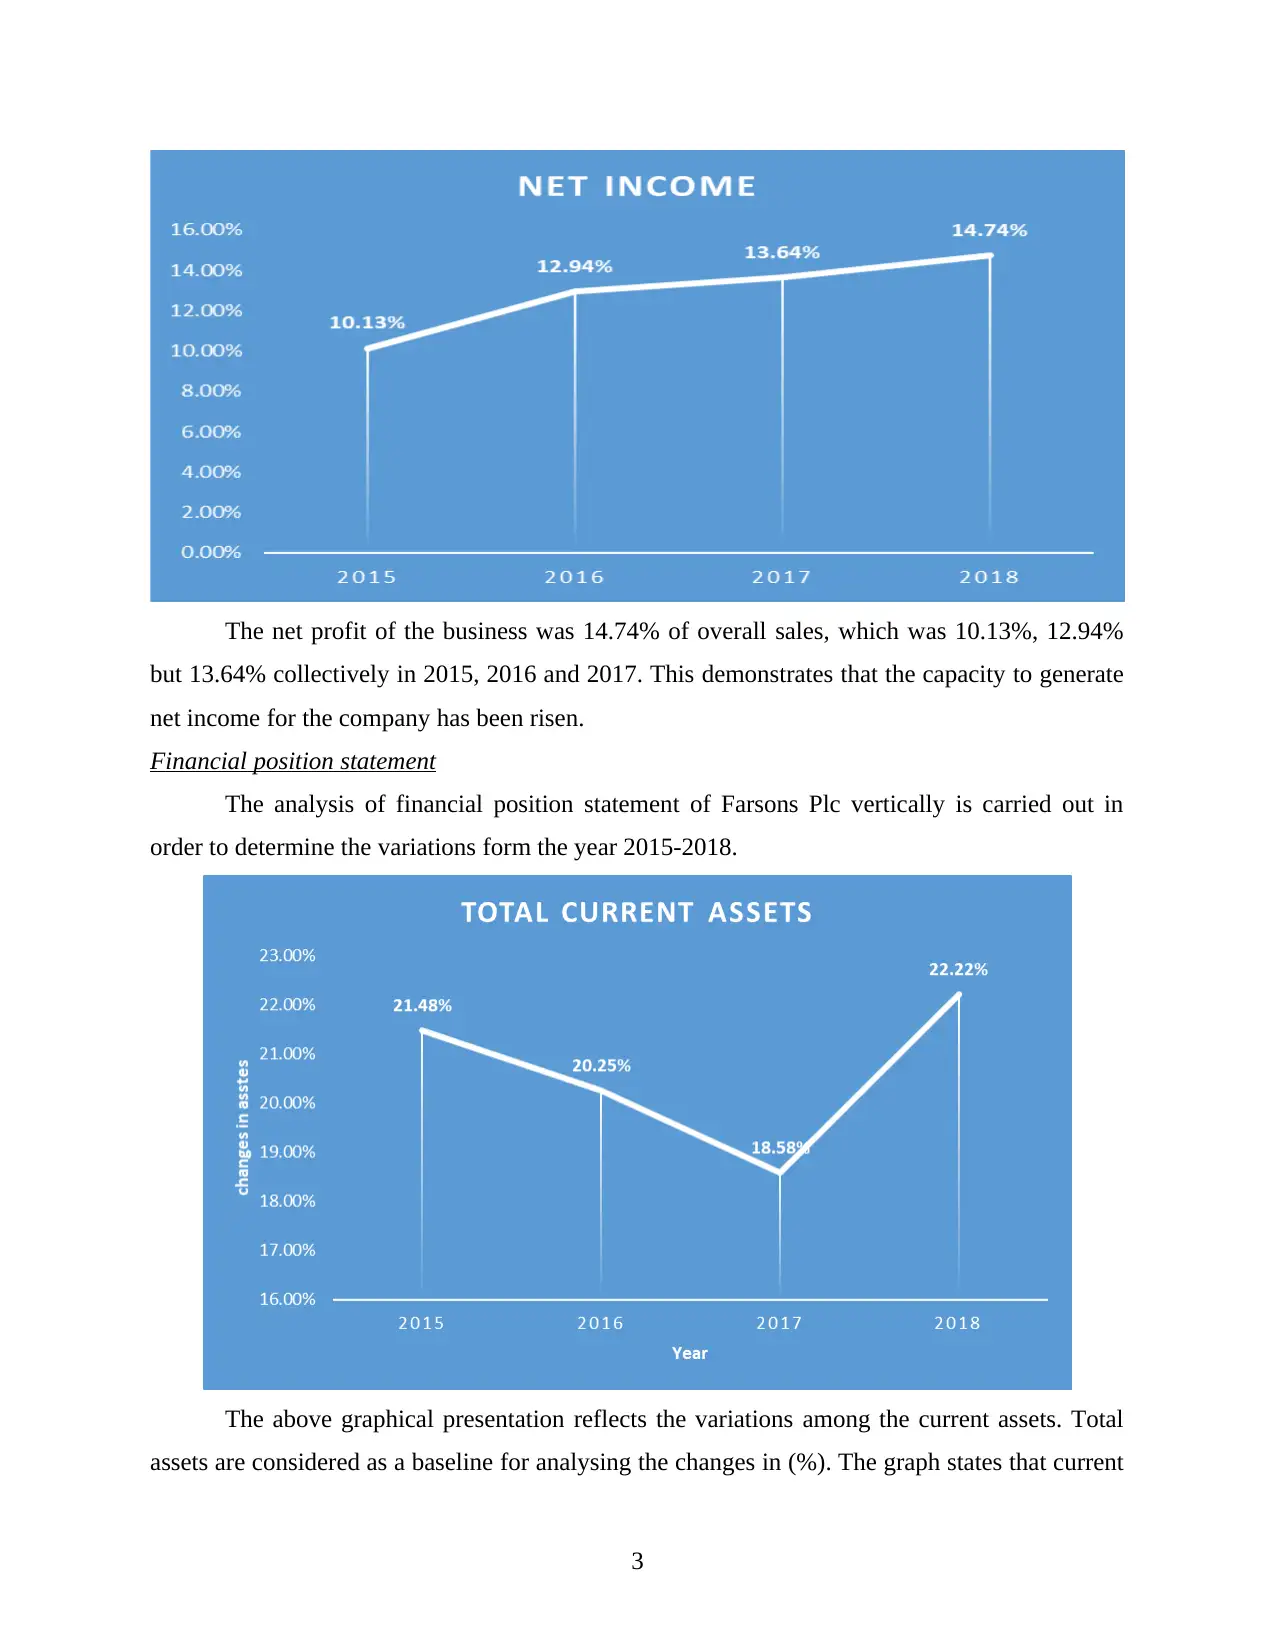
The net profit of the business was 14.74% of overall sales, which was 10.13%, 12.94%
but 13.64% collectively in 2015, 2016 and 2017. This demonstrates that the capacity to generate
net income for the company has been risen.
Financial position statement
The analysis of financial position statement of Farsons Plc vertically is carried out in
order to determine the variations form the year 2015-2018.
The above graphical presentation reflects the variations among the current assets. Total
assets are considered as a baseline for analysing the changes in (%). The graph states that current
3
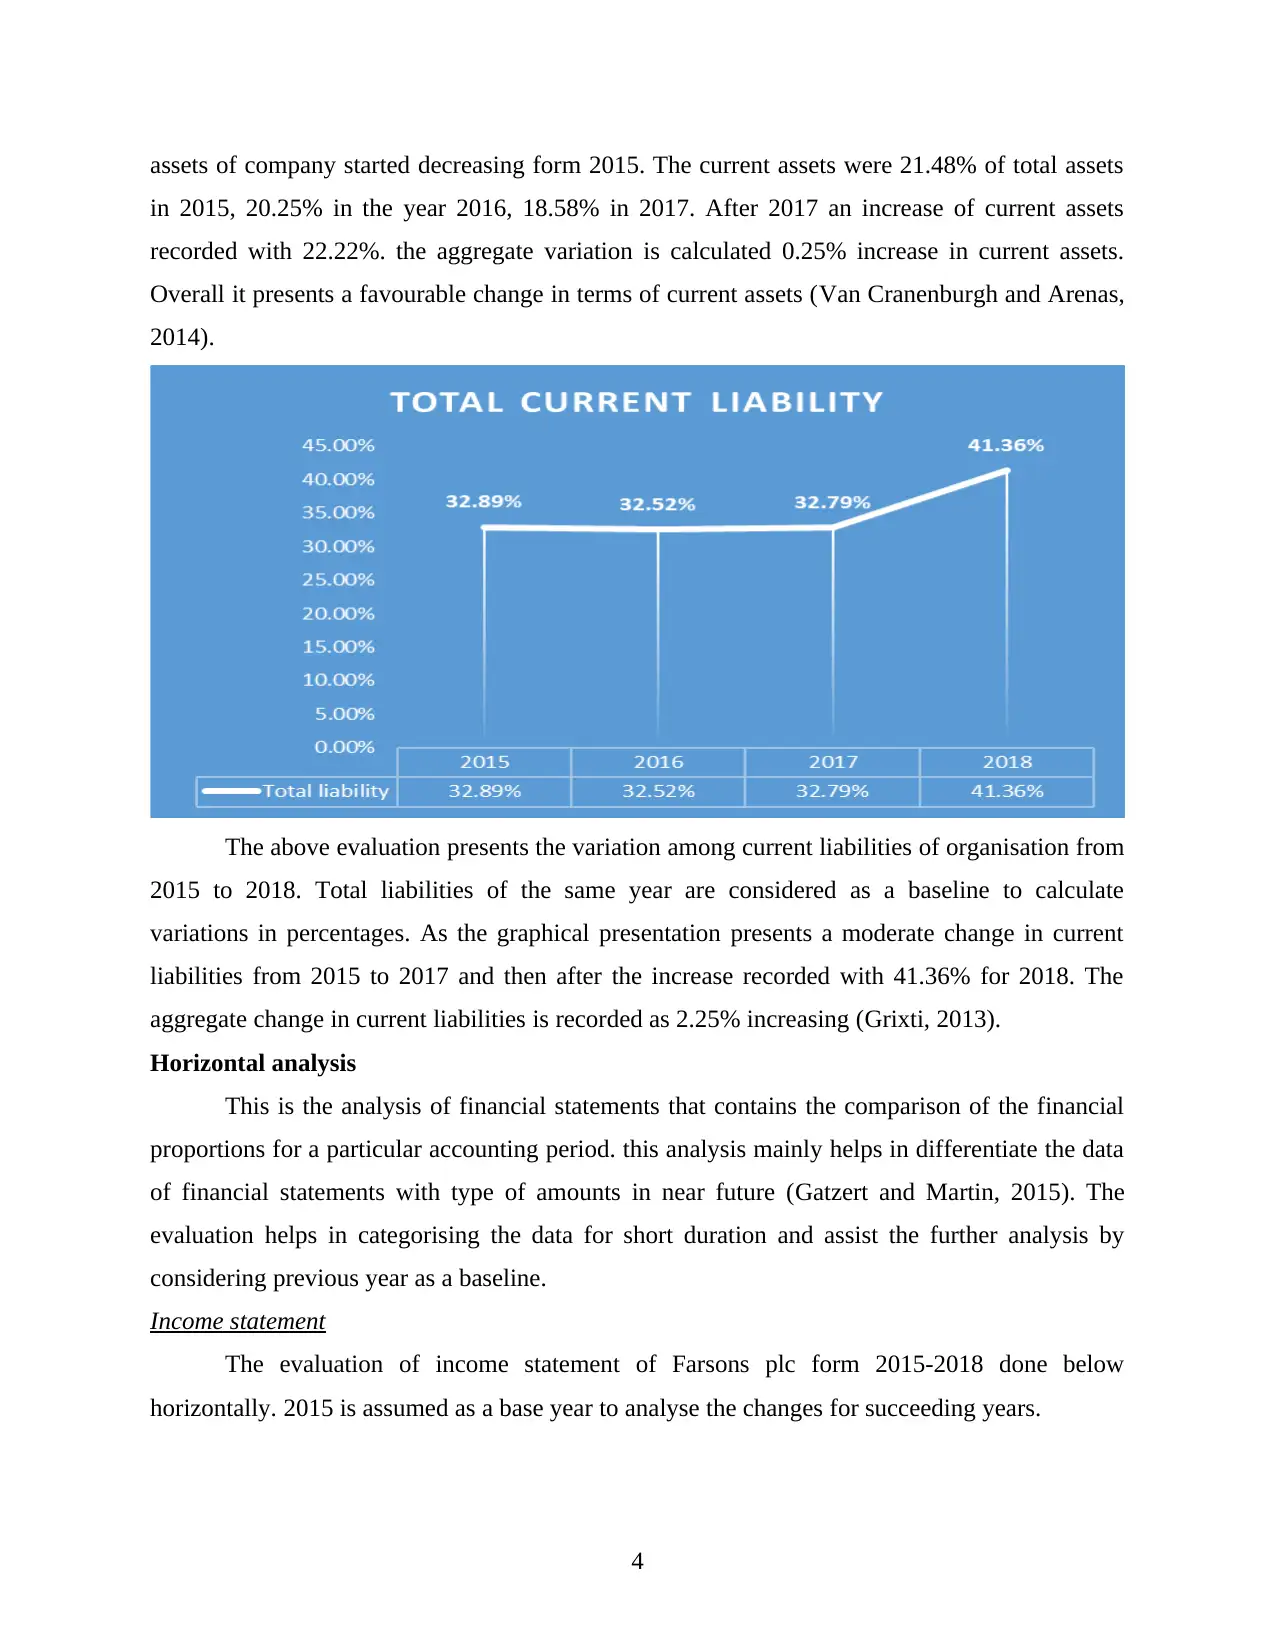
assets of company started decreasing form 2015. The current assets were 21.48% of total assets
in 2015, 20.25% in the year 2016, 18.58% in 2017. After 2017 an increase of current assets
recorded with 22.22%. the aggregate variation is calculated 0.25% increase in current assets.
Overall it presents a favourable change in terms of current assets (Van Cranenburgh and Arenas,
2014).
The above evaluation presents the variation among current liabilities of organisation from
2015 to 2018. Total liabilities of the same year are considered as a baseline to calculate
variations in percentages. As the graphical presentation presents a moderate change in current
liabilities from 2015 to 2017 and then after the increase recorded with 41.36% for 2018. The
aggregate change in current liabilities is recorded as 2.25% increasing (Grixti, 2013).
Horizontal analysis
This is the analysis of financial statements that contains the comparison of the financial
proportions for a particular accounting period. this analysis mainly helps in differentiate the data
of financial statements with type of amounts in near future (Gatzert and Martin, 2015). The
evaluation helps in categorising the data for short duration and assist the further analysis by
considering previous year as a baseline.
Income statement
The evaluation of income statement of Farsons plc form 2015-2018 done below
horizontally. 2015 is assumed as a base year to analyse the changes for succeeding years.
4
⊘ This is a preview!⊘
Do you want full access?
Subscribe today to unlock all pages.
Trusted by 1+ million students worldwide
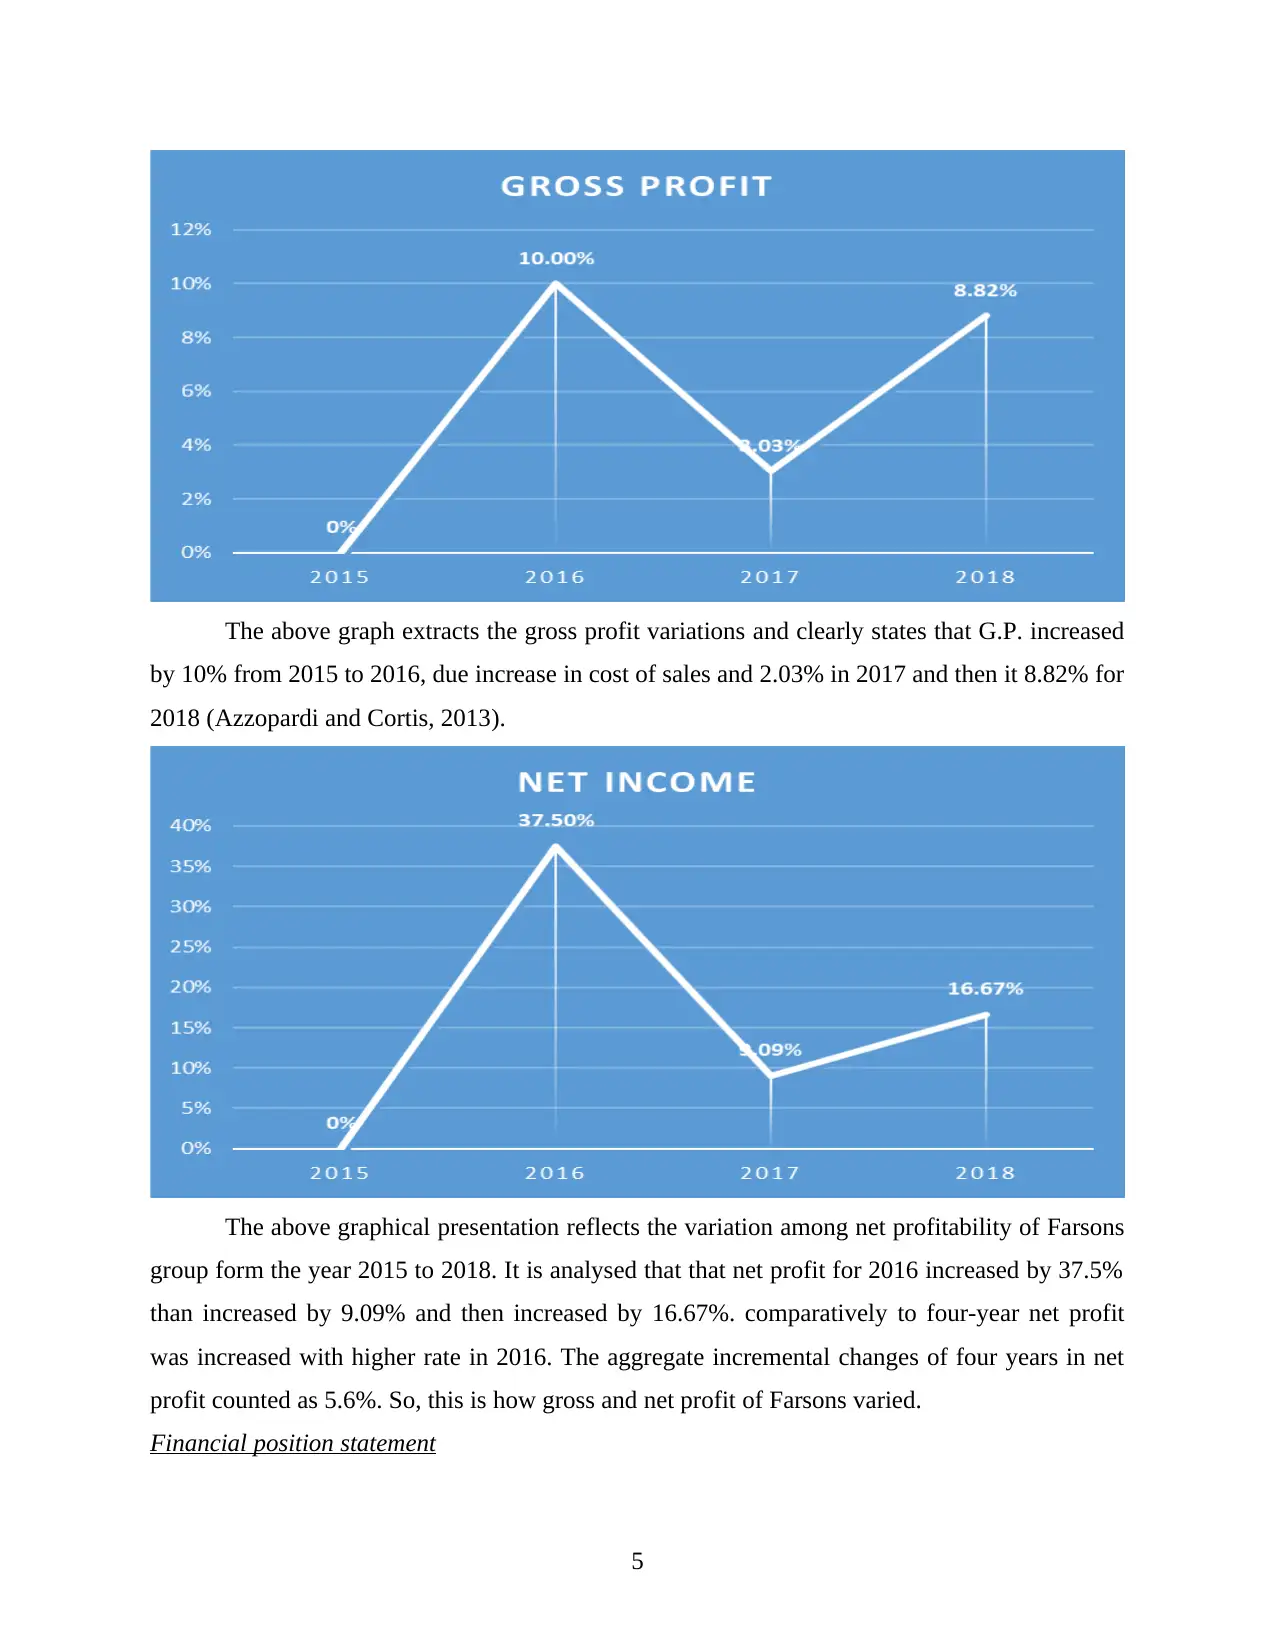
The above graph extracts the gross profit variations and clearly states that G.P. increased
by 10% from 2015 to 2016, due increase in cost of sales and 2.03% in 2017 and then it 8.82% for
2018 (Azzopardi and Cortis, 2013).
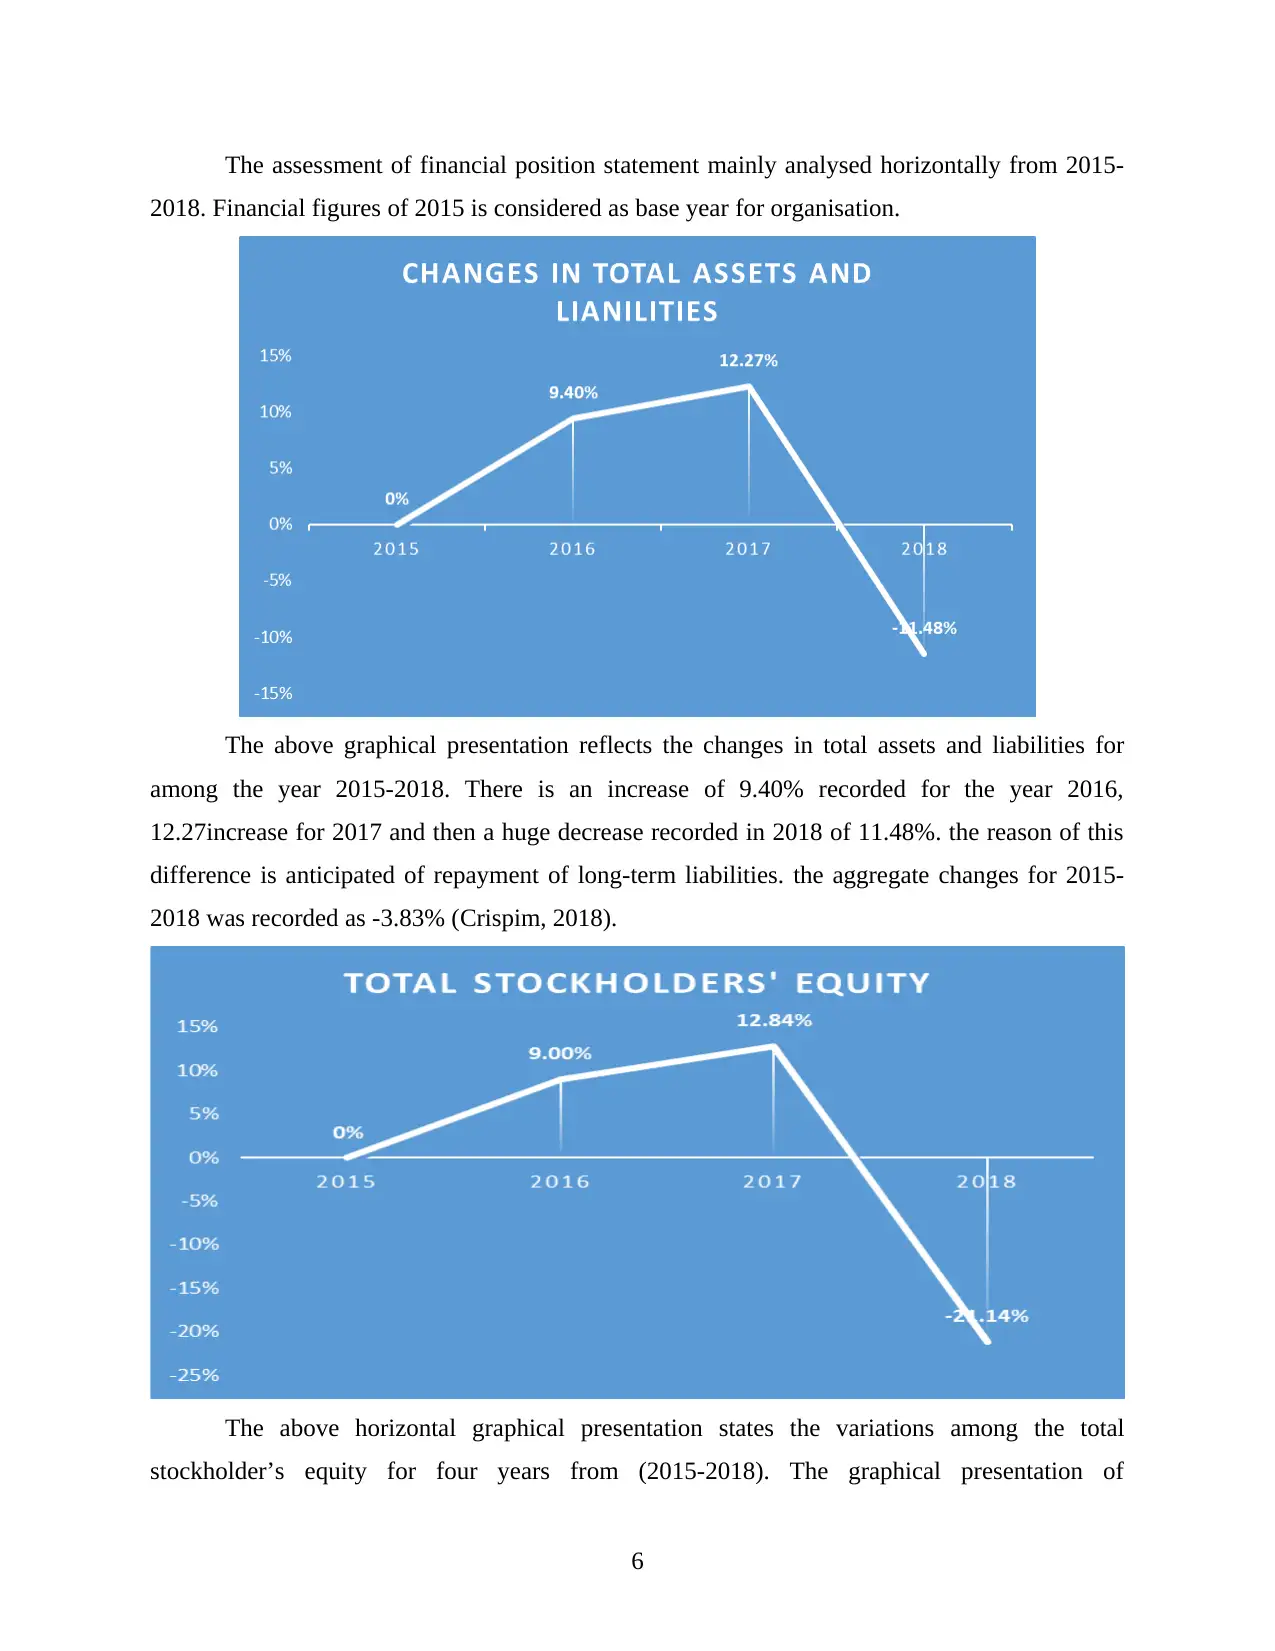
The above graphical presentation reflects the variation among net profitability of Farsons
group form the year 2015 to 2018. It is analysed that that net profit for 2016 increased by 37.5%
than increased by 9.09% and then increased by 16.67%. comparatively to four-year net profit
was increased with higher rate in 2016. The aggregate incremental changes of four years in net
profit counted as 5.6%. So, this is how gross and net profit of Farsons varied.
Financial position statement
5
by 10% from 2015 to 2016, due increase in cost of sales and 2.03% in 2017 and then it 8.82% for
2018 (Azzopardi and Cortis, 2013).
The above graphical presentation reflects the variation among net profitability of Farsons
group form the year 2015 to 2018. It is analysed that that net profit for 2016 increased by 37.5%
than increased by 9.09% and then increased by 16.67%. comparatively to four-year net profit
was increased with higher rate in 2016. The aggregate incremental changes of four years in net
profit counted as 5.6%. So, this is how gross and net profit of Farsons varied.
Financial position statement
5
Paraphrase This Document
Need a fresh take? Get an instant paraphrase of this document with our AI Paraphraser
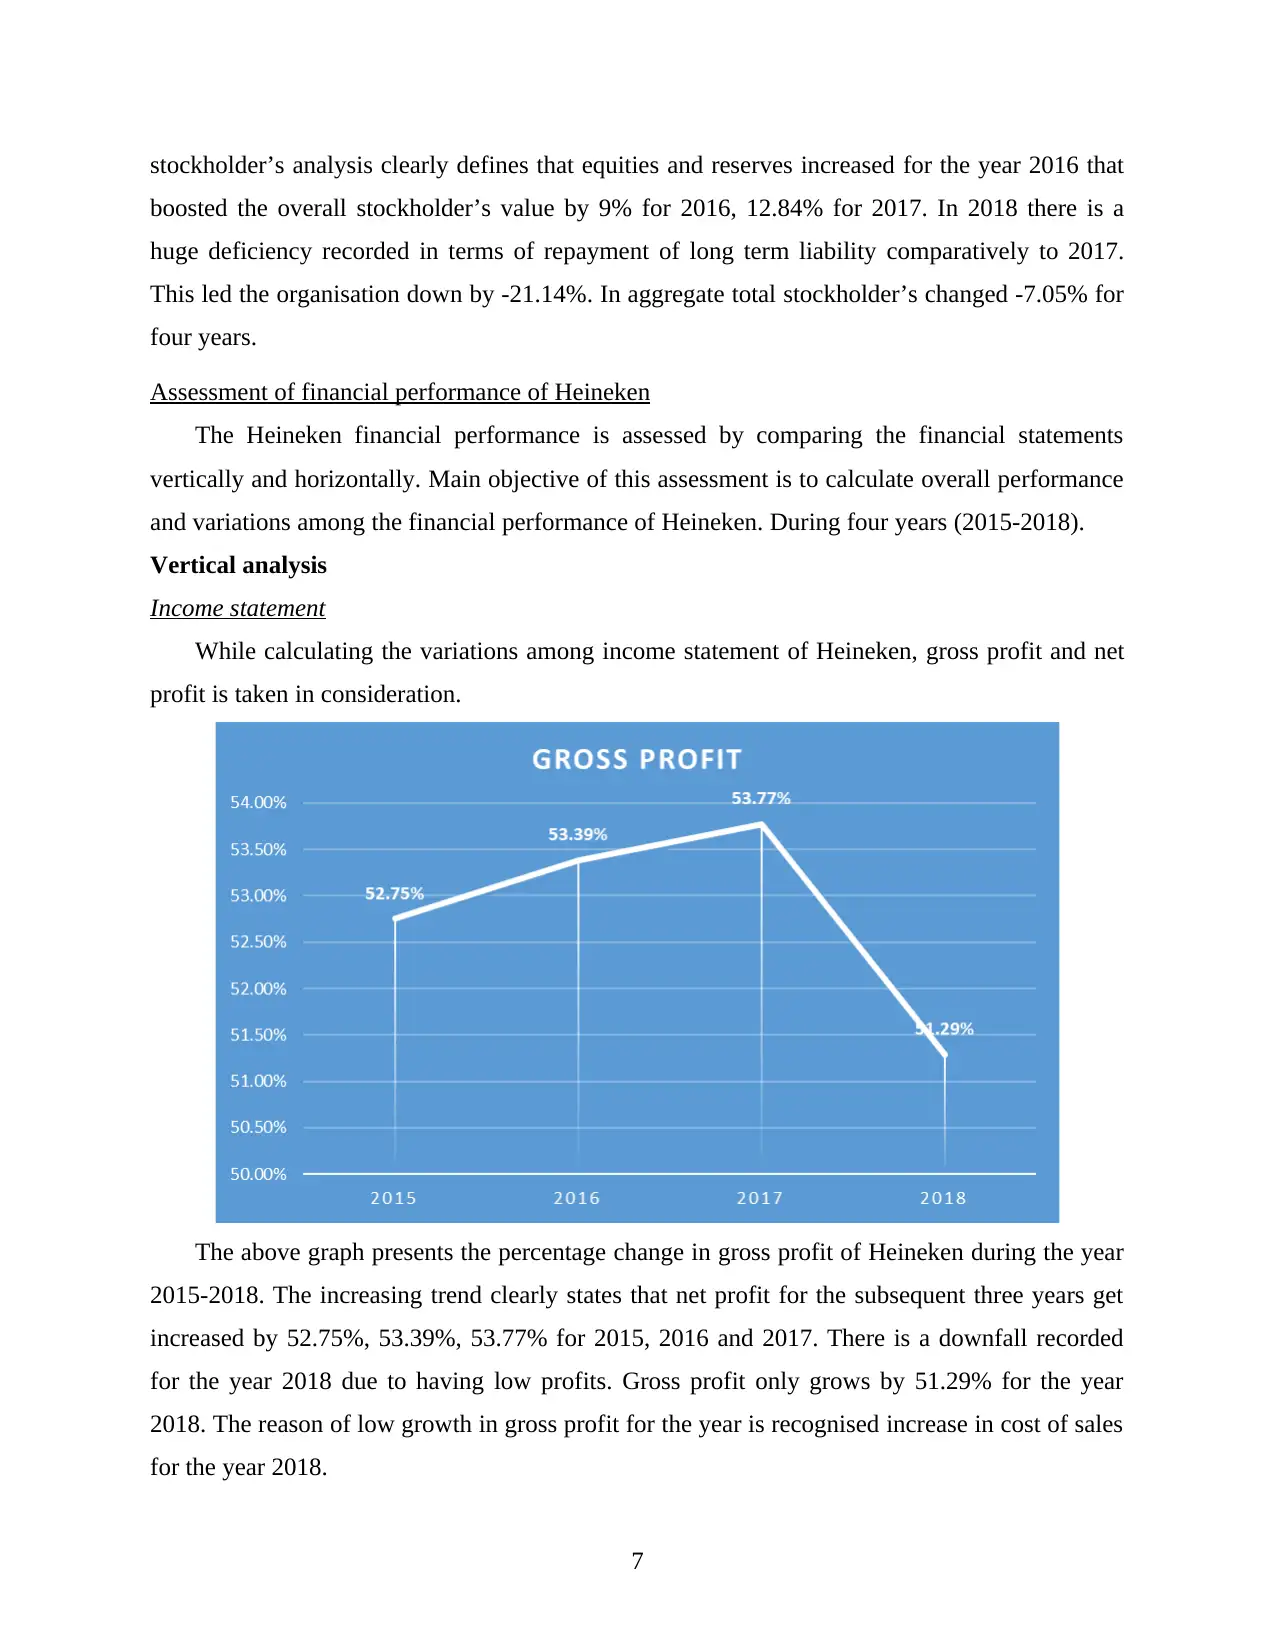
The assessment of financial position statement mainly analysed horizontally from 2015-
2018. Financial figures of 2015 is considered as base year for organisation.
The above graphical presentation reflects the changes in total assets and liabilities for
among the year 2015-2018. There is an increase of 9.40% recorded for the year 2016,
12.27increase for 2017 and then a huge decrease recorded in 2018 of 11.48%. the reason of this
difference is anticipated of repayment of long-term liabilities. the aggregate changes for 2015-
2018 was recorded as -3.83% (Crispim, 2018).
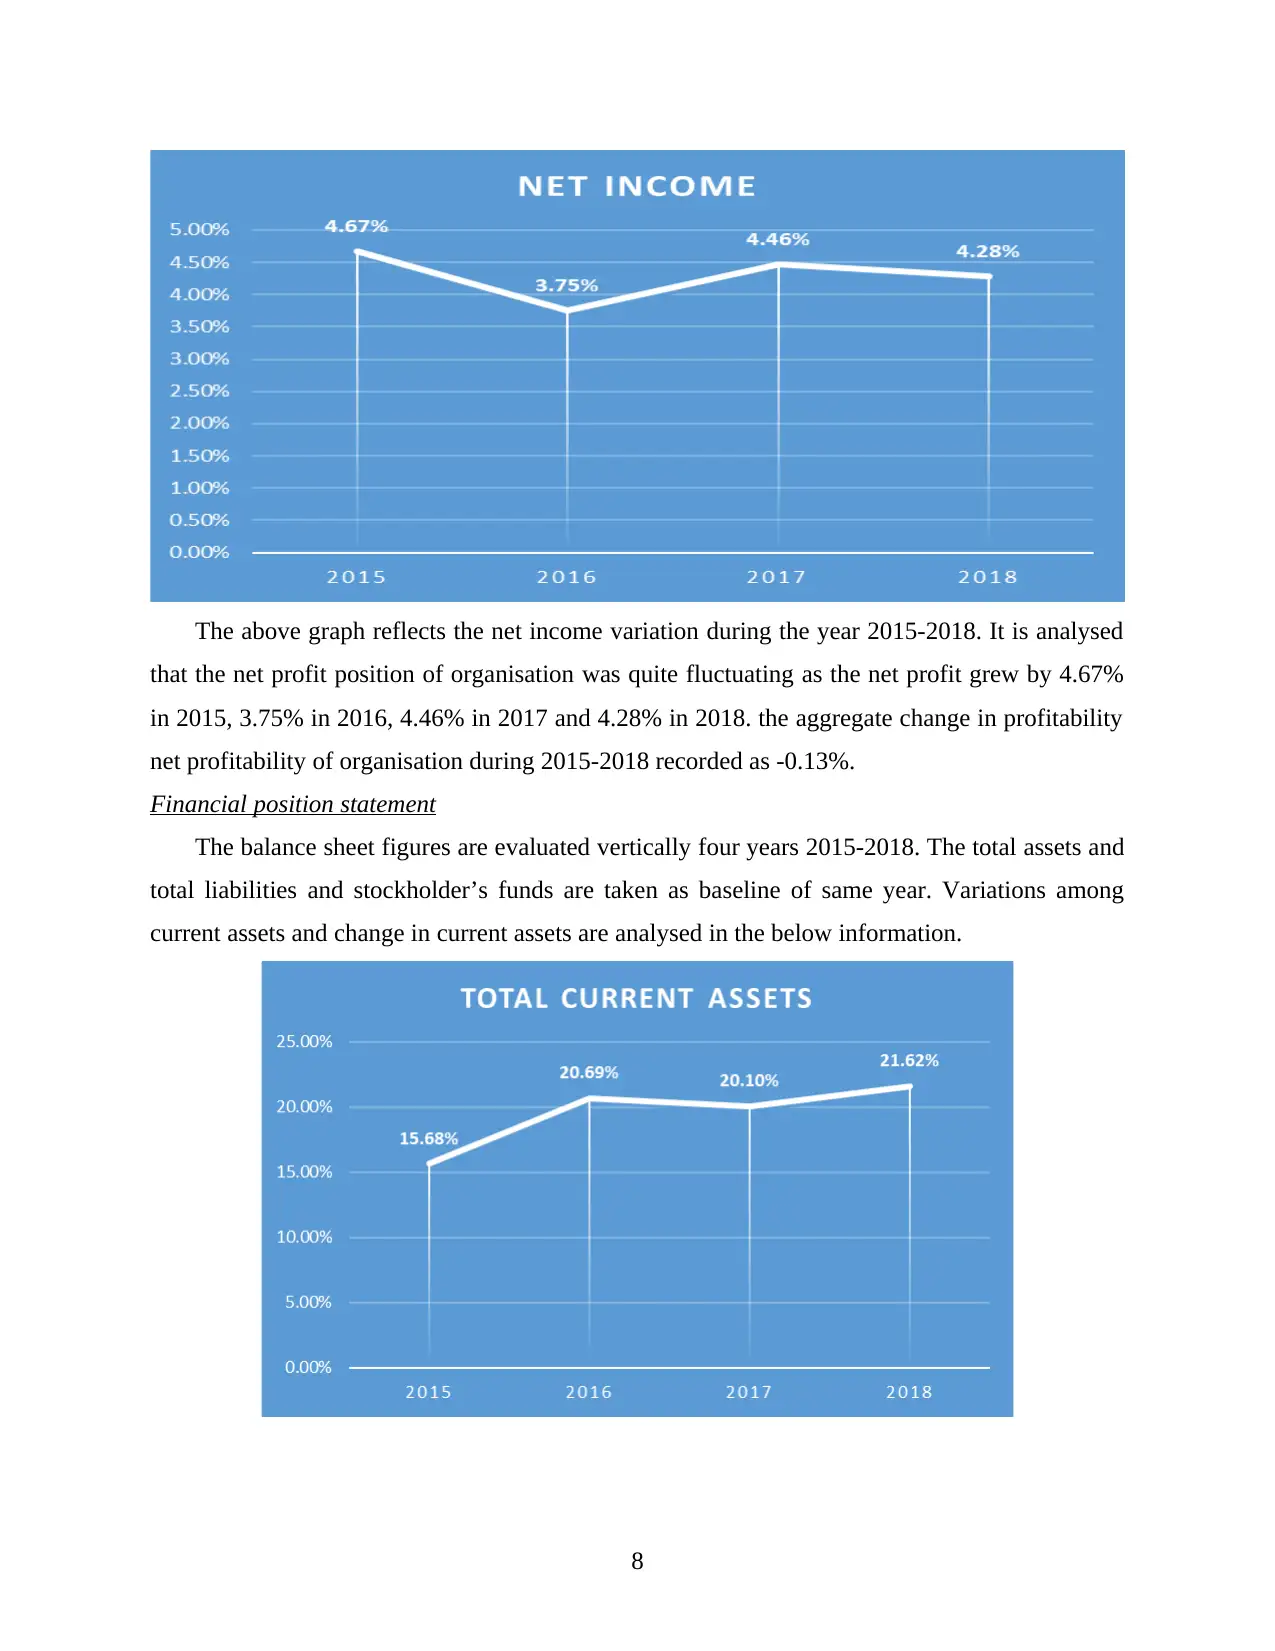
The above horizontal graphical presentation states the variations among the total
stockholder’s equity for four years from (2015-2018). The graphical presentation of
6
2018. Financial figures of 2015 is considered as base year for organisation.
The above graphical presentation reflects the changes in total assets and liabilities for
among the year 2015-2018. There is an increase of 9.40% recorded for the year 2016,
12.27increase for 2017 and then a huge decrease recorded in 2018 of 11.48%. the reason of this
difference is anticipated of repayment of long-term liabilities. the aggregate changes for 2015-
2018 was recorded as -3.83% (Crispim, 2018).
The above horizontal graphical presentation states the variations among the total
stockholder’s equity for four years from (2015-2018). The graphical presentation of
6
stockholder’s analysis clearly defines that equities and reserves increased for the year 2016 that
boosted the overall stockholder’s value by 9% for 2016, 12.84% for 2017. In 2018 there is a
huge deficiency recorded in terms of repayment of long term liability comparatively to 2017.
This led the organisation down by -21.14%. In aggregate total stockholder’s changed -7.05% for
four years.
Assessment of financial performance of Heineken
The Heineken financial performance is assessed by comparing the financial statements
vertically and horizontally. Main objective of this assessment is to calculate overall performance
and variations among the financial performance of Heineken. During four years (2015-2018).
Vertical analysis
Income statement
While calculating the variations among income statement of Heineken, gross profit and net
profit is taken in consideration.
The above graph presents the percentage change in gross profit of Heineken during the year
2015-2018. The increasing trend clearly states that net profit for the subsequent three years get
increased by 52.75%, 53.39%, 53.77% for 2015, 2016 and 2017. There is a downfall recorded
for the year 2018 due to having low profits. Gross profit only grows by 51.29% for the year
2018. The reason of low growth in gross profit for the year is recognised increase in cost of sales
for the year 2018.
7
⊘ This is a preview!⊘
Do you want full access?
Subscribe today to unlock all pages.
Trusted by 1+ million students worldwide
The above graph reflects the net income variation during the year 2015-2018. It is analysed
that the net profit position of organisation was quite fluctuating as the net profit grew by 4.67%
in 2015, 3.75% in 2016, 4.46% in 2017 and 4.28% in 2018. the aggregate change in profitability
net profitability of organisation during 2015-2018 recorded as -0.13%.
Financial position statement
The balance sheet figures are evaluated vertically four years 2015-2018. The total assets and
total liabilities and stockholder’s funds are taken as baseline of same year. Variations among
current assets and change in current assets are analysed in the below information.
8
Paraphrase This Document
Need a fresh take? Get an instant paraphrase of this document with our AI Paraphraser
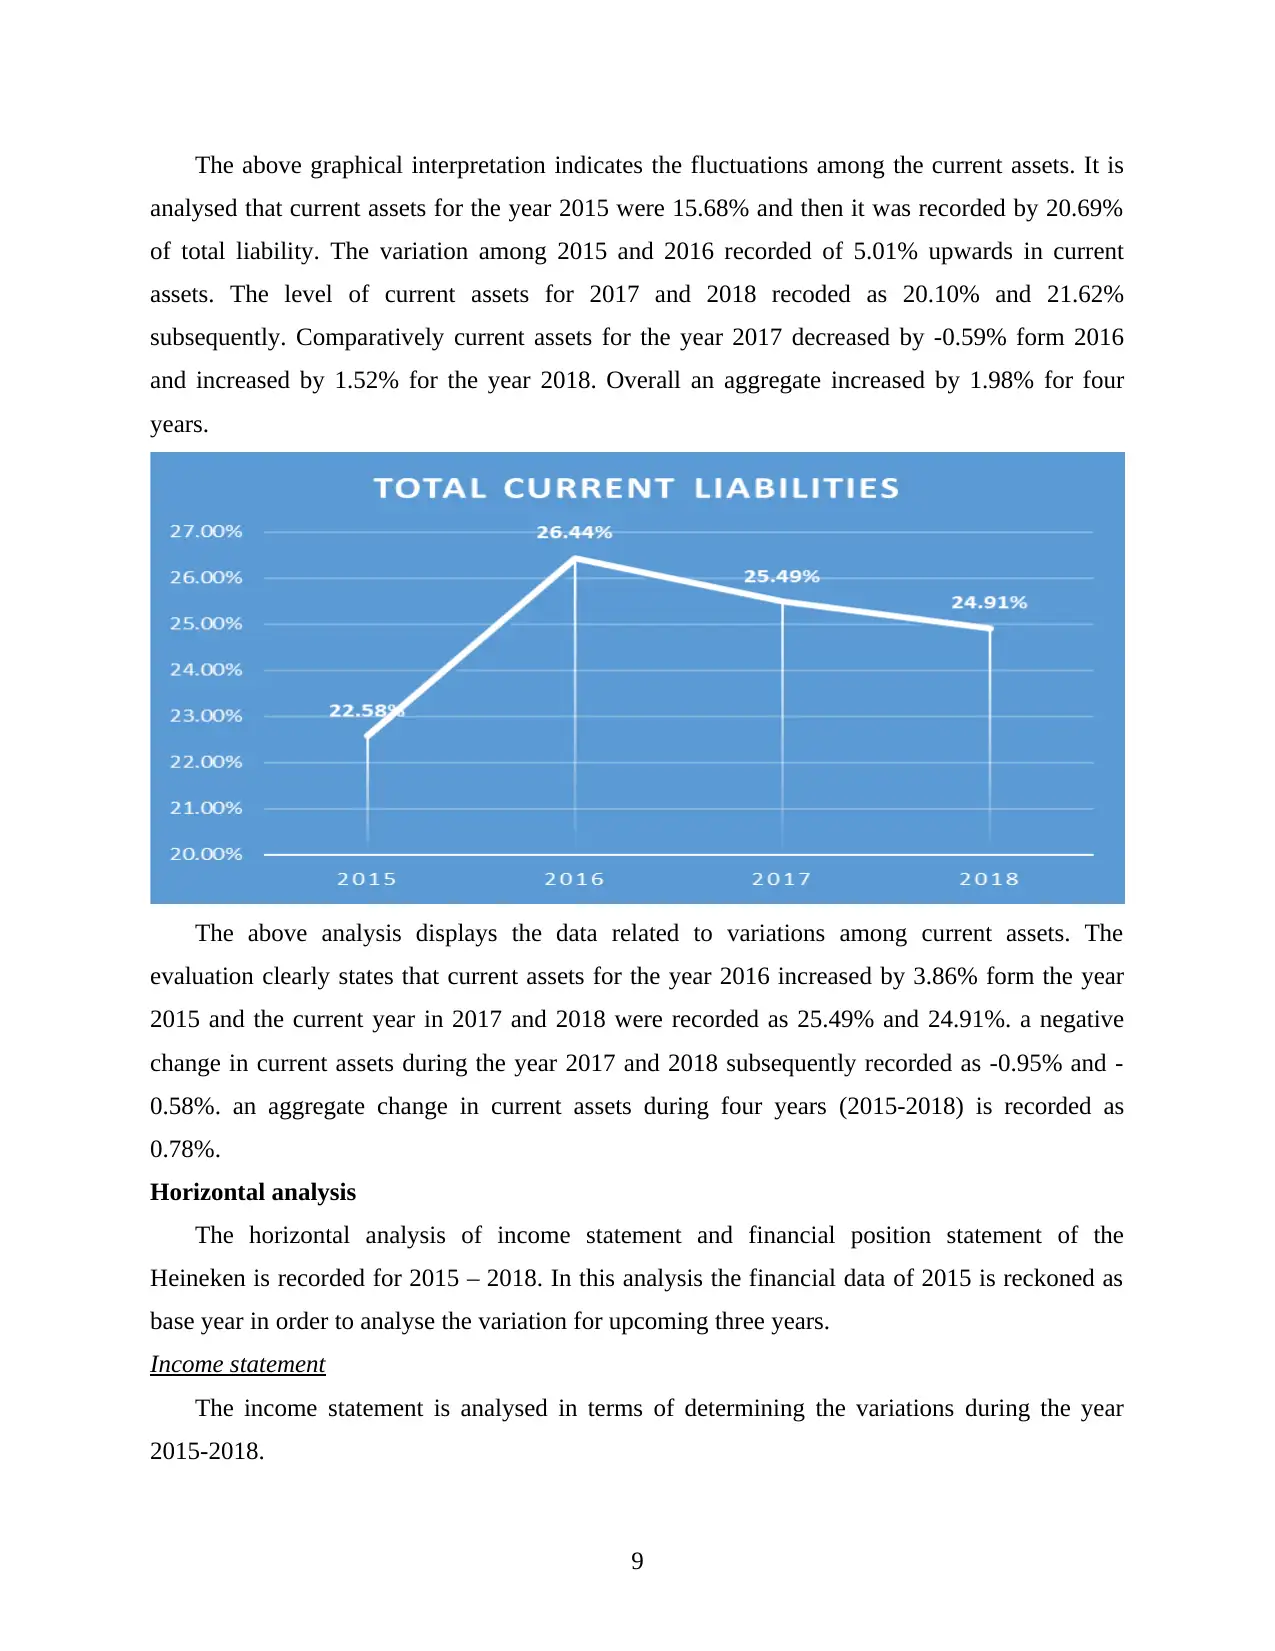
The above graphical interpretation indicates the fluctuations among the current assets. It is
analysed that current assets for the year 2015 were 15.68% and then it was recorded by 20.69%
of total liability. The variation among 2015 and 2016 recorded of 5.01% upwards in current
assets. The level of current assets for 2017 and 2018 recoded as 20.10% and 21.62%
subsequently. Comparatively current assets for the year 2017 decreased by -0.59% form 2016
and increased by 1.52% for the year 2018. Overall an aggregate increased by 1.98% for four
years.
The above analysis displays the data related to variations among current assets. The
evaluation clearly states that current assets for the year 2016 increased by 3.86% form the year
2015 and the current year in 2017 and 2018 were recorded as 25.49% and 24.91%. a negative
change in current assets during the year 2017 and 2018 subsequently recorded as -0.95% and -
0.58%. an aggregate change in current assets during four years (2015-2018) is recorded as
0.78%.
Horizontal analysis
The horizontal analysis of income statement and financial position statement of the
Heineken is recorded for 2015 – 2018. In this analysis the financial data of 2015 is reckoned as
base year in order to analyse the variation for upcoming three years.
Income statement
The income statement is analysed in terms of determining the variations during the year
2015-2018.
9
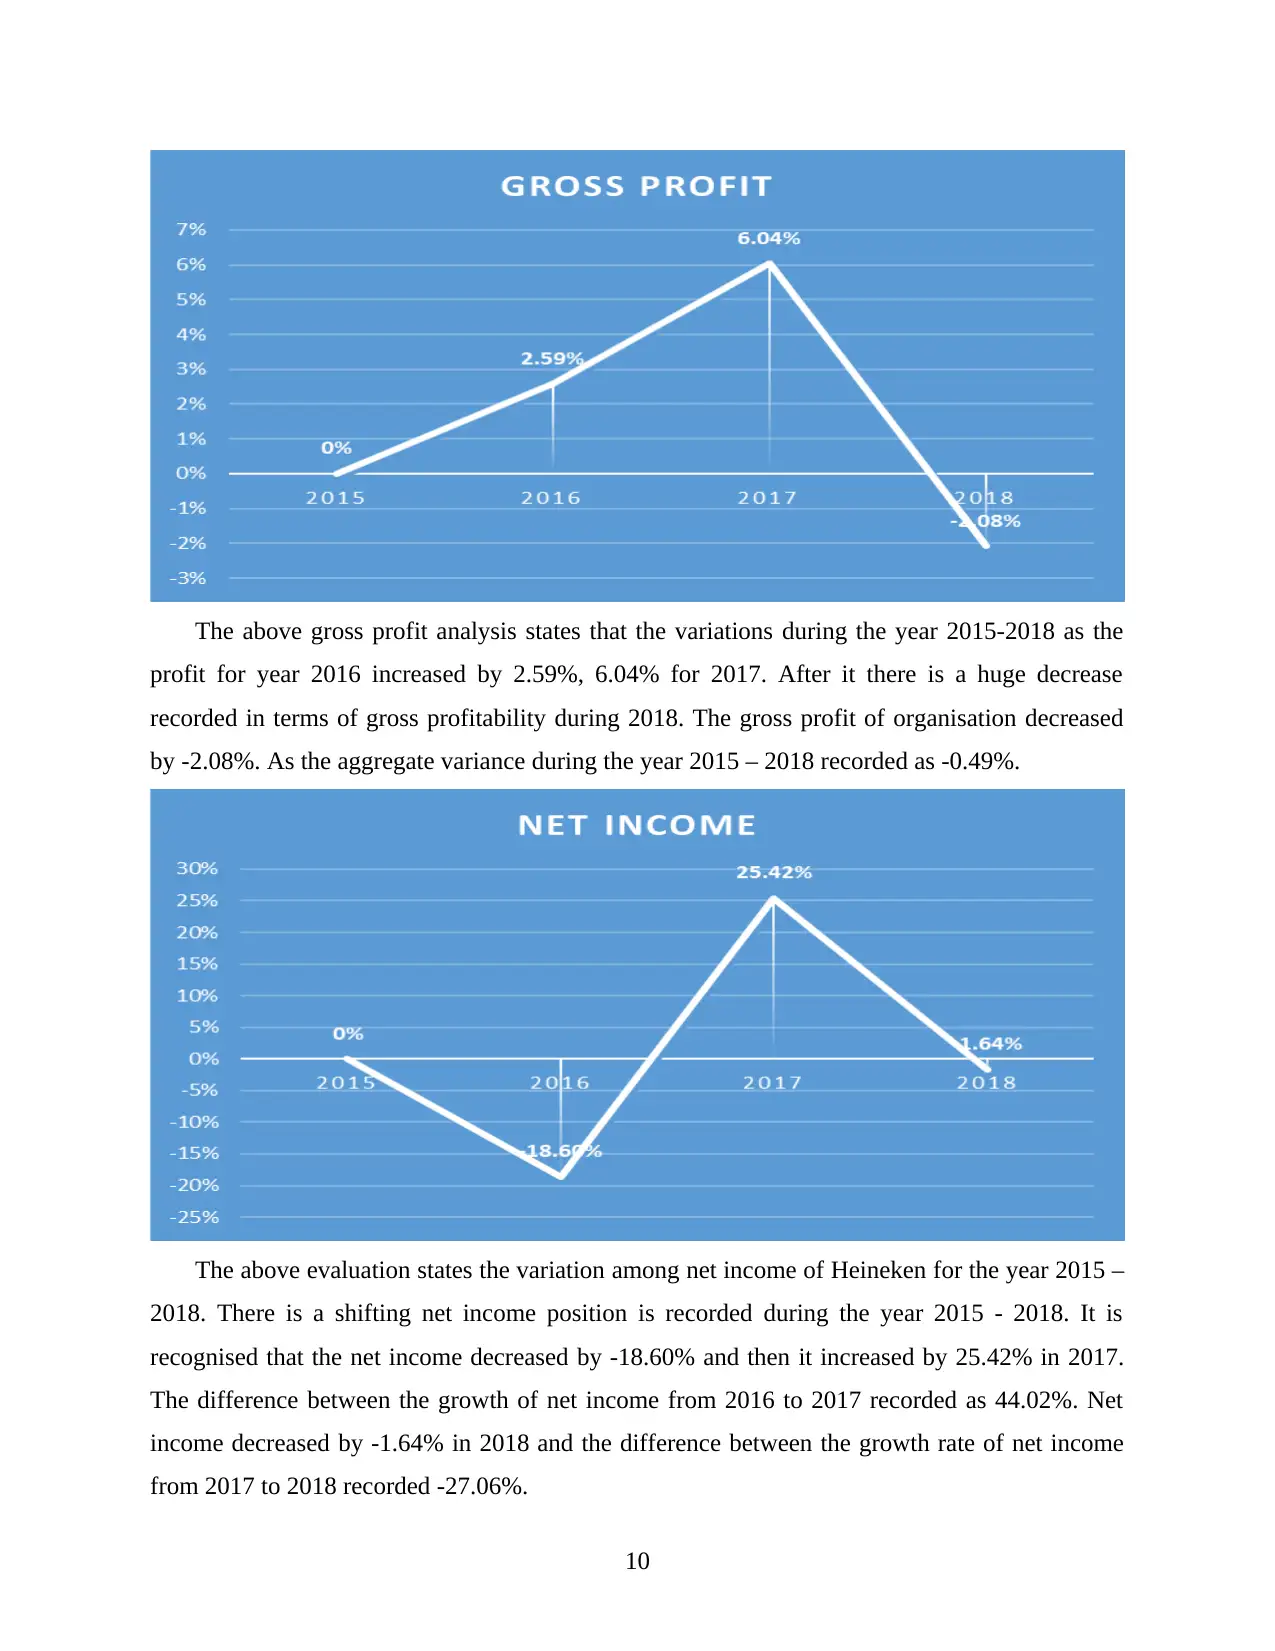
The above gross profit analysis states that the variations during the year 2015-2018 as the
profit for year 2016 increased by 2.59%, 6.04% for 2017. After it there is a huge decrease
recorded in terms of gross profitability during 2018. The gross profit of organisation decreased
by -2.08%. As the aggregate variance during the year 2015 – 2018 recorded as -0.49%.
The above evaluation states the variation among net income of Heineken for the year 2015 –
2018. There is a shifting net income position is recorded during the year 2015 - 2018. It is
recognised that the net income decreased by -18.60% and then it increased by 25.42% in 2017.
The difference between the growth of net income from 2016 to 2017 recorded as 44.02%. Net
income decreased by -1.64% in 2018 and the difference between the growth rate of net income
from 2017 to 2018 recorded -27.06%.
10
⊘ This is a preview!⊘
Do you want full access?
Subscribe today to unlock all pages.
Trusted by 1+ million students worldwide
1 out of 18
Related Documents


Your All-in-One AI-Powered Toolkit for Academic Success.
+13062052269
info@desklib.com
Available 24*7 on WhatsApp / Email
![[object Object]](/_next/static/media/star-bottom.7253800d.svg)
Unlock your academic potential
Copyright © 2020–2026 A2Z Services. All Rights Reserved. Developed and managed by ZUCOL.