Comprehensive Financial Analysis of Flight Centre Travel Group (FCTG)
VerifiedAdded on 2021/04/22
|22
|3926
|25
Report
AI Summary
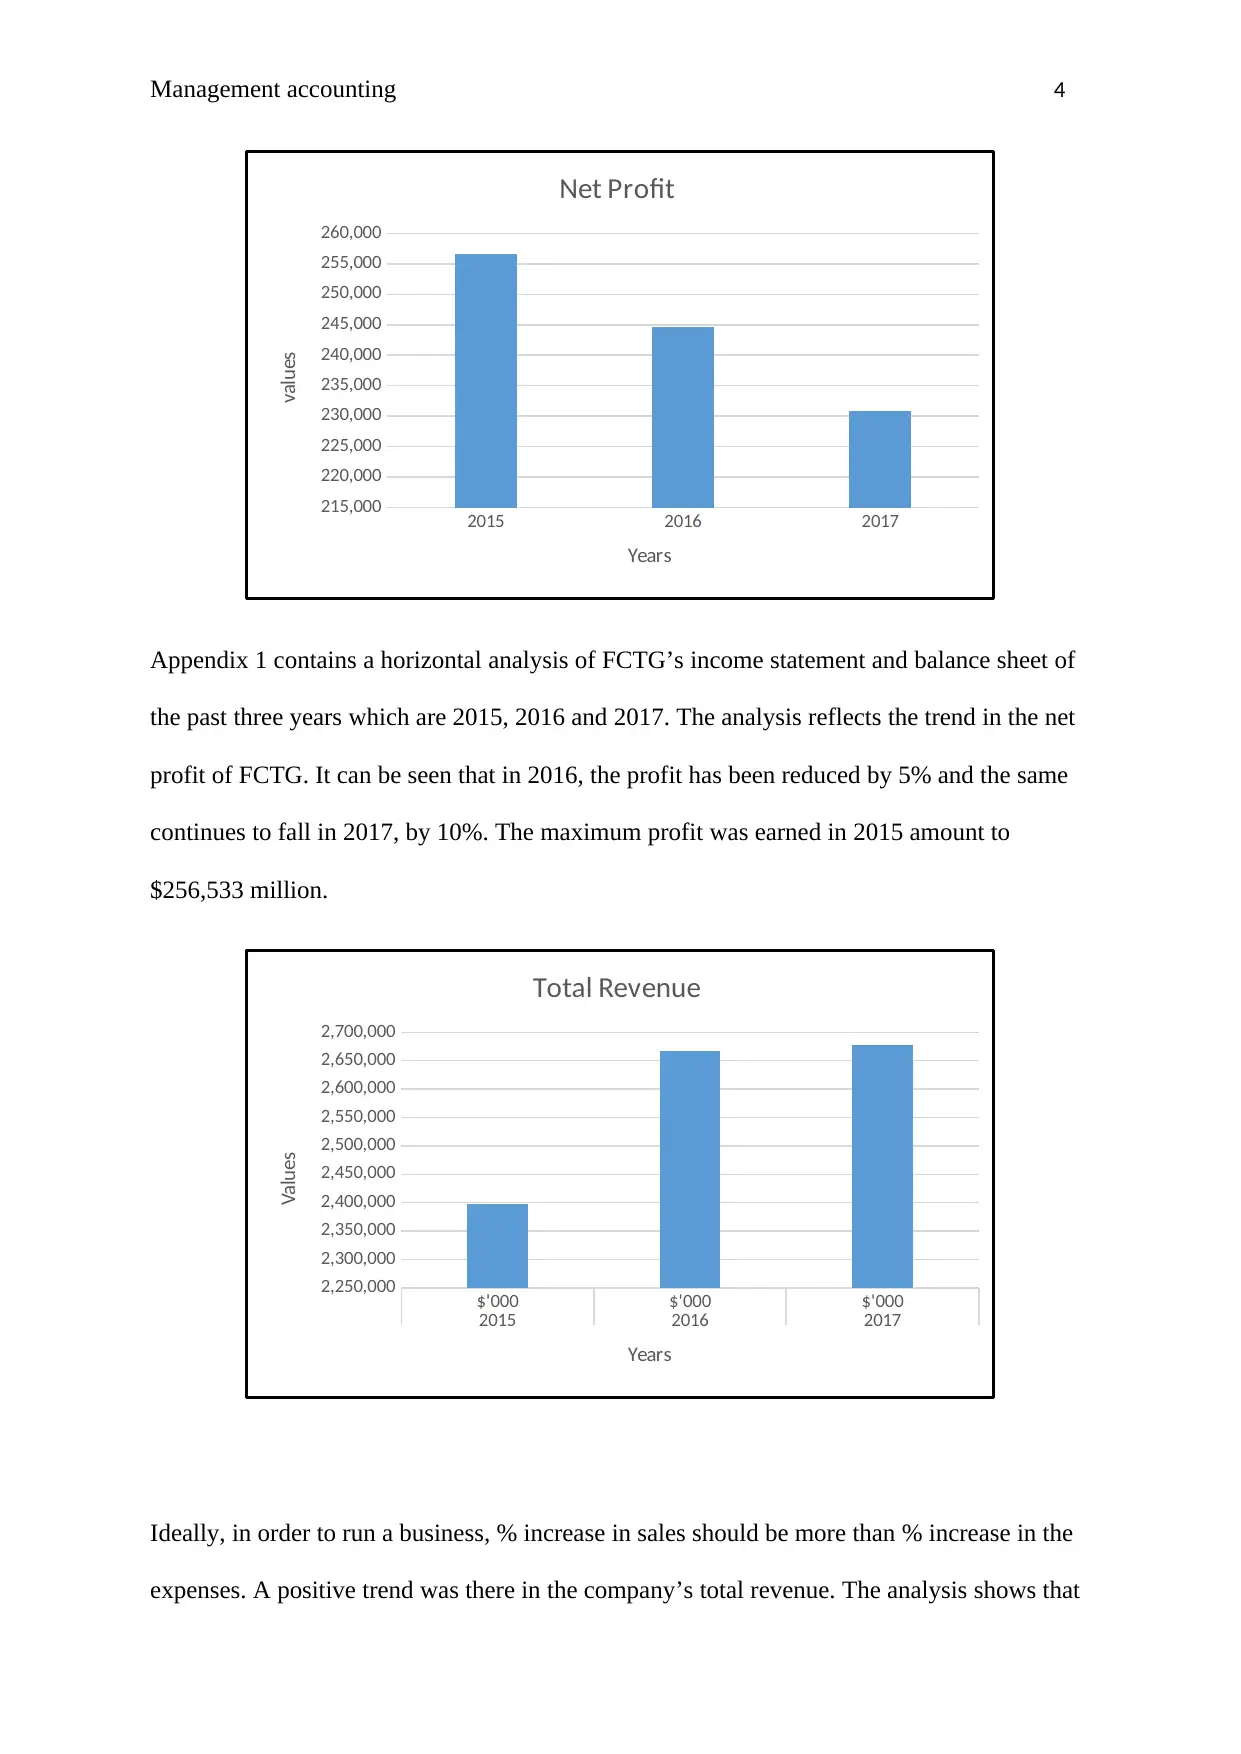
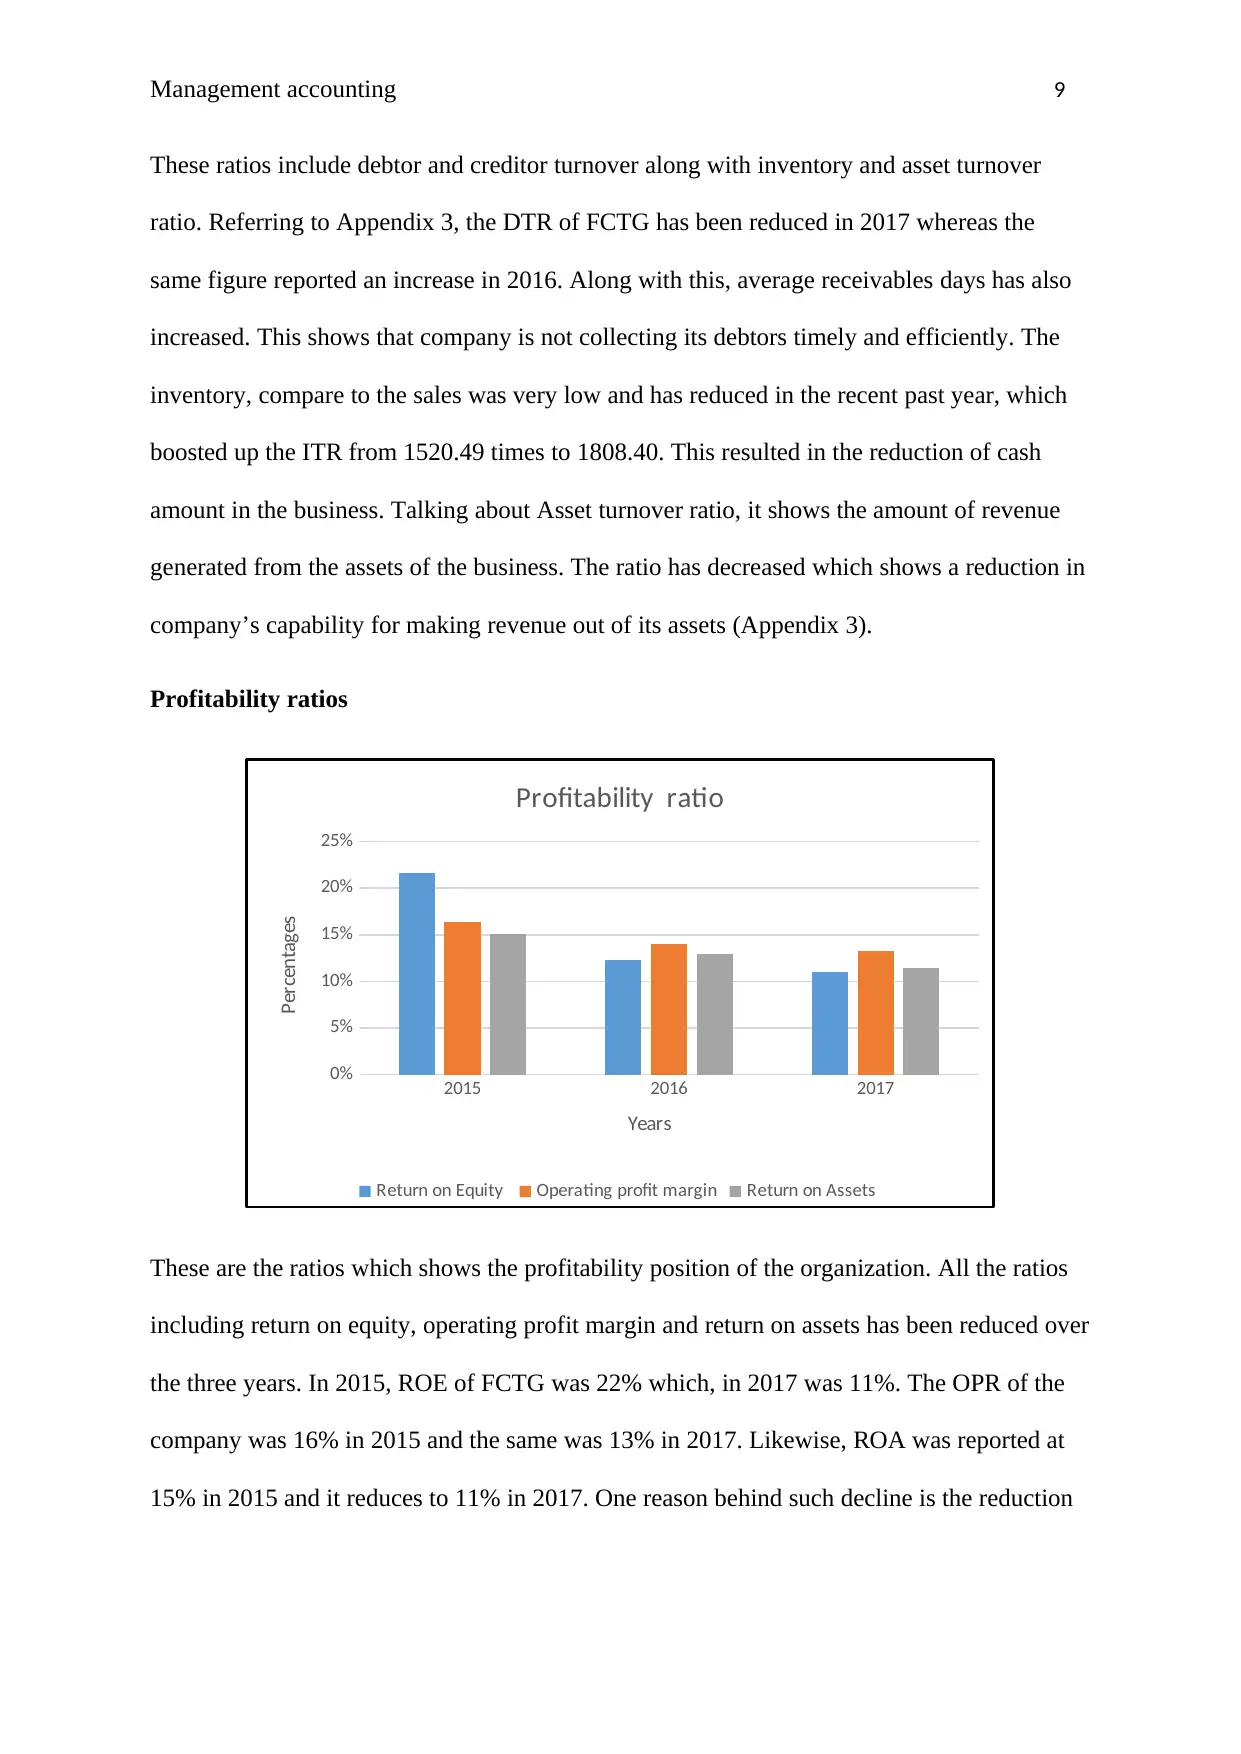
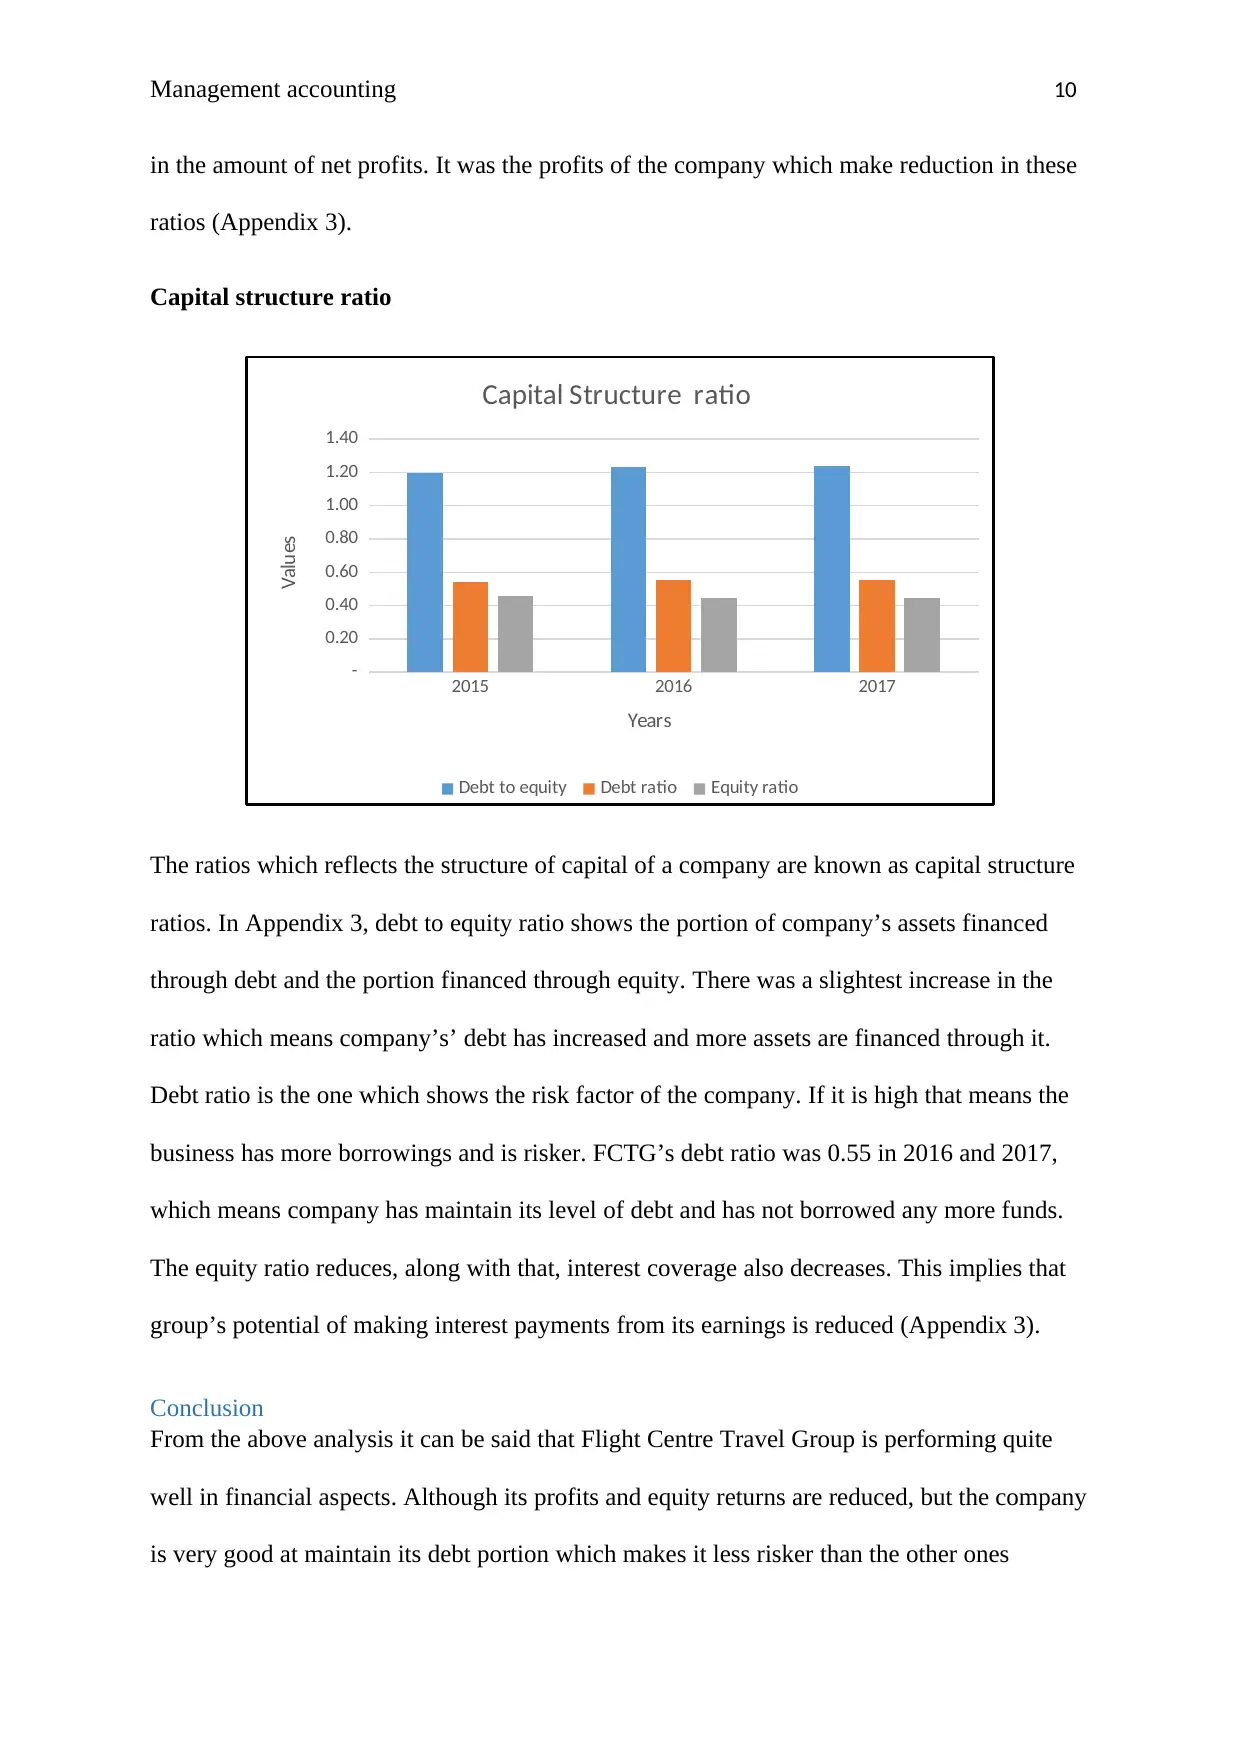
This report presents a comprehensive financial analysis of Flight Centre Travel Group (FCTG), a major travel agency in Australia, examining its performance over three years (2015-2017). The analysis begins with an executive summary and an introduction to FCTG's business operations and market position. The report then delves into the financial statements, employing both horizontal and vertical analysis to assess trends and relationships within the income statement and balance sheet. Horizontal analysis reveals year-over-year changes in financial statement items, highlighting revenue growth, expense fluctuations, and profit trends. Vertical analysis expresses each item as a percentage of a base figure, providing insights into the relative size and composition of financial statement components. The analysis also incorporates a detailed ratio analysis, covering liquidity, efficiency, profitability, and capital structure ratios. Liquidity ratios such as current and quick ratios, and cash ratios are examined to assess the company's short-term solvency. Efficiency ratios, including debtor turnover and inventory turnover, are evaluated to gauge how efficiently the company utilizes its assets. Profitability ratios such as return on equity, operating profit margin, and return on assets are analyzed to measure the company's financial performance. Capital structure ratios, including debt-to-equity and debt ratios, are used to assess the company's leverage and financial risk. The report concludes with a summary of key findings, including the company's financial strengths and weaknesses, and includes appendices containing supporting financial data and calculations. The analysis indicates FCTG is performing well, although profitability and equity returns have declined, the company effectively manages its debt, positioning it as a less risky investment.

RUNNING HEAD: MANAGEMENT ACCOUNTING
Financial statement analysis
Paraphrase This Document
Need a fresh take? Get an instant paraphrase of this document with our AI Paraphraser

Management accounting 1
Executive summary
Flight Centre Travel Group is one of the largest retail travel outlet operating in Australia. The
company functions in travel industry and has its headquarters situated in Brisbane and
Queensland. The report contains a whole financial analysis of the company of the past three
years. The first and second part of the report deals with horizontal and vertical analysis of the
FCTG’s financial statements. It reflects the percentage change occurred in each and every
item of the statement. The third part contains a ratio analysis of the company which includes
calculation of liquidity, profitability, efficiency and capital structure ratios. All these ratios
shows the position and performance of the company over the period of three years. The report
ended with a conclusion showing the findings of the analysis performed, along with
appendices.

Management accounting 2
Contents
Introduction...........................................................................................................................................3
Analysis of financial statements............................................................................................................3
Horizontal analysis............................................................................................................................3
Vertical analysis................................................................................................................................6
Ratio Analysis...................................................................................................................................7
Conclusion...........................................................................................................................................10
Bibliography........................................................................................................................................12
Appendices..........................................................................................................................................13
Appendix 1......................................................................................................................................13
Appendix 2......................................................................................................................................15
Appendix 3......................................................................................................................................18
Appendix 4......................................................................................................................................18
⊘ This is a preview!⊘
Do you want full access?
Subscribe today to unlock all pages.

Trusted by 1+ million students worldwide

Management accounting 3
Introduction
Flight Centre is a leading travel agency group in Australia. The company started its business
in 1980s and has earned a remarkable growth to become a $20 billion business. It has more
than 40 brands and operates in 23 countries along with a travel management network which is
spread across more than 90 countries. The group is listed on Australian Securities Exchange
with a ticker ASX: FLT. FCTG has approx. 2800 shops, more than 20000 employees,
operates under various retail and corporate brands and has fully owned operations in
countries like Australia, New Zealand, Singapore, Hong Kong and many more. The vision
and mission of the group is to create a specialized brand that facilitates the company to
capture and grow ley market segments. The current market price of its share is AUD$ 54.32
(Flight Centre Travel Group 2018).
Analysis of financial statements
Horizontal analysis
It is one of the tool used for measuring the changes in the items of final accounts over past
years. It computes year to year change in the items and represent it in form of dollars and
percentage. The calculation is performed by taking one year as a base and then the change is
been estimated for the corresponding year. In other words, analysis reflect the increase or
decrease in the items of the statement (Weygandt, Kimmel and Kieso, 2009).
Paraphrase This Document
Need a fresh take? Get an instant paraphrase of this document with our AI Paraphraser

Management accounting 4
2015 2016 2017
215,000
220,000
225,000
230,000
235,000
240,000
245,000
250,000
255,000
260,000
Net Profit
Years
values
Appendix 1 contains a horizontal analysis of FCTG’s income statement and balance sheet of
the past three years which are 2015, 2016 and 2017. The analysis reflects the trend in the net
profit of FCTG. It can be seen that in 2016, the profit has been reduced by 5% and the same
continues to fall in 2017, by 10%. The maximum profit was earned in 2015 amount to
$256,533 million.
$'000 $'000 $'000
2015 2016 2017
2,250,000
2,300,000
2,350,000
2,400,000
2,450,000
2,500,000
2,550,000
2,600,000
2,650,000
2,700,000
Total Revenue
Years
Values
Ideally, in order to run a business, % increase in sales should be more than % increase in the
expenses. A positive trend was there in the company’s total revenue. The analysis shows that
2015 2016 2017
215,000
220,000
225,000
230,000
235,000
240,000
245,000
250,000
255,000
260,000
Net Profit
Years
values
Appendix 1 contains a horizontal analysis of FCTG’s income statement and balance sheet of
the past three years which are 2015, 2016 and 2017. The analysis reflects the trend in the net
profit of FCTG. It can be seen that in 2016, the profit has been reduced by 5% and the same
continues to fall in 2017, by 10%. The maximum profit was earned in 2015 amount to
$256,533 million.
$'000 $'000 $'000
2015 2016 2017
2,250,000
2,300,000
2,350,000
2,400,000
2,450,000
2,500,000
2,550,000
2,600,000
2,650,000
2,700,000
Total Revenue
Years
Values
Ideally, in order to run a business, % increase in sales should be more than % increase in the
expenses. A positive trend was there in the company’s total revenue. The analysis shows that

Management accounting 5
there was an increase in the total revenue by 1%. In 2016, revenue increased by 11% and in
2017, the same rises by 12% as compare to the revenue of 2015. Another item reported in the
income statement was ‘other income’, which was highest in 2016 amounted to $12,691 and
shown an increase of 102%. The same was reduced by 68% in 2017 (Appendix 1).
Talking about the expenses of the company, its sales and marketing expenses has reduced in
2017 by 11%, when compare to 2015. The same figure was rose by 24% in year 2016.
Employee benefits and rental expenses shows a minor increase whereas a 17% and 10%
increase was notice in depreciation and other expenses respectively. Along with this, income
tax expenditure of the company has also risen by 14% in 2017 as compare to that of in 2015.
Due to such upsurge in the expenses, company has reducing trend in its net profits.
Referring to Appendix 1, the horizontal analysis of FCTG’s balance sheet shows percentage
increase or decrease in each of its items.
$'000 $'000 $'000
2015 2016 2017
0
500,000
1,000,000
1,500,000
2,000,000
2,500,000
3,000,000
3,500,000
Total Assets, liabilities, and equities
TOTAL ASSETS TOTAL LIABILITIES TOTAL EQUITY
Years
$'000
It is observed that, company’s total assets has increased by 8% and 15% in year 2016 and
2017 respectively. The reason behind such rise is the huge upsurge in FCTG’s property plant
and equipment by 31% in 2017. Under the head, non-current assets, the amount of its
⊘ This is a preview!⊘
Do you want full access?
Subscribe today to unlock all pages.

Trusted by 1+ million students worldwide

Management accounting 6
property and plant was $256,196 million and the same in 2015 was $196,300 million. A huge
increase in the investments and other financial assets has also been noticed in the analysis.
Along with total assets, the total liabilities of the company has also risen in past three years,
but comparatively less than total assets. An upsurge of 12% in them was there in 2017. The
short term borrowings of the company reported an increase of 134% in 2016 and a reduction
of 70% in the next year. Accounts payable and the provisions has also risen over the past
three years. Under head, Non-current Liabilities, deferred tax liabilities and accounts payable
has risen to a great extent. They reported an upsurge of 8679% and 250% respectively in year
2017, as compare to year 2015 (Appendix 1).
As far as, company’s equity is concerned, same percentage increase was there as of total
liabilities. The retained earnings rises by 10% and 21% in 2016 and 2017 respectively. Along
with, 1% increase was there in group’s contributed earnings but the reserves reported a
decrease of 65% in 2017 (Appendix 1).
Vertical analysis
It is another method used for financial statement analysis which involves the measurement of
the relationship between various items of the statements. On income statement, each item is
presented as a percentage of total sales or revenue and on balance sheet, the same is shows as
a percentage of total assets and liabilities (Godwin and Alderman, 2012).
Appendix 2 covers vertical analysis of FCTG’s statement of profit and loss and statement of
financial position for the past years 2015, 2016 and 2017. Looking at the analysis of income
statement, it is observed that net profit of the company was 8.62% of the total sales in 2017.
In 2015, the same figure was 10.70% of the total revenue. This implies that the net profit has
been reduced over the years. In addition to this, group’s EBIT has also decreased in term of
percentage. The figure was 16.37% of total sales in 2015 and was reduced to 13.22% of the
sales in year 2017. Among all the expenses, employee benefits has highest percentage of
Paraphrase This Document
Need a fresh take? Get an instant paraphrase of this document with our AI Paraphraser

Management accounting 7
sales which was 54.20% in 2017 and 53.55% in 2015. Expenditures like finance costs and
depreciation form a minor part of the total sales in the three years.
The analysis of the group’s balance sheet shows that the current asset of the company are
77% of its total asset in 2015 and the number reduces to 73% in 2017. The reverse trend was
noticed in the non-current assets of FCTG, as in 2015 they were 23% of total assets and in
2017, the number increased to 27%. Cash in 2017, represents 40% of the total assets which
was 49% and 44% in 2015 and 2016 respectively. Talking about the liabilities, current
liabilities of the firm were more than its non-current liabilities. They form a major part of the
company’s total liabilities, though reduced in the span of three years. In 2015, current
liabilities were 96% of total liabilities and the remaining portion was denoted by non-current
liabilities. The same figure decreases to 93% in 2017, which increases the portion of non-
current liabilities to 7% of total liabilities. The reason behind such huge difference is the
accounts payable of the company reported under the head ‘Current Liabilities’, which has
been increased during the last three years. They contribute 86% of company’s total liabilities
in both years 2016 and 2017. However, the same figure was 65% in 2015. Talking about the
equity of the company, retained earnings has the major portion of 71% of total equity and
contributed equity has a portion of 28% in 2017. The percentage of retained profits has been
increased over the years, which maintains the financial position of the group (Appendix 2).
Ratio Analysis
It is the most common method or technique used for measuring a company’s financial
performance. By calculating various categorized ratio, one can clearly have an idea about the
performance and position of the organization in the market. Appendix 3 contains a ratio
analysis of Flight Centre’s financial accounts which shows its performance in the past three
years (Bragg, 2012).
Liquidity ratios

Management accounting 8
2015 2016 2017
-
0.20
0.40
0.60
0.80
1.00
1.20
1.40
1.60
Liquidity Ratios
Current ratio Quick ratio Cash Ratio Cash flow to sales
Years
Values
From the above graph and the analysis in Appendix 3, it is seen that the current ratio and
quick ratio of the company are almost same and both have reduced in the span of 3 years.
Though, the current ratio is less than the ideal ratio of 2:1 and but still FCTG has enough
current assets to pay off its current liabilities. Similarly, the quick ratio is more than its ideal
ratio of 1:1 which is favourable for the company. Cash ratio has been reduced because of the
decrease in amount of cash. Similarly, the cash flow from operating activities has also
decreased in 2017 which resulted in the reduced ratio of 0.11 in same year (Appendix 3).
Efficiency ratios
2015 2016 2017
-
0.50
1.00
1.50
2.00
2.50
3.00
3.50
4.00
4.50
Efficiency ratios
Receivable tunover ratio Assets turnover ratio
Years
Values
2015 2016 2017
-
0.20
0.40
0.60
0.80
1.00
1.20
1.40
1.60
Liquidity Ratios
Current ratio Quick ratio Cash Ratio Cash flow to sales
Years
Values
From the above graph and the analysis in Appendix 3, it is seen that the current ratio and
quick ratio of the company are almost same and both have reduced in the span of 3 years.
Though, the current ratio is less than the ideal ratio of 2:1 and but still FCTG has enough
current assets to pay off its current liabilities. Similarly, the quick ratio is more than its ideal
ratio of 1:1 which is favourable for the company. Cash ratio has been reduced because of the
decrease in amount of cash. Similarly, the cash flow from operating activities has also
decreased in 2017 which resulted in the reduced ratio of 0.11 in same year (Appendix 3).
Efficiency ratios
2015 2016 2017
-
0.50
1.00
1.50
2.00
2.50
3.00
3.50
4.00
4.50
Efficiency ratios
Receivable tunover ratio Assets turnover ratio
Years
Values
⊘ This is a preview!⊘
Do you want full access?
Subscribe today to unlock all pages.

Trusted by 1+ million students worldwide

Management accounting 9
These ratios include debtor and creditor turnover along with inventory and asset turnover
ratio. Referring to Appendix 3, the DTR of FCTG has been reduced in 2017 whereas the
same figure reported an increase in 2016. Along with this, average receivables days has also
increased. This shows that company is not collecting its debtors timely and efficiently. The
inventory, compare to the sales was very low and has reduced in the recent past year, which
boosted up the ITR from 1520.49 times to 1808.40. This resulted in the reduction of cash
amount in the business. Talking about Asset turnover ratio, it shows the amount of revenue
generated from the assets of the business. The ratio has decreased which shows a reduction in
company’s capability for making revenue out of its assets (Appendix 3).
Profitability ratios
2015 2016 2017
0%
5%
10%
15%
20%
25%
Profitability ratio
Return on Equity Operating profit margin Return on Assets
Years
Percentages
These are the ratios which shows the profitability position of the organization. All the ratios
including return on equity, operating profit margin and return on assets has been reduced over
the three years. In 2015, ROE of FCTG was 22% which, in 2017 was 11%. The OPR of the
company was 16% in 2015 and the same was 13% in 2017. Likewise, ROA was reported at
15% in 2015 and it reduces to 11% in 2017. One reason behind such decline is the reduction
Paraphrase This Document
Need a fresh take? Get an instant paraphrase of this document with our AI Paraphraser

Management accounting 10
in the amount of net profits. It was the profits of the company which make reduction in these
ratios (Appendix 3).
Capital structure ratio
2015 2016 2017
-
0.20
0.40
0.60
0.80
1.00
1.20
1.40
Capital Structure ratio
Debt to equity Debt ratio Equity ratio
Years
Values
The ratios which reflects the structure of capital of a company are known as capital structure
ratios. In Appendix 3, debt to equity ratio shows the portion of company’s assets financed
through debt and the portion financed through equity. There was a slightest increase in the
ratio which means company’s’ debt has increased and more assets are financed through it.
Debt ratio is the one which shows the risk factor of the company. If it is high that means the
business has more borrowings and is risker. FCTG’s debt ratio was 0.55 in 2016 and 2017,
which means company has maintain its level of debt and has not borrowed any more funds.
The equity ratio reduces, along with that, interest coverage also decreases. This implies that
group’s potential of making interest payments from its earnings is reduced (Appendix 3).
Conclusion
From the above analysis it can be said that Flight Centre Travel Group is performing quite
well in financial aspects. Although its profits and equity returns are reduced, but the company
is very good at maintain its debt portion which makes it less risker than the other ones

Management accounting 11
operating in the same industry. From horizontal analysis, it is observed that its total revenue
has increased along with the share of profit. Increase in investment and reduction in short
term borrowings is also there.
Vertical analysis shows that major part of company’s liabilities is been taken by its net assets.
This implies that it has enough assets to pay off its liabilities. Also the retained earnings has
increased and form a major part of company’s equity.
Lastly, the result of ratio analysis shows that FCTG has strong position of liquidity but its
position of profitability is slightly weak. In addition to this, its efficiency has also reduced.
But on a whole, FCTG has performed well and shown positive results in past three years.
⊘ This is a preview!⊘
Do you want full access?
Subscribe today to unlock all pages.

Trusted by 1+ million students worldwide
1 out of 22
Related Documents

Your All-in-One AI-Powered Toolkit for Academic Success.
+13062052269
info@desklib.com
Available 24*7 on WhatsApp / Email
Unlock your academic potential
Copyright © 2020–2025 A2Z Services. All Rights Reserved. Developed and managed by ZUCOL.