Analyzing FedEx and UPS: A Finance Case Study on Financial Performance
VerifiedAdded on 2022/08/09
|17
|4559
|22
Case Study
AI Summary
This case study conducts a financial statement analysis of FedEx and UPS, two leading logistics companies, examining data from 2017 and 2018. It utilizes financial ratios such as liquidity, efficiency, gearing, profitability, and market ratios to compare their business strategies. The analysis includes an overview of each company's structure, risk elements, and competitive advantages. The report delves into ratio analysis, including current, quick, and working capital ratios for liquidity; accounts receivable turnover, total asset turnover, and days to sell inventory for efficiency; and the average collection period. The study aims to determine which company demonstrates superior financial performance and strategic effectiveness based on the financial data presented. The financial analysis will highlight the competitive advantages and disadvantages of each company.
Running head: CASES IN FINANCE
Cases in finance
Name of the student
Name of the university
Authors note
Cases in finance
Name of the student
Name of the university
Authors note
Paraphrase This Document
Need a fresh take? Get an instant paraphrase of this document with our AI Paraphraser
1
CASES IN FINANCE
Executive Summary
The project aims at conducting a financial statement analysis by examining various data
presented by the two companies, which are FedEx and UPS. The report covers the data
concerning two different years which are 2017 and 2018. Both the companies are considered as
global leaders in the industry providing services related to the logistics. Any financial analysis is
incomplete without using the advantages of the different financial ratio which are liquidity ratio,
efficiency ratio, gearing ratio, profitability ratio and market or valuation ratio. United Parcel
Services and Federal Express are included in the North America Industry Classification System
(NAIC) list and the code is 492110. The project concludes which of the two companies is better
than the other in their business strategies by looking at the financials of the companies.
2
CASES IN FINANCE
Table of Contents
Introduction......................................................................................................................................3
Discussion........................................................................................................................................3
About FedEx Corporation............................................................................................................3
About United Parcel Service, Inc................................................................................................4
Comparison of business structure................................................................................................4
Elements of Risk for both the companies....................................................................................5
Ratio Analysis..............................................................................................................................6
Conclusion.....................................................................................................................................13
References......................................................................................................................................14
⊘ This is a preview!⊘
Do you want full access?
Subscribe today to unlock all pages.
Trusted by 1+ million students worldwide
3
CASES IN FINANCE
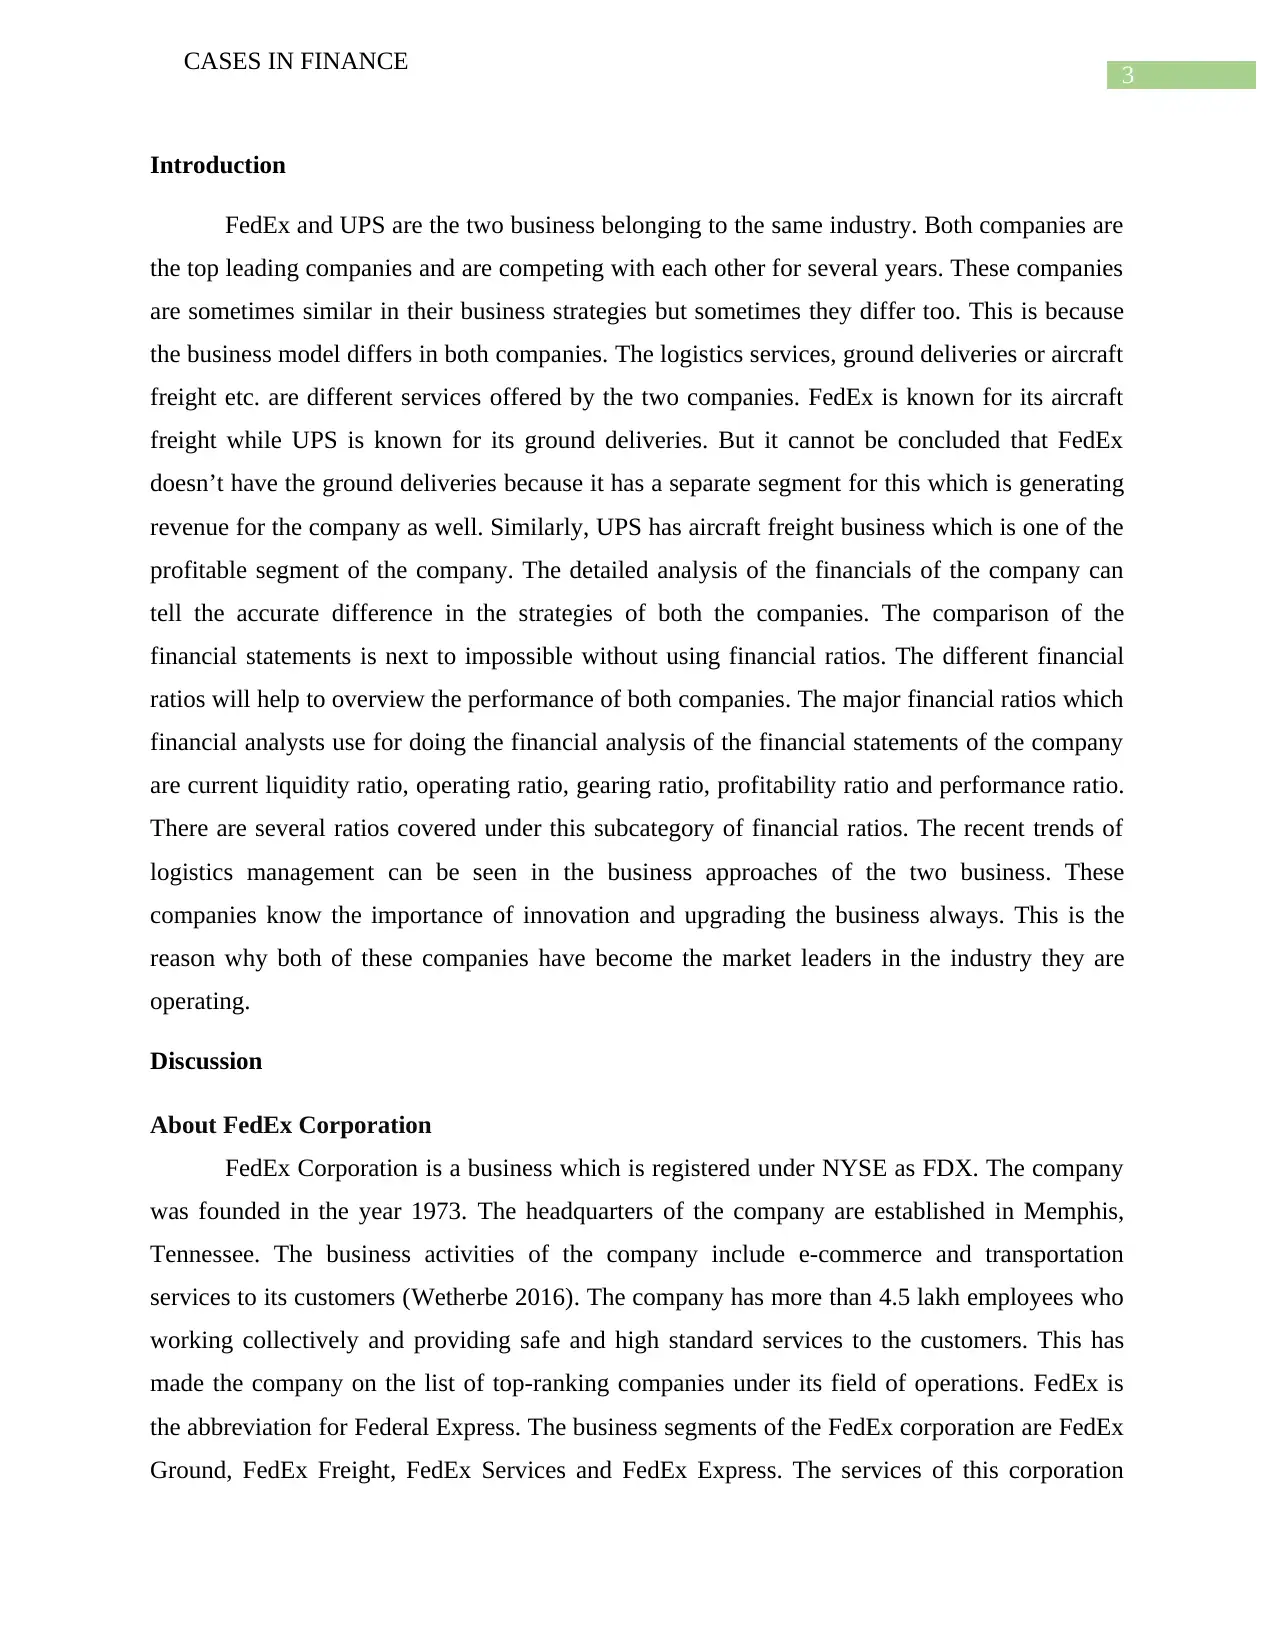
Introduction
FedEx and UPS are the two business belonging to the same industry. Both companies are
the top leading companies and are competing with each other for several years. These companies
are sometimes similar in their business strategies but sometimes they differ too. This is because
the business model differs in both companies. The logistics services, ground deliveries or aircraft
freight etc. are different services offered by the two companies. FedEx is known for its aircraft
freight while UPS is known for its ground deliveries. But it cannot be concluded that FedEx
doesn’t have the ground deliveries because it has a separate segment for this which is generating
revenue for the company as well. Similarly, UPS has aircraft freight business which is one of the
profitable segment of the company. The detailed analysis of the financials of the company can
tell the accurate difference in the strategies of both the companies. The comparison of the
financial statements is next to impossible without using financial ratios. The different financial
ratios will help to overview the performance of both companies. The major financial ratios which
financial analysts use for doing the financial analysis of the financial statements of the company
are current liquidity ratio, operating ratio, gearing ratio, profitability ratio and performance ratio.
There are several ratios covered under this subcategory of financial ratios. The recent trends of
logistics management can be seen in the business approaches of the two business. These
companies know the importance of innovation and upgrading the business always. This is the
reason why both of these companies have become the market leaders in the industry they are
operating.
Discussion
About FedEx Corporation
FedEx Corporation is a business which is registered under NYSE as FDX. The company
was founded in the year 1973. The headquarters of the company are established in Memphis,
Tennessee. The business activities of the company include e-commerce and transportation
services to its customers (Wetherbe 2016). The company has more than 4.5 lakh employees who
working collectively and providing safe and high standard services to the customers. This has
made the company on the list of top-ranking companies under its field of operations. FedEx is
the abbreviation for Federal Express. The business segments of the FedEx corporation are FedEx
Ground, FedEx Freight, FedEx Services and FedEx Express. The services of this corporation
CASES IN FINANCE
Introduction
FedEx and UPS are the two business belonging to the same industry. Both companies are
the top leading companies and are competing with each other for several years. These companies
are sometimes similar in their business strategies but sometimes they differ too. This is because
the business model differs in both companies. The logistics services, ground deliveries or aircraft
freight etc. are different services offered by the two companies. FedEx is known for its aircraft
freight while UPS is known for its ground deliveries. But it cannot be concluded that FedEx
doesn’t have the ground deliveries because it has a separate segment for this which is generating
revenue for the company as well. Similarly, UPS has aircraft freight business which is one of the
profitable segment of the company. The detailed analysis of the financials of the company can
tell the accurate difference in the strategies of both the companies. The comparison of the
financial statements is next to impossible without using financial ratios. The different financial
ratios will help to overview the performance of both companies. The major financial ratios which
financial analysts use for doing the financial analysis of the financial statements of the company
are current liquidity ratio, operating ratio, gearing ratio, profitability ratio and performance ratio.
There are several ratios covered under this subcategory of financial ratios. The recent trends of
logistics management can be seen in the business approaches of the two business. These
companies know the importance of innovation and upgrading the business always. This is the
reason why both of these companies have become the market leaders in the industry they are
operating.
Discussion
About FedEx Corporation
FedEx Corporation is a business which is registered under NYSE as FDX. The company
was founded in the year 1973. The headquarters of the company are established in Memphis,
Tennessee. The business activities of the company include e-commerce and transportation
services to its customers (Wetherbe 2016). The company has more than 4.5 lakh employees who
working collectively and providing safe and high standard services to the customers. This has
made the company on the list of top-ranking companies under its field of operations. FedEx is
the abbreviation for Federal Express. The business segments of the FedEx corporation are FedEx
Ground, FedEx Freight, FedEx Services and FedEx Express. The services of this corporation
Paraphrase This Document
Need a fresh take? Get an instant paraphrase of this document with our AI Paraphraser
4
CASES IN FINANCE
have connected the e-commerce industry and reduced the complex business activities much
easier by introducing international shipping and flights for transportation services of goods
(Investors.fedex.com. 2018).
About United Parcel Service, Inc.
United Parcel Service started its operation in the year 1907 in Seattle (Washington) as a
private company involved in delivery concerning services. The company incorporated in the year
1999. The company has its headquarters in Sandy Springs, Georgia in the United States. The
company has become the world largest company delivering packages by using shipping
transportation and airline services. The company is providing services to more than 200
countries. It provides its customers with multiple benefits like they can customise the labelling of
packaging and documentation. They get the full detail of the tracking of the shipment including
alert messages.
The company has clients like eBay and Amazon to deliver the shipment packaging safely
to their clients (van den et al. 2017). It has become the global leader in logistic business. The
company is continuously innovating its approaches in providing logistic services. It has acquired
several companies who were on the same business and improved its customer base and quality of
services. The company is listed under NYSE as UPS. The air hub concerning European market is
situated in Cologne, Germany while the air hub concerning Asia is located in China, Hong Kong
and Shanghai. The American air hubs are Hamilton, Ontario and Miami, Florida
(Investors.ups.com. 2018).
Comparison of business structure
Both the company are public companies and are running their business in the field of e-
commerce logistics having headquarters in the United States. UPS is much older than FedEx in
terms of their foundation years. The subsidiaries of UPS are the UPS store, UPS Capital, UPS
airlines, UPS supply chain solutions, UPS mail innovations, UPS freight, UPS Professional
Solutions and UPS Express Critical while FedEx has subsidiaries which are FedEx Express,
FedEx custom critical, FedEx supply chain, FedEx ground, FedEx custom, FedEx Freight,
FedEx trade networks and FedEx services. Both companies operate with the help of a large
number of employees. The FedEx has more than 2.5 lakh employees; on the other hand, UPS has
more than 3.5 lakh employees.
5
CASES IN FINANCE
FedEx shows different segment reporting in its financial statements as it has various dissimilar
departments of operation from FedEx express to FedEx ground and FedEx freight. No business
can use a single type of operational networking for all its different segments. On the other hand,
UPS has the business of small package delivery which is quite different from FedEx. So the
networking styles of both the companies are different.
FedEx uses multiple network strategy while UPS does not. The company’s operations
may look the same, but the operation style does not always match for companies running in the
same industry. UPS generates its major part of the revenue which is around 60% from only its
domestic market in the US while rest part of the revenue is generated from its two different
segments which are international packaging and Supply Chain & Freight. If the revenue data
shows that 78% is from the US market while only 22% is from the international market.
Competitive advantage
The FedEx shows in its annual report that it sees the trust of customers as the competitive
advantage. The statement of the company is true because the company was included in the ‘top
ten most admired companies’ and listed among ‘100 best companies to work for’ by the Fortune.
The UPS considers the technology, broad portfolio of services and customer relationship as its
competitive advantage (Kang and Huh 2017).
Elements of Risk for both the companies
Price risk – both the companies, FedEx and the UPS are subject to the price risk as prices of the
fuel, diesel and gas can fluctuate over time. These companies can face a situation of distress if
the prices of natural gas, oil, petrol and even electricity increase overtime. Both the companies
have entered in the futures and swap market to avoid this risk (Shah and Noreen 2016)
Interest rate Risk – Every company buys some debt form outside like government and
corporate bond, long term and short term debt instrument etc. the fluctuation in the interest rate
can pose a major threat to the company. The companies enter into interest rate swaps to mitigate
these risk (Bretscher, Schmid and Vedolin 2018).
Exchange Rate Risk – Both the companies faces exchange Rate risk. FedEx and UPS are
engaged in overseas businesses. This kind of business faces currency rate risk as to the countries
⊘ This is a preview!⊘
Do you want full access?
Subscribe today to unlock all pages.
Trusted by 1+ million students worldwide
6
CASES IN FINANCE
they are dealing with, the rate of the currency of that country can fluctuate over time (Alagideden
and Ibrahim 2017).
The different types of risks that are explained can affect the operational performance of the
company which can directly effect the cash flows of the companies.
Ratio Analysis
Liquidity Ratio
*Amount in millions
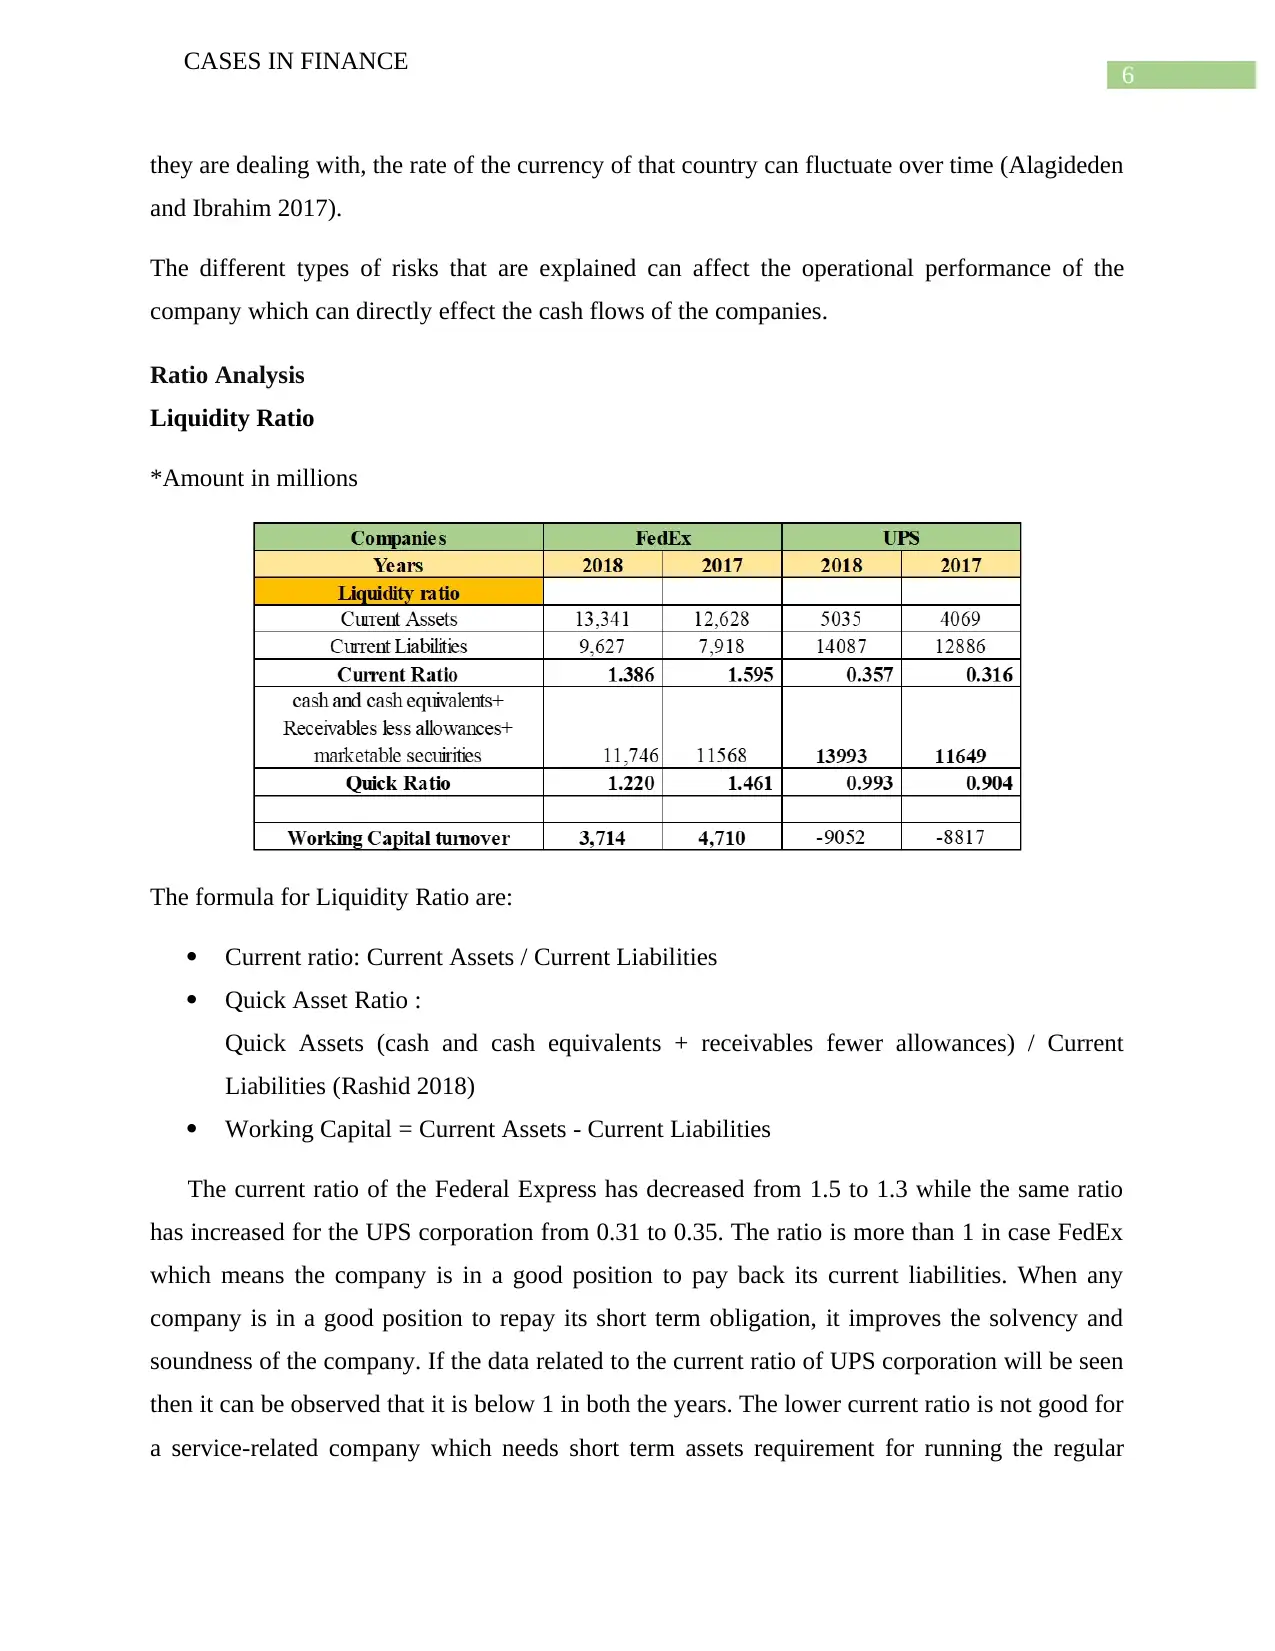
The formula for Liquidity Ratio are:
Current ratio: Current Assets / Current Liabilities
Quick Asset Ratio :
Quick Assets (cash and cash equivalents + receivables fewer allowances) / Current
Liabilities (Rashid 2018)
Working Capital = Current Assets - Current Liabilities
The current ratio of the Federal Express has decreased from 1.5 to 1.3 while the same ratio
has increased for the UPS corporation from 0.31 to 0.35. The ratio is more than 1 in case FedEx
which means the company is in a good position to pay back its current liabilities. When any
company is in a good position to repay its short term obligation, it improves the solvency and
soundness of the company. If the data related to the current ratio of UPS corporation will be seen
then it can be observed that it is below 1 in both the years. The lower current ratio is not good for
a service-related company which needs short term assets requirement for running the regular
CASES IN FINANCE
they are dealing with, the rate of the currency of that country can fluctuate over time (Alagideden
and Ibrahim 2017).
The different types of risks that are explained can affect the operational performance of the
company which can directly effect the cash flows of the companies.
Ratio Analysis
Liquidity Ratio
*Amount in millions
The formula for Liquidity Ratio are:
Current ratio: Current Assets / Current Liabilities
Quick Asset Ratio :
Quick Assets (cash and cash equivalents + receivables fewer allowances) / Current
Liabilities (Rashid 2018)
Working Capital = Current Assets - Current Liabilities
The current ratio of the Federal Express has decreased from 1.5 to 1.3 while the same ratio
has increased for the UPS corporation from 0.31 to 0.35. The ratio is more than 1 in case FedEx
which means the company is in a good position to pay back its current liabilities. When any
company is in a good position to repay its short term obligation, it improves the solvency and
soundness of the company. If the data related to the current ratio of UPS corporation will be seen
then it can be observed that it is below 1 in both the years. The lower current ratio is not good for
a service-related company which needs short term assets requirement for running the regular
Paraphrase This Document
Need a fresh take? Get an instant paraphrase of this document with our AI Paraphraser
7
CASES IN FINANCE
operation of the company. on the same hand, the quick ratio of the FedEx has decreased from 1.4
to 1.2 which has been slightly decreased but still the company is in a good position as there is
sufficient cash equivalent without creating pressure on the capital, the company has created good
cash position than the UPS corporation (Durrah et al. 2016).
The working capital turnover of Federal Express has decreased from $4710 to $3714 while
the working capital data of UPS Corporation is showing negative value which is continuously
deteriorating. These data shows similar observations as in the current ratio. It shows that FedEx
is in a good position to pay back its current liabilities than UPS Corporation (Wibowo and
Rohyati 2018).
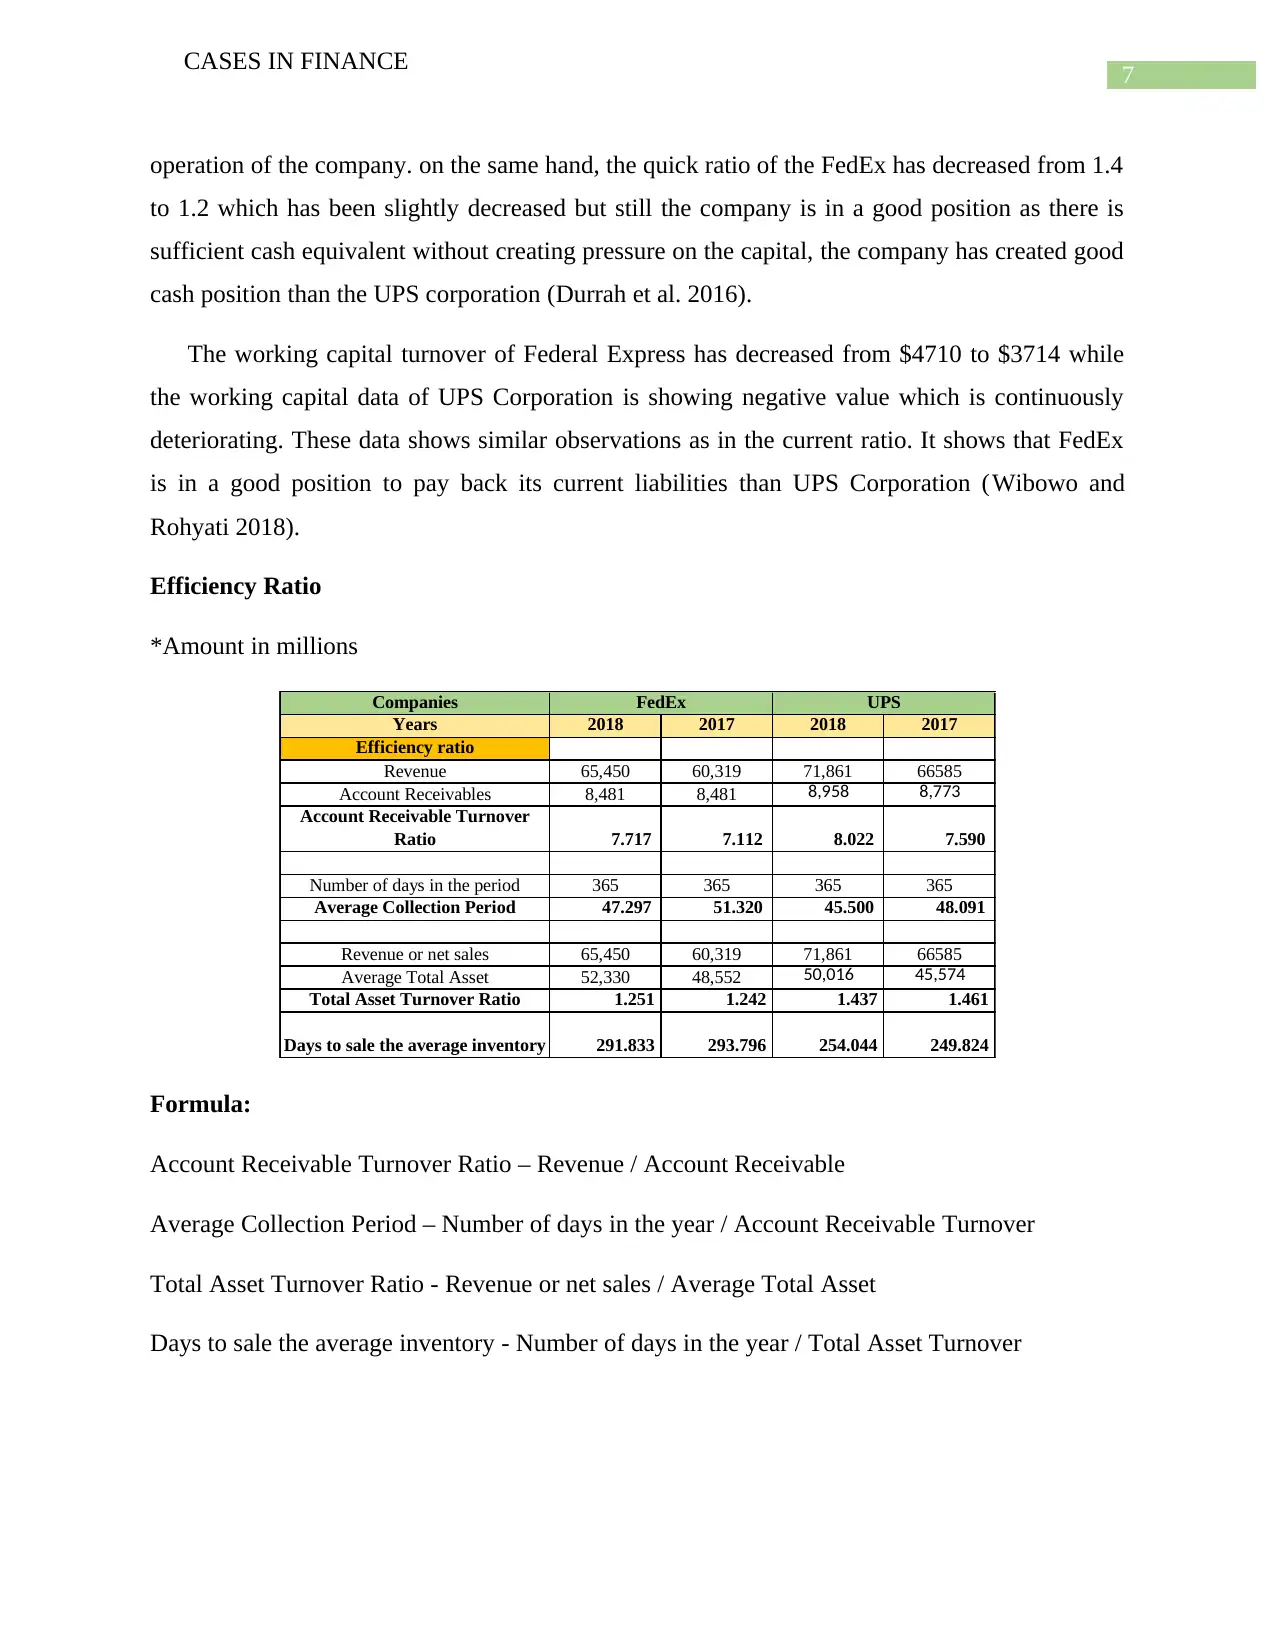
Efficiency Ratio
*Amount in millions
Companies
Years 2018 2017 2018 2017
Efficiency ratio
Revenue 65,450 60,319 71,861 66585
Account Receivables 8,481 8,481 8,958 8,773
Account Receivable Turnover
Ratio 7.717 7.112 8.022 7.590
Number of days in the period 365 365 365 365
Average Collection Period 47.297 51.320 45.500 48.091
Revenue or net sales 65,450 60,319 71,861 66585
Average Total Asset 52,330 48,552 50,016 45,574
Total Asset Turnover Ratio 1.251 1.242 1.437 1.461
Days to sale the average inventory 291.833 293.796 254.044 249.824
FedEx UPS
Formula:
Account Receivable Turnover Ratio – Revenue / Account Receivable
Average Collection Period – Number of days in the year / Account Receivable Turnover
Total Asset Turnover Ratio - Revenue or net sales / Average Total Asset
Days to sale the average inventory - Number of days in the year / Total Asset Turnover
CASES IN FINANCE
operation of the company. on the same hand, the quick ratio of the FedEx has decreased from 1.4
to 1.2 which has been slightly decreased but still the company is in a good position as there is
sufficient cash equivalent without creating pressure on the capital, the company has created good
cash position than the UPS corporation (Durrah et al. 2016).
The working capital turnover of Federal Express has decreased from $4710 to $3714 while
the working capital data of UPS Corporation is showing negative value which is continuously
deteriorating. These data shows similar observations as in the current ratio. It shows that FedEx
is in a good position to pay back its current liabilities than UPS Corporation (Wibowo and
Rohyati 2018).
Efficiency Ratio
*Amount in millions
Companies
Years 2018 2017 2018 2017
Efficiency ratio
Revenue 65,450 60,319 71,861 66585
Account Receivables 8,481 8,481 8,958 8,773
Account Receivable Turnover
Ratio 7.717 7.112 8.022 7.590
Number of days in the period 365 365 365 365
Average Collection Period 47.297 51.320 45.500 48.091
Revenue or net sales 65,450 60,319 71,861 66585
Average Total Asset 52,330 48,552 50,016 45,574
Total Asset Turnover Ratio 1.251 1.242 1.437 1.461
Days to sale the average inventory 291.833 293.796 254.044 249.824
FedEx UPS
Formula:
Account Receivable Turnover Ratio – Revenue / Account Receivable
Average Collection Period – Number of days in the year / Account Receivable Turnover
Total Asset Turnover Ratio - Revenue or net sales / Average Total Asset
Days to sale the average inventory - Number of days in the year / Total Asset Turnover
8
CASES IN FINANCE
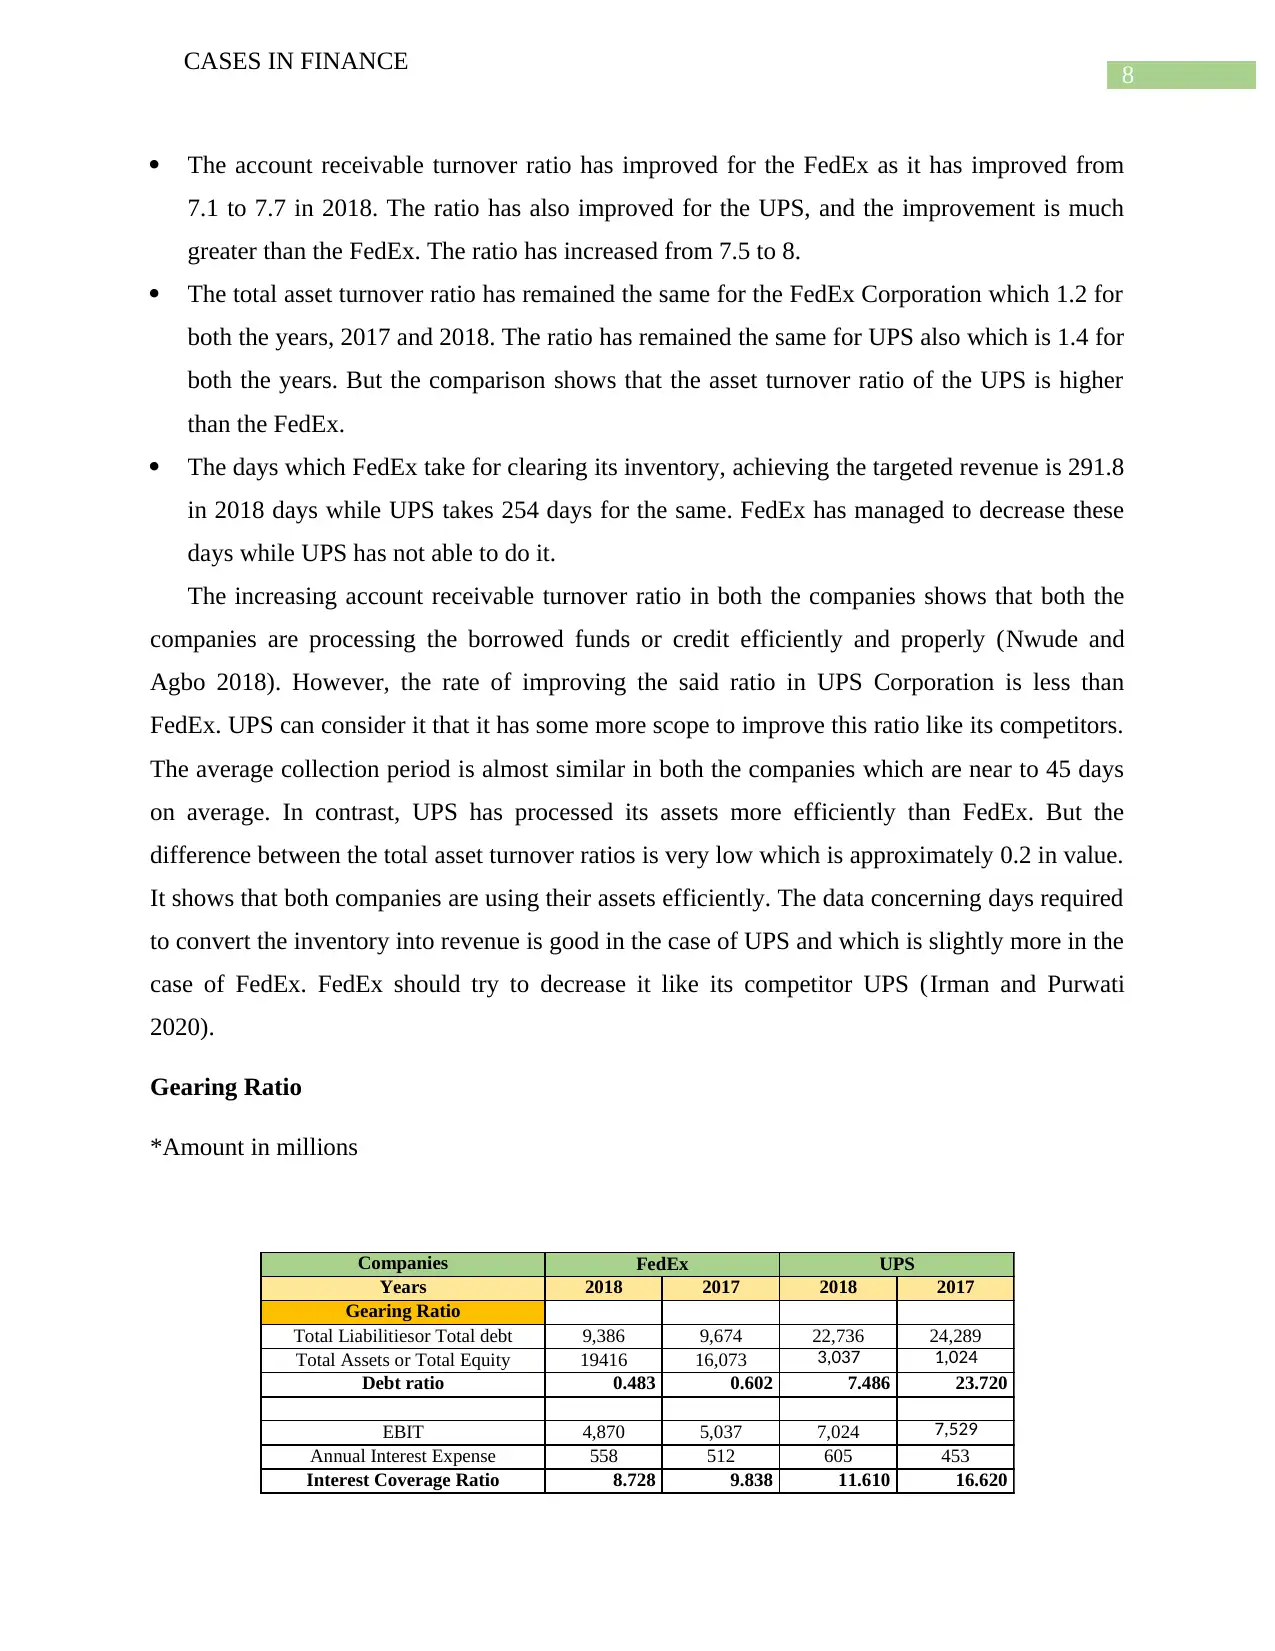
The account receivable turnover ratio has improved for the FedEx as it has improved from
7.1 to 7.7 in 2018. The ratio has also improved for the UPS, and the improvement is much
greater than the FedEx. The ratio has increased from 7.5 to 8.
The total asset turnover ratio has remained the same for the FedEx Corporation which 1.2 for
both the years, 2017 and 2018. The ratio has remained the same for UPS also which is 1.4 for
both the years. But the comparison shows that the asset turnover ratio of the UPS is higher
than the FedEx.
The days which FedEx take for clearing its inventory, achieving the targeted revenue is 291.8
in 2018 days while UPS takes 254 days for the same. FedEx has managed to decrease these
days while UPS has not able to do it.
The increasing account receivable turnover ratio in both the companies shows that both the
companies are processing the borrowed funds or credit efficiently and properly (Nwude and
Agbo 2018). However, the rate of improving the said ratio in UPS Corporation is less than
FedEx. UPS can consider it that it has some more scope to improve this ratio like its competitors.
The average collection period is almost similar in both the companies which are near to 45 days
on average. In contrast, UPS has processed its assets more efficiently than FedEx. But the
difference between the total asset turnover ratios is very low which is approximately 0.2 in value.
It shows that both companies are using their assets efficiently. The data concerning days required
to convert the inventory into revenue is good in the case of UPS and which is slightly more in the
case of FedEx. FedEx should try to decrease it like its competitor UPS (Irman and Purwati
2020).
Gearing Ratio
*Amount in millions
Companies
Years 2018 2017 2018 2017
Gearing Ratio
Total Liabilitiesor Total debt 9,386 9,674 22,736 24,289
Total Assets or Total Equity 19416 16,073 3,037 1,024
Debt ratio 0.483 0.602 7.486 23.720
EBIT 4,870 5,037 7,024 7,529
Annual Interest Expense 558 512 605 453
Interest Coverage Ratio 8.728 9.838 11.610 16.620
FedEx UPS
CASES IN FINANCE
The account receivable turnover ratio has improved for the FedEx as it has improved from
7.1 to 7.7 in 2018. The ratio has also improved for the UPS, and the improvement is much
greater than the FedEx. The ratio has increased from 7.5 to 8.
The total asset turnover ratio has remained the same for the FedEx Corporation which 1.2 for
both the years, 2017 and 2018. The ratio has remained the same for UPS also which is 1.4 for
both the years. But the comparison shows that the asset turnover ratio of the UPS is higher
than the FedEx.
The days which FedEx take for clearing its inventory, achieving the targeted revenue is 291.8
in 2018 days while UPS takes 254 days for the same. FedEx has managed to decrease these
days while UPS has not able to do it.
The increasing account receivable turnover ratio in both the companies shows that both the
companies are processing the borrowed funds or credit efficiently and properly (Nwude and
Agbo 2018). However, the rate of improving the said ratio in UPS Corporation is less than
FedEx. UPS can consider it that it has some more scope to improve this ratio like its competitors.
The average collection period is almost similar in both the companies which are near to 45 days
on average. In contrast, UPS has processed its assets more efficiently than FedEx. But the
difference between the total asset turnover ratios is very low which is approximately 0.2 in value.
It shows that both companies are using their assets efficiently. The data concerning days required
to convert the inventory into revenue is good in the case of UPS and which is slightly more in the
case of FedEx. FedEx should try to decrease it like its competitor UPS (Irman and Purwati
2020).
Gearing Ratio
*Amount in millions
Companies
Years 2018 2017 2018 2017
Gearing Ratio
Total Liabilitiesor Total debt 9,386 9,674 22,736 24,289
Total Assets or Total Equity 19416 16,073 3,037 1,024
Debt ratio 0.483 0.602 7.486 23.720
EBIT 4,870 5,037 7,024 7,529
Annual Interest Expense 558 512 605 453
Interest Coverage Ratio 8.728 9.838 11.610 16.620
FedEx UPS
⊘ This is a preview!⊘
Do you want full access?
Subscribe today to unlock all pages.
Trusted by 1+ million students worldwide
9
CASES IN FINANCE
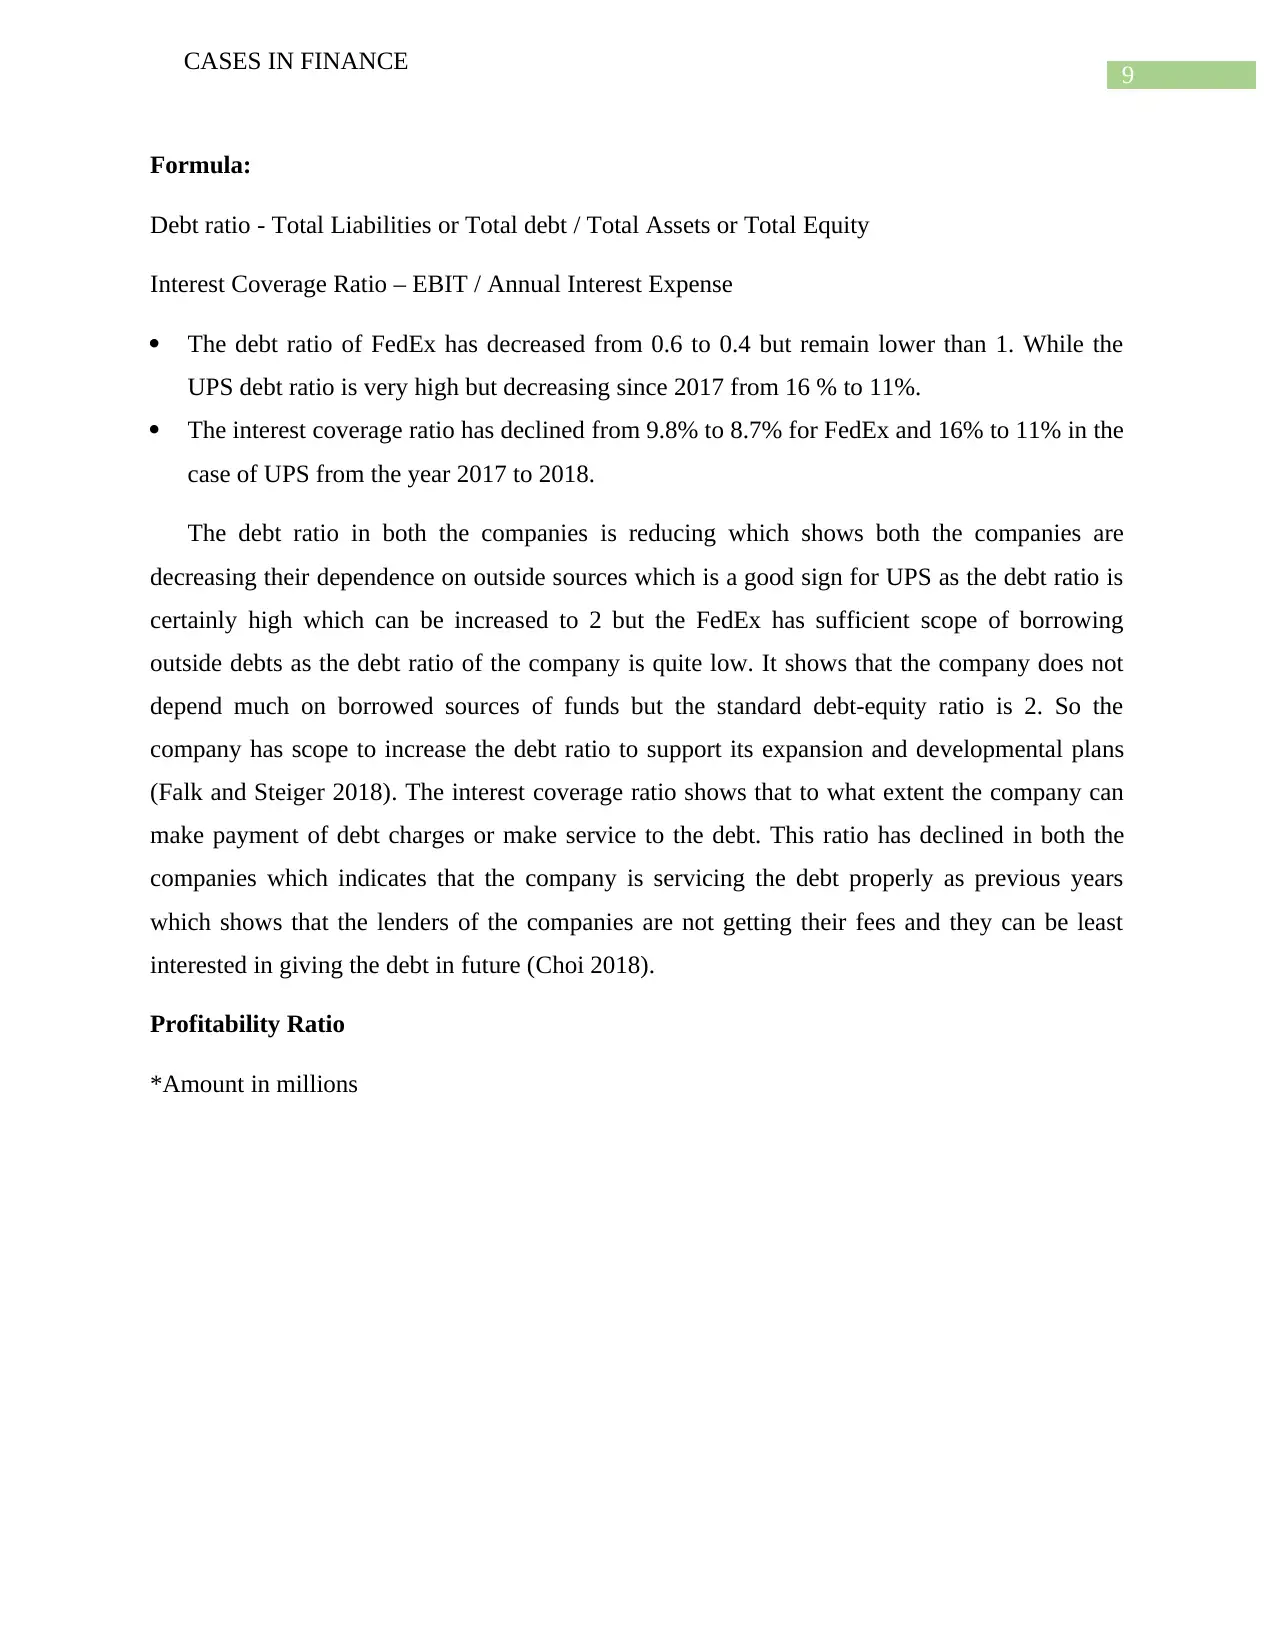
Formula:
Debt ratio - Total Liabilities or Total debt / Total Assets or Total Equity
Interest Coverage Ratio – EBIT / Annual Interest Expense
The debt ratio of FedEx has decreased from 0.6 to 0.4 but remain lower than 1. While the
UPS debt ratio is very high but decreasing since 2017 from 16 % to 11%.
The interest coverage ratio has declined from 9.8% to 8.7% for FedEx and 16% to 11% in the
case of UPS from the year 2017 to 2018.
The debt ratio in both the companies is reducing which shows both the companies are
decreasing their dependence on outside sources which is a good sign for UPS as the debt ratio is
certainly high which can be increased to 2 but the FedEx has sufficient scope of borrowing
outside debts as the debt ratio of the company is quite low. It shows that the company does not
depend much on borrowed sources of funds but the standard debt-equity ratio is 2. So the
company has scope to increase the debt ratio to support its expansion and developmental plans
(Falk and Steiger 2018). The interest coverage ratio shows that to what extent the company can
make payment of debt charges or make service to the debt. This ratio has declined in both the
companies which indicates that the company is servicing the debt properly as previous years
which shows that the lenders of the companies are not getting their fees and they can be least
interested in giving the debt in future (Choi 2018).
Profitability Ratio
*Amount in millions
CASES IN FINANCE
Formula:
Debt ratio - Total Liabilities or Total debt / Total Assets or Total Equity
Interest Coverage Ratio – EBIT / Annual Interest Expense
The debt ratio of FedEx has decreased from 0.6 to 0.4 but remain lower than 1. While the
UPS debt ratio is very high but decreasing since 2017 from 16 % to 11%.
The interest coverage ratio has declined from 9.8% to 8.7% for FedEx and 16% to 11% in the
case of UPS from the year 2017 to 2018.
The debt ratio in both the companies is reducing which shows both the companies are
decreasing their dependence on outside sources which is a good sign for UPS as the debt ratio is
certainly high which can be increased to 2 but the FedEx has sufficient scope of borrowing
outside debts as the debt ratio of the company is quite low. It shows that the company does not
depend much on borrowed sources of funds but the standard debt-equity ratio is 2. So the
company has scope to increase the debt ratio to support its expansion and developmental plans
(Falk and Steiger 2018). The interest coverage ratio shows that to what extent the company can
make payment of debt charges or make service to the debt. This ratio has declined in both the
companies which indicates that the company is servicing the debt properly as previous years
which shows that the lenders of the companies are not getting their fees and they can be least
interested in giving the debt in future (Choi 2018).
Profitability Ratio
*Amount in millions
Paraphrase This Document
Need a fresh take? Get an instant paraphrase of this document with our AI Paraphraser
10
CASES IN FINANCE
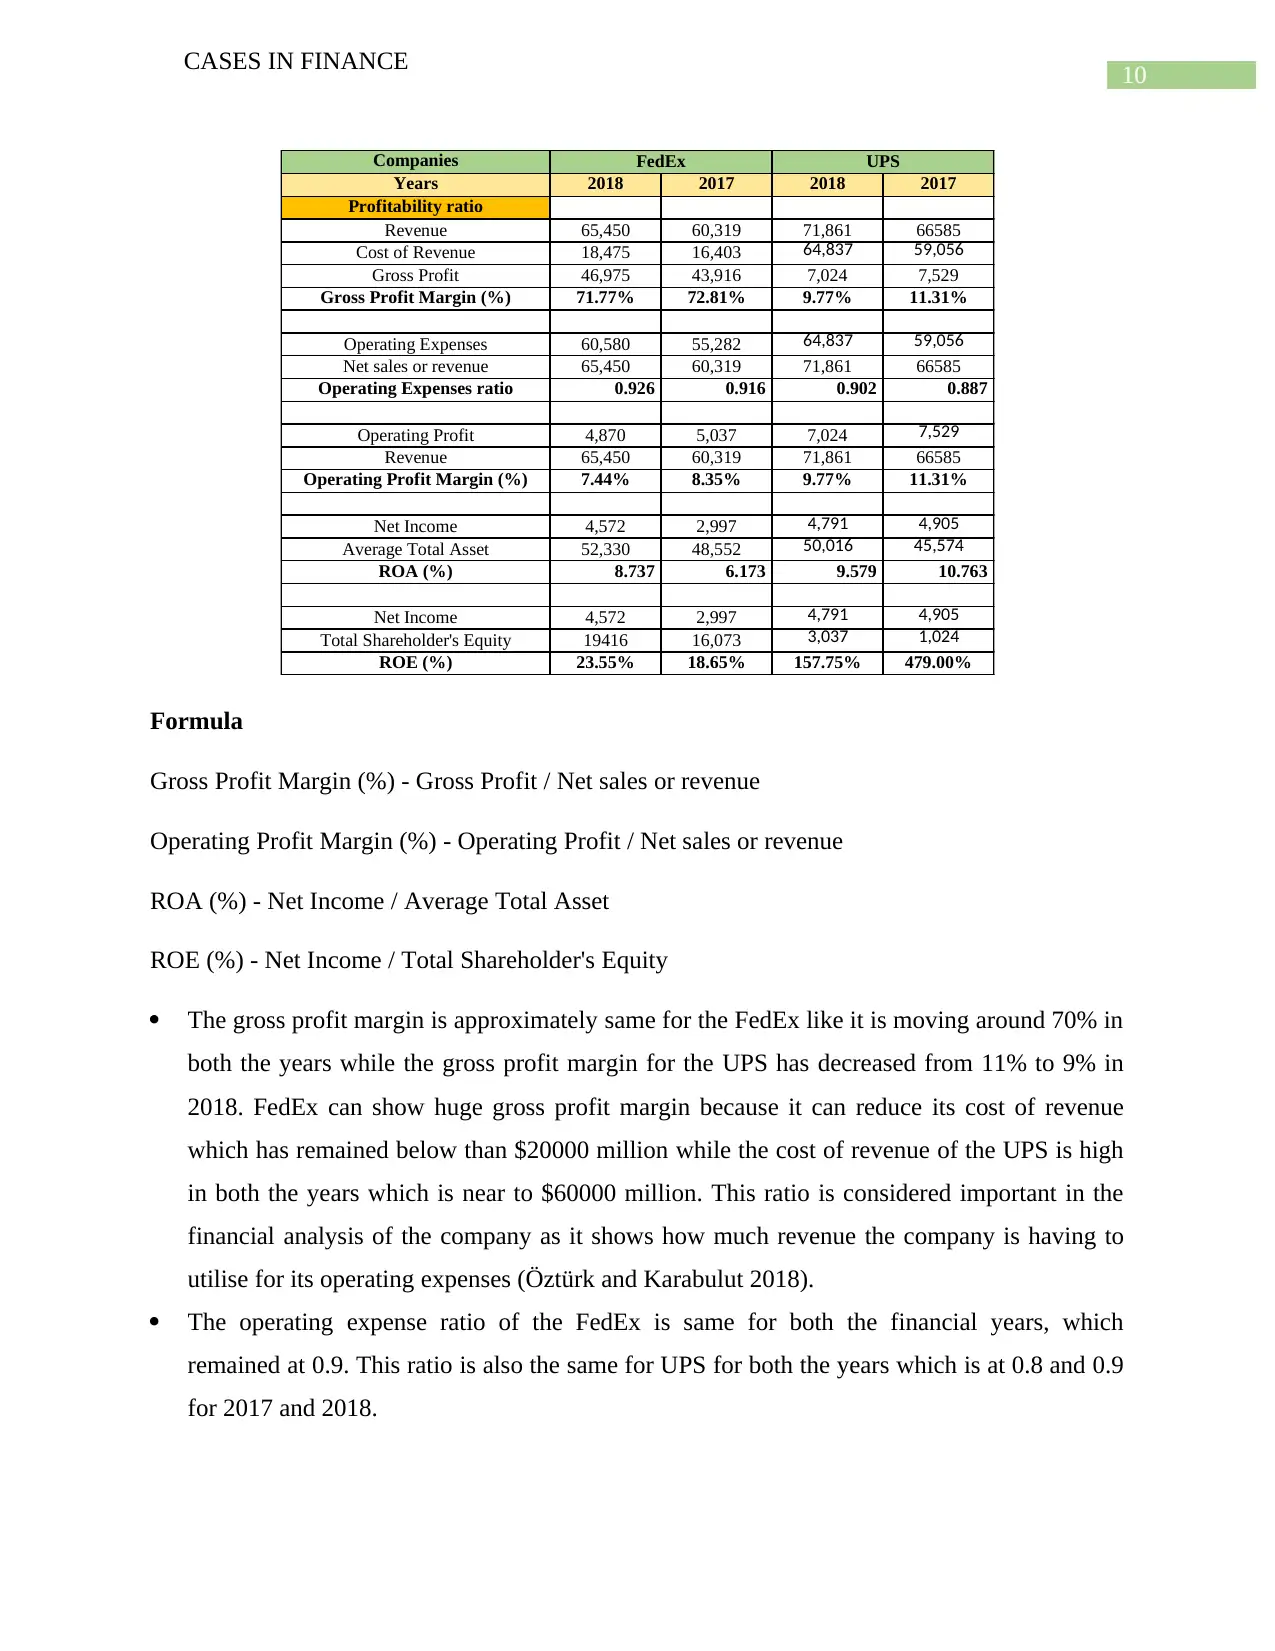
Companies
Years 2018 2017 2018 2017
Profitability ratio
Revenue 65,450 60,319 71,861 66585
Cost of Revenue 18,475 16,403 64,837 59,056
Gross Profit 46,975 43,916 7,024 7,529
Gross Profit Margin (%) 71.77% 72.81% 9.77% 11.31%
Operating Expenses 60,580 55,282 64,837 59,056
Net sales or revenue 65,450 60,319 71,861 66585
Operating Expenses ratio 0.926 0.916 0.902 0.887
Operating Profit 4,870 5,037 7,024 7,529
Revenue 65,450 60,319 71,861 66585
Operating Profit Margin (%) 7.44% 8.35% 9.77% 11.31%
Net Income 4,572 2,997 4,791 4,905
Average Total Asset 52,330 48,552 50,016 45,574
ROA (%) 8.737 6.173 9.579 10.763
Net Income 4,572 2,997 4,791 4,905
Total Shareholder's Equity 19416 16,073 3,037 1,024
ROE (%) 23.55% 18.65% 157.75% 479.00%
FedEx UPS
Formula
Gross Profit Margin (%) - Gross Profit / Net sales or revenue
Operating Profit Margin (%) - Operating Profit / Net sales or revenue
ROA (%) - Net Income / Average Total Asset
ROE (%) - Net Income / Total Shareholder's Equity
The gross profit margin is approximately same for the FedEx like it is moving around 70% in
both the years while the gross profit margin for the UPS has decreased from 11% to 9% in
2018. FedEx can show huge gross profit margin because it can reduce its cost of revenue
which has remained below than $20000 million while the cost of revenue of the UPS is high
in both the years which is near to $60000 million. This ratio is considered important in the
financial analysis of the company as it shows how much revenue the company is having to
utilise for its operating expenses (Öztürk and Karabulut 2018).
The operating expense ratio of the FedEx is same for both the financial years, which
remained at 0.9. This ratio is also the same for UPS for both the years which is at 0.8 and 0.9
for 2017 and 2018.
CASES IN FINANCE
Companies
Years 2018 2017 2018 2017
Profitability ratio
Revenue 65,450 60,319 71,861 66585
Cost of Revenue 18,475 16,403 64,837 59,056
Gross Profit 46,975 43,916 7,024 7,529
Gross Profit Margin (%) 71.77% 72.81% 9.77% 11.31%
Operating Expenses 60,580 55,282 64,837 59,056
Net sales or revenue 65,450 60,319 71,861 66585
Operating Expenses ratio 0.926 0.916 0.902 0.887
Operating Profit 4,870 5,037 7,024 7,529
Revenue 65,450 60,319 71,861 66585
Operating Profit Margin (%) 7.44% 8.35% 9.77% 11.31%
Net Income 4,572 2,997 4,791 4,905
Average Total Asset 52,330 48,552 50,016 45,574
ROA (%) 8.737 6.173 9.579 10.763
Net Income 4,572 2,997 4,791 4,905
Total Shareholder's Equity 19416 16,073 3,037 1,024
ROE (%) 23.55% 18.65% 157.75% 479.00%
FedEx UPS
Formula
Gross Profit Margin (%) - Gross Profit / Net sales or revenue
Operating Profit Margin (%) - Operating Profit / Net sales or revenue
ROA (%) - Net Income / Average Total Asset
ROE (%) - Net Income / Total Shareholder's Equity
The gross profit margin is approximately same for the FedEx like it is moving around 70% in
both the years while the gross profit margin for the UPS has decreased from 11% to 9% in
2018. FedEx can show huge gross profit margin because it can reduce its cost of revenue
which has remained below than $20000 million while the cost of revenue of the UPS is high
in both the years which is near to $60000 million. This ratio is considered important in the
financial analysis of the company as it shows how much revenue the company is having to
utilise for its operating expenses (Öztürk and Karabulut 2018).
The operating expense ratio of the FedEx is same for both the financial years, which
remained at 0.9. This ratio is also the same for UPS for both the years which is at 0.8 and 0.9
for 2017 and 2018.
11
CASES IN FINANCE
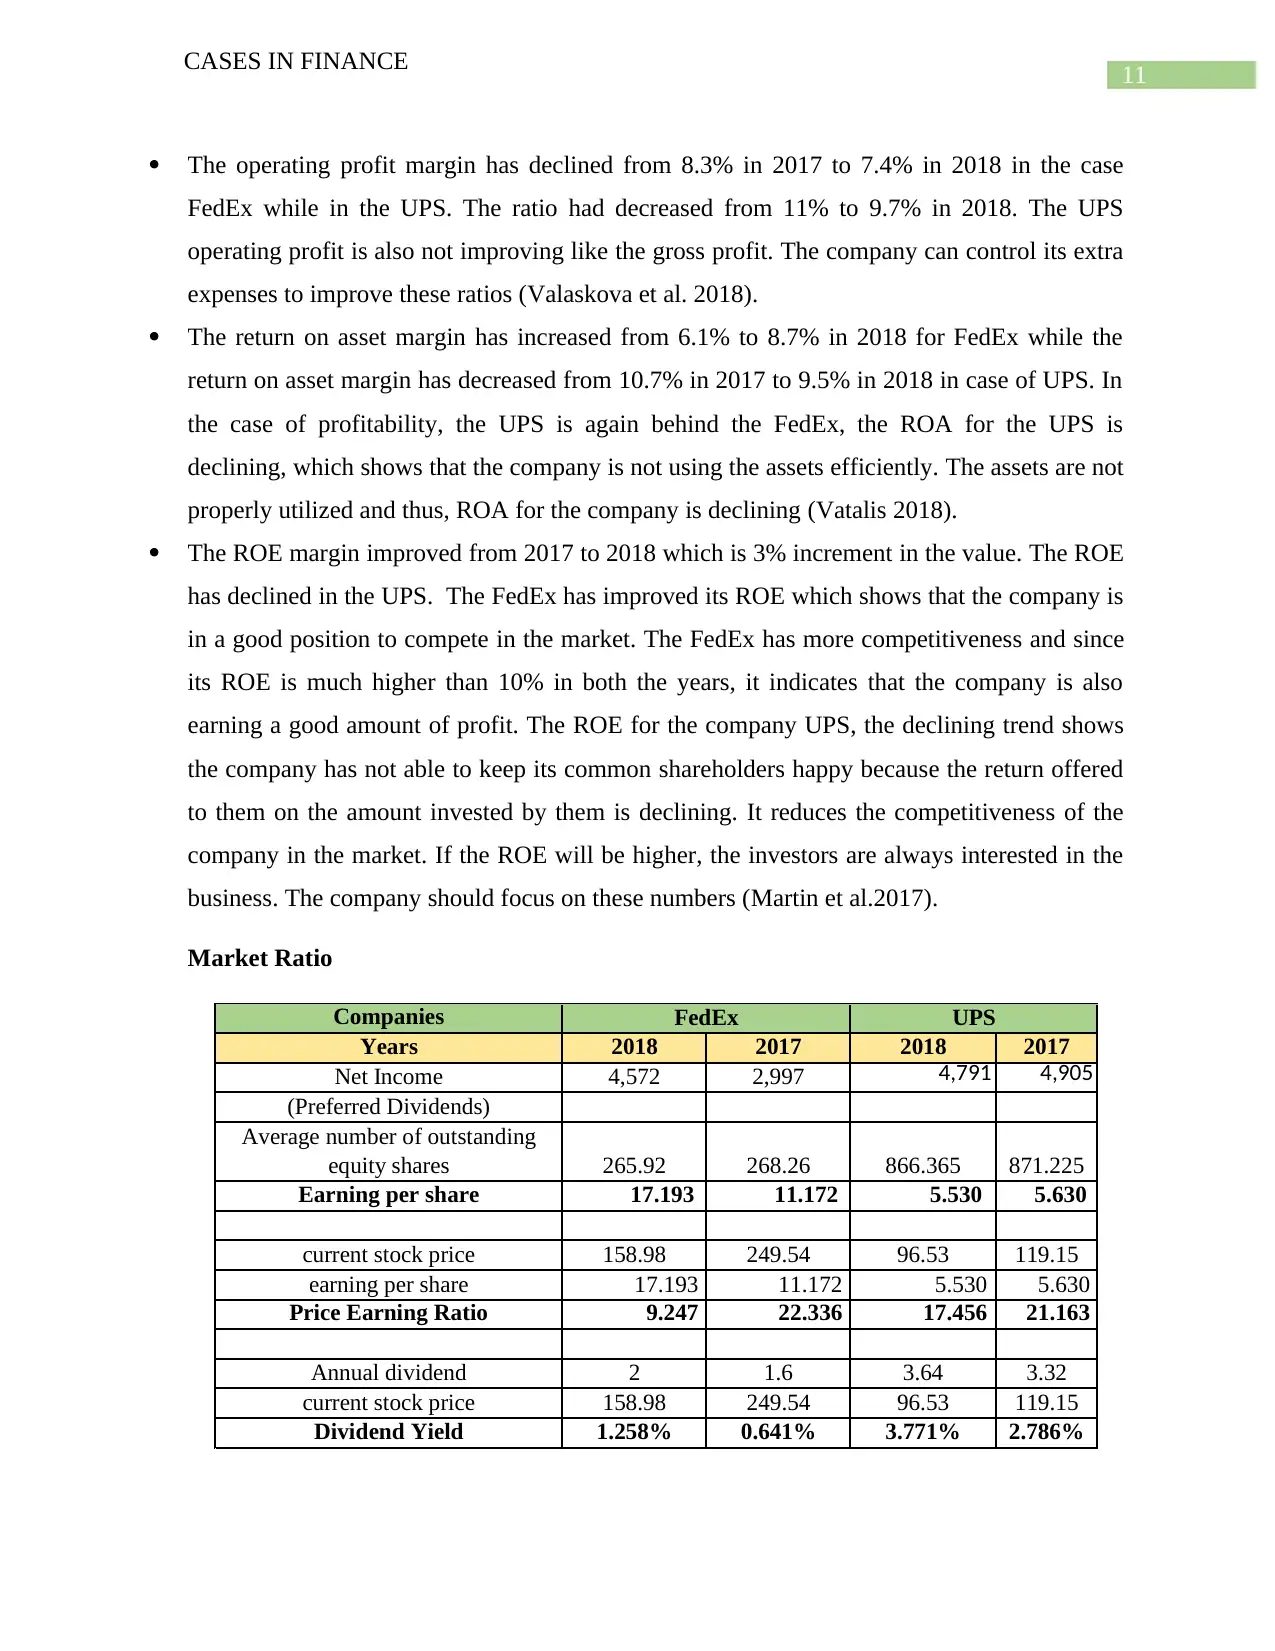
The operating profit margin has declined from 8.3% in 2017 to 7.4% in 2018 in the case
FedEx while in the UPS. The ratio had decreased from 11% to 9.7% in 2018. The UPS
operating profit is also not improving like the gross profit. The company can control its extra
expenses to improve these ratios (Valaskova et al. 2018).
The return on asset margin has increased from 6.1% to 8.7% in 2018 for FedEx while the
return on asset margin has decreased from 10.7% in 2017 to 9.5% in 2018 in case of UPS. In
the case of profitability, the UPS is again behind the FedEx, the ROA for the UPS is
declining, which shows that the company is not using the assets efficiently. The assets are not
properly utilized and thus, ROA for the company is declining (Vatalis 2018).
The ROE margin improved from 2017 to 2018 which is 3% increment in the value. The ROE
has declined in the UPS. The FedEx has improved its ROE which shows that the company is
in a good position to compete in the market. The FedEx has more competitiveness and since
its ROE is much higher than 10% in both the years, it indicates that the company is also
earning a good amount of profit. The ROE for the company UPS, the declining trend shows
the company has not able to keep its common shareholders happy because the return offered
to them on the amount invested by them is declining. It reduces the competitiveness of the
company in the market. If the ROE will be higher, the investors are always interested in the
business. The company should focus on these numbers (Martin et al.2017).
Market Ratio
Companies
Years 2018 2017 2018 2017
Net Income 4,572 2,997 4,791 4,905
(Preferred Dividends)
Average number of outstanding
equity shares 265.92 268.26 866.365 871.225
Earning per share 17.193 11.172 5.530 5.630
current stock price 158.98 249.54 96.53 119.15
earning per share 17.193 11.172 5.530 5.630
Price Earning Ratio 9.247 22.336 17.456 21.163
Annual dividend 2 1.6 3.64 3.32
current stock price 158.98 249.54 96.53 119.15
Dividend Yield 1.258% 0.641% 3.771% 2.786%
UPSFedEx
CASES IN FINANCE
The operating profit margin has declined from 8.3% in 2017 to 7.4% in 2018 in the case
FedEx while in the UPS. The ratio had decreased from 11% to 9.7% in 2018. The UPS
operating profit is also not improving like the gross profit. The company can control its extra
expenses to improve these ratios (Valaskova et al. 2018).
The return on asset margin has increased from 6.1% to 8.7% in 2018 for FedEx while the
return on asset margin has decreased from 10.7% in 2017 to 9.5% in 2018 in case of UPS. In
the case of profitability, the UPS is again behind the FedEx, the ROA for the UPS is
declining, which shows that the company is not using the assets efficiently. The assets are not
properly utilized and thus, ROA for the company is declining (Vatalis 2018).
The ROE margin improved from 2017 to 2018 which is 3% increment in the value. The ROE
has declined in the UPS. The FedEx has improved its ROE which shows that the company is
in a good position to compete in the market. The FedEx has more competitiveness and since
its ROE is much higher than 10% in both the years, it indicates that the company is also
earning a good amount of profit. The ROE for the company UPS, the declining trend shows
the company has not able to keep its common shareholders happy because the return offered
to them on the amount invested by them is declining. It reduces the competitiveness of the
company in the market. If the ROE will be higher, the investors are always interested in the
business. The company should focus on these numbers (Martin et al.2017).
Market Ratio
Companies
Years 2018 2017 2018 2017
Net Income 4,572 2,997 4,791 4,905
(Preferred Dividends)
Average number of outstanding
equity shares 265.92 268.26 866.365 871.225
Earning per share 17.193 11.172 5.530 5.630
current stock price 158.98 249.54 96.53 119.15
earning per share 17.193 11.172 5.530 5.630
Price Earning Ratio 9.247 22.336 17.456 21.163
Annual dividend 2 1.6 3.64 3.32
current stock price 158.98 249.54 96.53 119.15
Dividend Yield 1.258% 0.641% 3.771% 2.786%
UPSFedEx
⊘ This is a preview!⊘
Do you want full access?
Subscribe today to unlock all pages.
Trusted by 1+ million students worldwide
1 out of 17
Related Documents


Your All-in-One AI-Powered Toolkit for Academic Success.
+13062052269
info@desklib.com
Available 24*7 on WhatsApp / Email
![[object Object]](/_next/static/media/star-bottom.7253800d.svg)
Unlock your academic potential
Copyright © 2020–2026 A2Z Services. All Rights Reserved. Developed and managed by ZUCOL.