Financial Analysis Report
VerifiedAdded on 2019/09/30
|24
|4376
|232
Report
AI Summary
This report provides a comprehensive financial analysis of Ford Motor Company and Tesla, Inc. It begins by formulating a mini-case study of a hypothetical garment manufacturing company, Elliott Fashion Private Limited, to illustrate concepts like stock valuation, bond valuation, cost of capital, and capital budgeting. The core of the report focuses on a comparative analysis of Ford and Tesla. It calculates and interprets the betas of both companies, determining their systematic risk. Stock returns and risk are calculated, and a detailed comparison of their financial performance is presented using profitability ratios (net profit margin, gross profit margin, ROA, ROE), liquidity ratios (current ratio, quick ratio), and the debt-to-equity ratio. The analysis reveals that Ford exhibits stronger financial performance across most metrics compared to Tesla, despite Tesla having a higher gross profit margin. The report concludes that Ford presents a less risky and more financially sound investment option based on the data analyzed.
Running Head: Financial Analysis
FINANCIAL ANALYSIS
FINANCIAL ANALYSIS
Paraphrase This Document
Need a fresh take? Get an instant paraphrase of this document with our AI Paraphraser
Financial Analysis 2
Table of Contents
1. Formulation of a mini case of a hypothetical company...............................................................3
2. Analysis of Ford Motor Company and Tesla, Inc.......................................................................8
a. Betas of Ford Motor Company and Tesla Inc..........................................................................8
b. Calculation of return of stock...................................................................................................8
c. Calculation of the risk of stocks...............................................................................................9
d. Comparison between Ford Motor Company and Tesla, Inc..................................................10
e. Calculation and Comparison between Ford Motor Company and Tesla, Inc........................10
Reference List................................................................................................................................16
Appendices....................................................................................................................................18
Appendix 1.................................................................................................................................18
Appendix 2.................................................................................................................................21
Financial Analysis 3
1. Formulation of a mini case of a hypothetical company
Elliott Fashion Private Limited is a garment manufacturing company which is located in
Australia. The company is highly capable of manufacturing high quality fashion garments by
using top-notch fabric and ultra-modern designs. The company uses to manufactured and retail
its products in the domestic market of Australia. It is famous for fast-fashion clothing items for
women, teenagers, men, and children. Within Australia, Elliott Fashion Private Limited sells its
products through ten retail outlets and two factory outlets that are solely operated by it. Besides
this, the company also retails its clothing items through supermarkets and retail chains. The
company is very much committed to deliver standard quality clothing items at an affordable
price without compromising with the quality and style of the products. It is aimed to expand its
garment business in and around the major cities of Australia and for long-term it is intended to
enter into some of the flourishing markets in Asia like India, Singapore, and China. The
company's stocks are valued at a satisfactorily due to its steady growth in terms of profit
generation and increasing goodwill.
The company has raised finance by issuing shares as well as bonds. For meeting annual
finance need, it uses to reinvest its profit it uses to retain every year after making required
payments to its shareholders and creditors. The stocks of Elliott Fashion are upwards moving
which ROA and EPS of the company stand stronger and upwards moving compared to some
same line companies. Current valuation of the company’s stocks makes potential investors to
invest in the company. The company has issued some bonds for raising external finance
and valued them by determining the faire value of those bonds. Cost of capital of Elliot is low
due to the presence of a number of market opportunities for the company, less inflation and less
business risks. Furthermore, the growth seeking investment policy, suitable capital structure
policy and well-maintained dividend policy of Elliot Fashion help it to make its cost of capital
less than some of its competitor companies. In future, the company has a plan to expand its
business by entering into new business venture and by opening a new business unit. In order to
do so, Elliot Fashion is expected to use capital budgeting techniques.
⊘ This is a preview!⊘
Do you want full access?
Subscribe today to unlock all pages.
Trusted by 1+ million students worldwide
Financial Analysis 4
Questions and Answer on the following topics:
Stock Valuation
Question 1
What is the reason behind valuing stock?
Answer: In order to predict the future price of shares or potential market price of shares
stock valuation is done. It aimed to help the investors make their decision to make an investment
in a company through purchasing that company's shares.
Question 2
How stock valuation is done?
Answer: For calculating stock valuation current intrinsic value of a company’s stock is
multiplied by that company's projected EPS (earnings per share).
Question 3
What are the methods of stock valuation?
Answer: There are two types of stock valuation method such as absolute method and
relative method. The absolute method of stock valuation includes two types of valuation methods
such as the DDM (dividend discount model) and DCF (discounted cash flow model). On the
other side, relative stock valuation is done by calculating the major financial ratios of the same
line companies. Relative stock valuation stands as comparative analysis of companies on the
basis of their financial ratios like ROA (Return on Assets), EPS (earnings per share) and more
(corporatefinanceinstitute.com, 2019).
Bond valuation
Question 1
Paraphrase This Document
Need a fresh take? Get an instant paraphrase of this document with our AI Paraphraser
Financial Analysis 5
What is bond valuation?
Answer: Bond valuation refers to a technique by using which a specific bond’s
theoretical fair value is determined. Bond valuation uses to include the calculation of
present values of the future interest payment attached to a bond, and the value of a bond upon
maturity which is known as par value or face value of a bond.
Question 2
What is the reason behind bond valuation?
Answer: Bond valuation is done for determining the accurate PV (present value) of a
bind and for making an informed decision regarding investment.
Question 3
What are the steps of bond valuation?
Answer:
Step 1: Making an estimation of the expected cash flows.
Step 2: Determination of the appropriate rate of interest which is required to be used for
discounting the expected cash flows.
Step 3: Calculation of the PV (present value) of the expected cash flows (computed in
step -1) by using the interest rate calculated in step – 2 (efinancemanagement.com, 2019).
Cost of capital
Question 1
What stands as the cost of capital for an organisation?
Answer: Cost of capital is comprised of the cost of equity and cost of debt both that are
used by a company for financing its business. Cost of capital of a company depends on the
Financial Analysis 6
financing type a company chooses for financing its business. It refers to an opportunity
cost attached with a particular investment. Cost of capital is a rate of return which could be
earned by an investor if he/she makes the same amount of investment in another investment
option that includes equal risk.
Question 2
Why the cost of capital matters?
Answer: Cost of capital is a vital component in the task of valuing a business. It is often
used as the discount rate for calculating the fair value of the cash flows an investment delivers. It
helps investors to gauge the risk of investing in a company’s shares and it is necessary to
calculate for making decisions on capital budgeting. It helps to frame an appropriate credit policy
and to evaluate investment options. Furthermore, cost of capital is also played a vital role in
designing an optimum capital structure for a company (businessjargons.com, 2019).
Capital Budgeting
Question 1
What is capital budgeting?
Answer: Capital budgeting refers to a process by applying which a company uses to
determine and evaluate the potential investments or large expenses required to incur for a
proposed investment. These investments and expenditures include large capital projects such as
investing in one or more long-term venture(s), constructing a new office building or plant or
installation of any heavy machineries for new plat or existing production plant and more. Capital
budgeting is also called investment appraisal by using which a company compares between two
or more investment options and then select one out of them which it found more profitable than
the other options.
Question 2
⊘ This is a preview!⊘
Do you want full access?
Subscribe today to unlock all pages.
Trusted by 1+ million students worldwide
Financial Analysis 7
What are the benefits of capital budgeting?
Answer: Capital budgeting decisions help a company to evaluate a proposed project by
considering the expected outcome (monetary in form) of the project. It also helps to evaluate
expenditure related decisions which are involved in the current outflow of funds, to understand
risk and efforts, let the company control its expenditure and abstain a company from under and
over-investment.
Question 3
What are some of the commonly applied capital budgeting techniques?
Answer: Capital budgeting methods are sub-divided into two segments such as
traditional method and modern or discounting method. Under the traditional method, capital
budgeting is done by calculating the payback period, accounting rate of return, and post-payback
period. On the other hand, modern or discounting method of capital budgeting includes
calculation of net present value (NPV), internal rate of return (IRR) and profitability index.
Paraphrase This Document
Need a fresh take? Get an instant paraphrase of this document with our AI Paraphraser
Financial Analysis 8
2. Analysis of Ford Motor Company and Tesla, Inc.
a. Betas of Ford Motor Company and Tesla Inc.
Betas (3 years monthly) of the above stated two companies are -
Ford Motor Company = 0.97 (finance.yahoo.com, 2019)
Tesla, Inc. = 0.03
Interpretation of Beta values
Beta stands as a measure of a company’s stock’s systematic risk or volatility compared to
the prevailing unsystematic risk in the entire market from where the company belongs. Beta
value is used to calculate the ERR (expected rate of return) of an asset under CAPM (capital
asset pricing model) and calculated the expected market return in relation to the asset.
The Beta value of Ford Motor Company, it is required to state that the stock of the
company does not swing more than the market over time and due to this, its Beta stands less than
1.0. It also represents that Ford’s stock(s) is less volatile in comparison to the market that means
investing in Ford is less risky than investing in other companies.
Similarly, the beta value of Tesla, Inc represents that the volatility of its stock is
extremely less in comparison to Ford’s stock as it stands at 0.03 and is very much more better
option for investors to invest in (finance.yahoo.com, 2019).
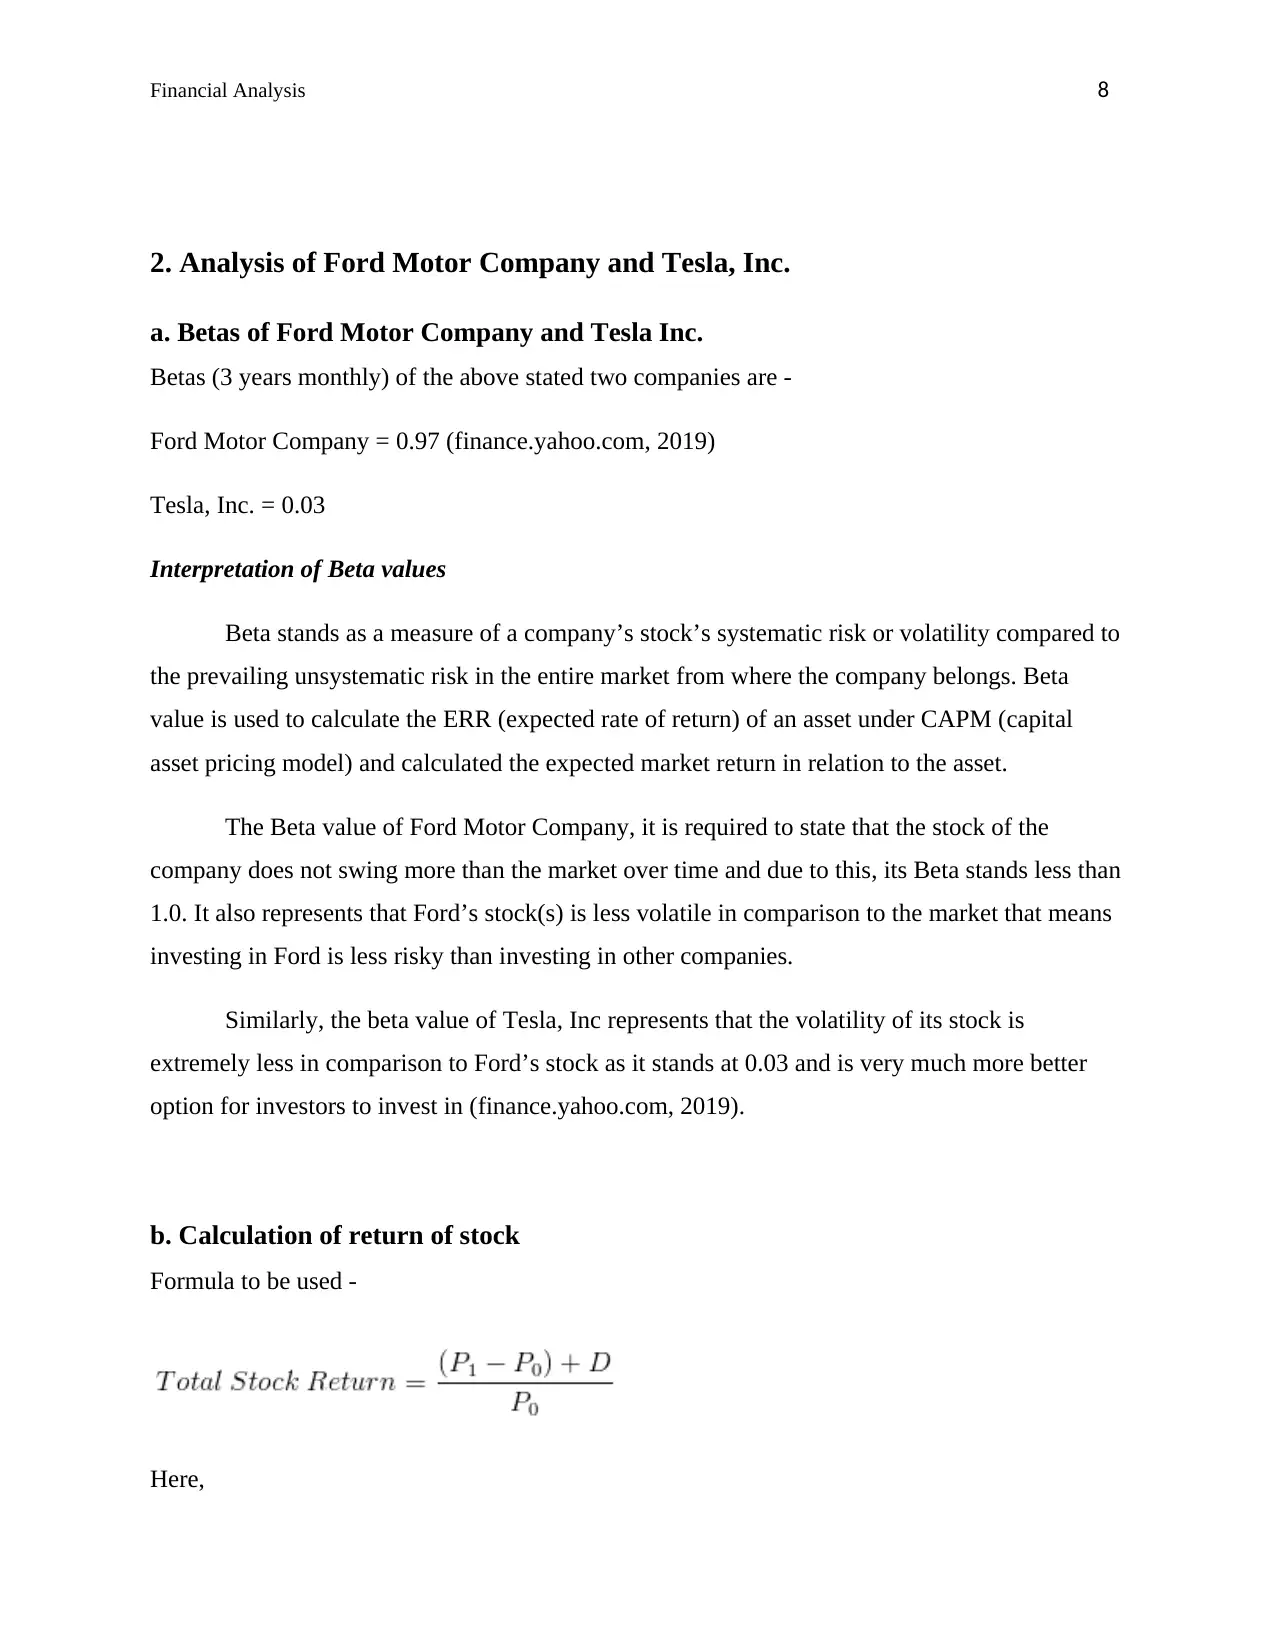
b. Calculation of return of stock
Formula to be used -
Here,
2. Analysis of Ford Motor Company and Tesla, Inc.
a. Betas of Ford Motor Company and Tesla Inc.
Betas (3 years monthly) of the above stated two companies are -
Ford Motor Company = 0.97 (finance.yahoo.com, 2019)
Tesla, Inc. = 0.03
Interpretation of Beta values
Beta stands as a measure of a company’s stock’s systematic risk or volatility compared to
the prevailing unsystematic risk in the entire market from where the company belongs. Beta
value is used to calculate the ERR (expected rate of return) of an asset under CAPM (capital
asset pricing model) and calculated the expected market return in relation to the asset.
The Beta value of Ford Motor Company, it is required to state that the stock of the
company does not swing more than the market over time and due to this, its Beta stands less than
1.0. It also represents that Ford’s stock(s) is less volatile in comparison to the market that means
investing in Ford is less risky than investing in other companies.
Similarly, the beta value of Tesla, Inc represents that the volatility of its stock is
extremely less in comparison to Ford’s stock as it stands at 0.03 and is very much more better
option for investors to invest in (finance.yahoo.com, 2019).
b. Calculation of return of stock
Formula to be used -
Here,
Financial Analysis 9
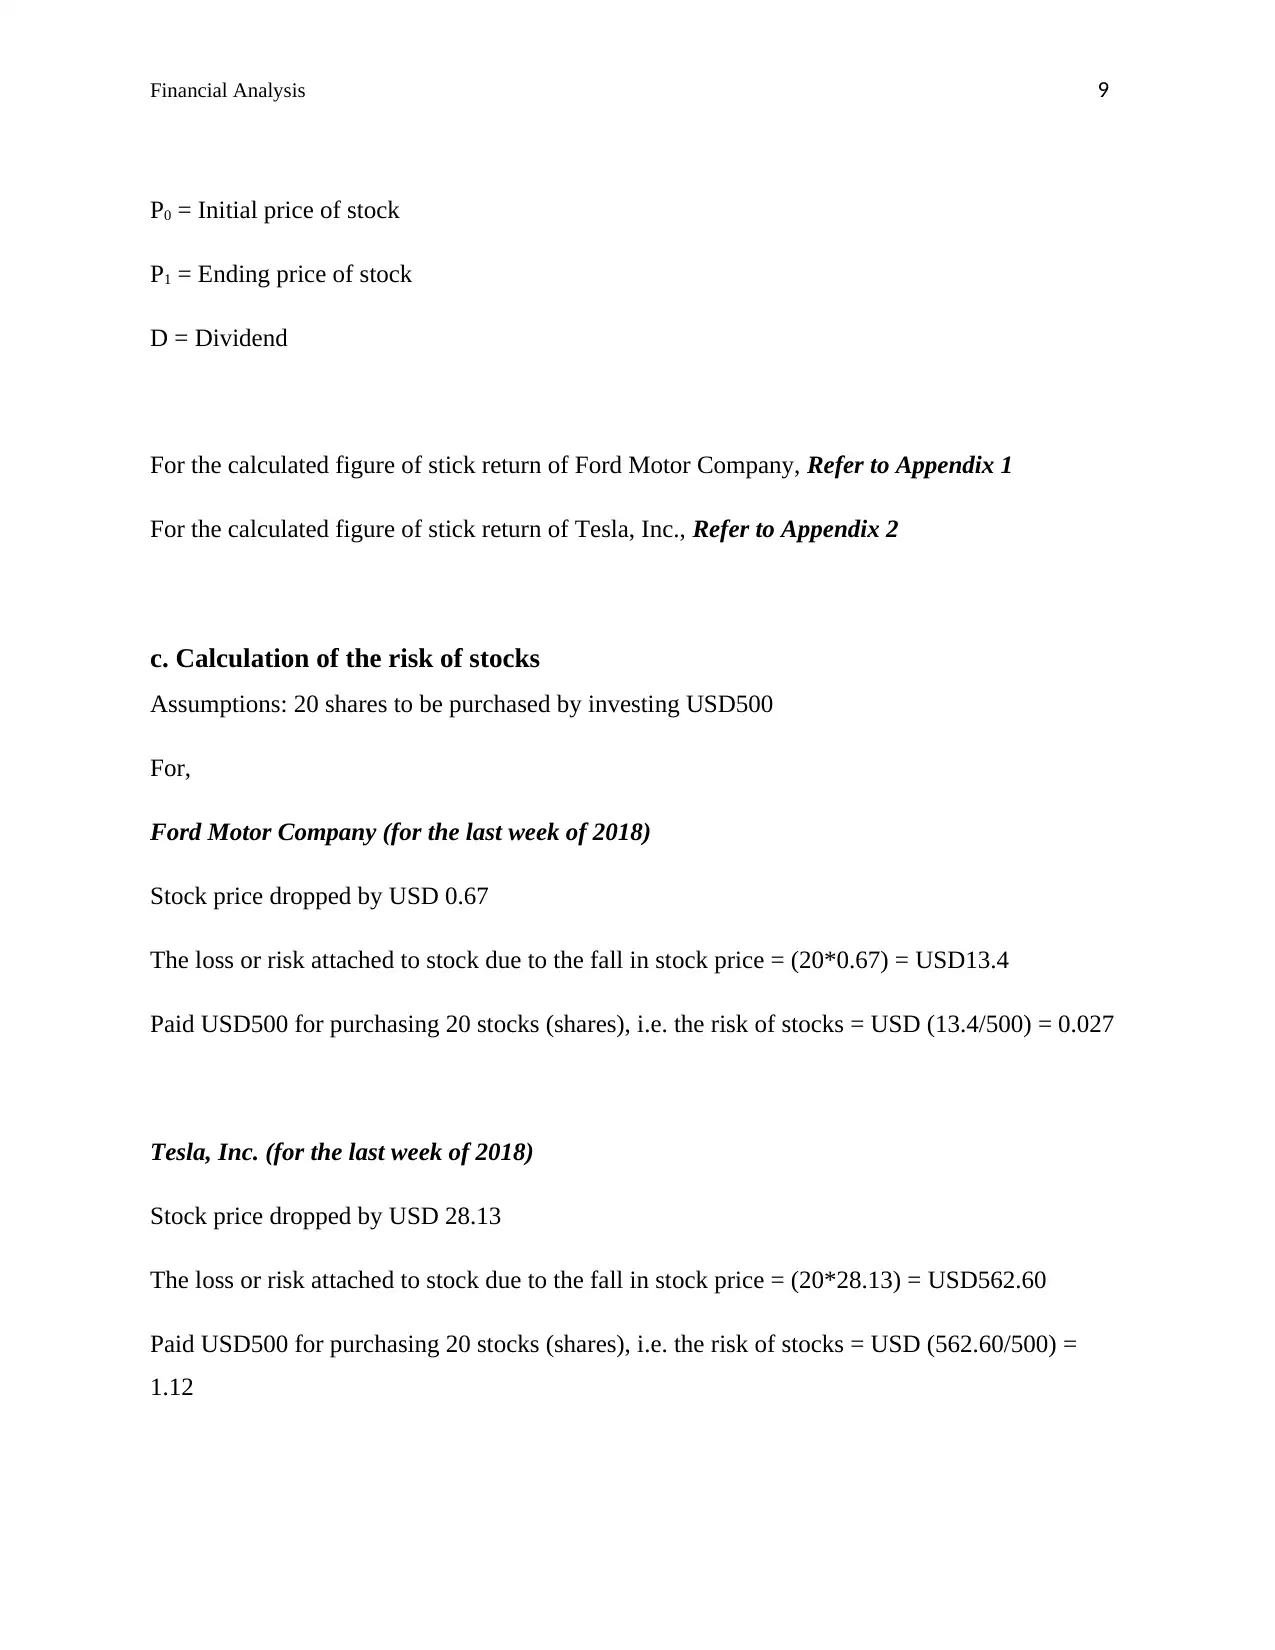
P0 = Initial price of stock
P1 = Ending price of stock
D = Dividend
For the calculated figure of stick return of Ford Motor Company, Refer to Appendix 1
For the calculated figure of stick return of Tesla, Inc., Refer to Appendix 2
c. Calculation of the risk of stocks
Assumptions: 20 shares to be purchased by investing USD500
For,
Ford Motor Company (for the last week of 2018)
Stock price dropped by USD 0.67
The loss or risk attached to stock due to the fall in stock price = (20*0.67) = USD13.4
Paid USD500 for purchasing 20 stocks (shares), i.e. the risk of stocks = USD (13.4/500) = 0.027
Tesla, Inc. (for the last week of 2018)
Stock price dropped by USD 28.13
The loss or risk attached to stock due to the fall in stock price = (20*28.13) = USD562.60
Paid USD500 for purchasing 20 stocks (shares), i.e. the risk of stocks = USD (562.60/500) =
1.12
⊘ This is a preview!⊘
Do you want full access?
Subscribe today to unlock all pages.
Trusted by 1+ million students worldwide
Financial Analysis 10
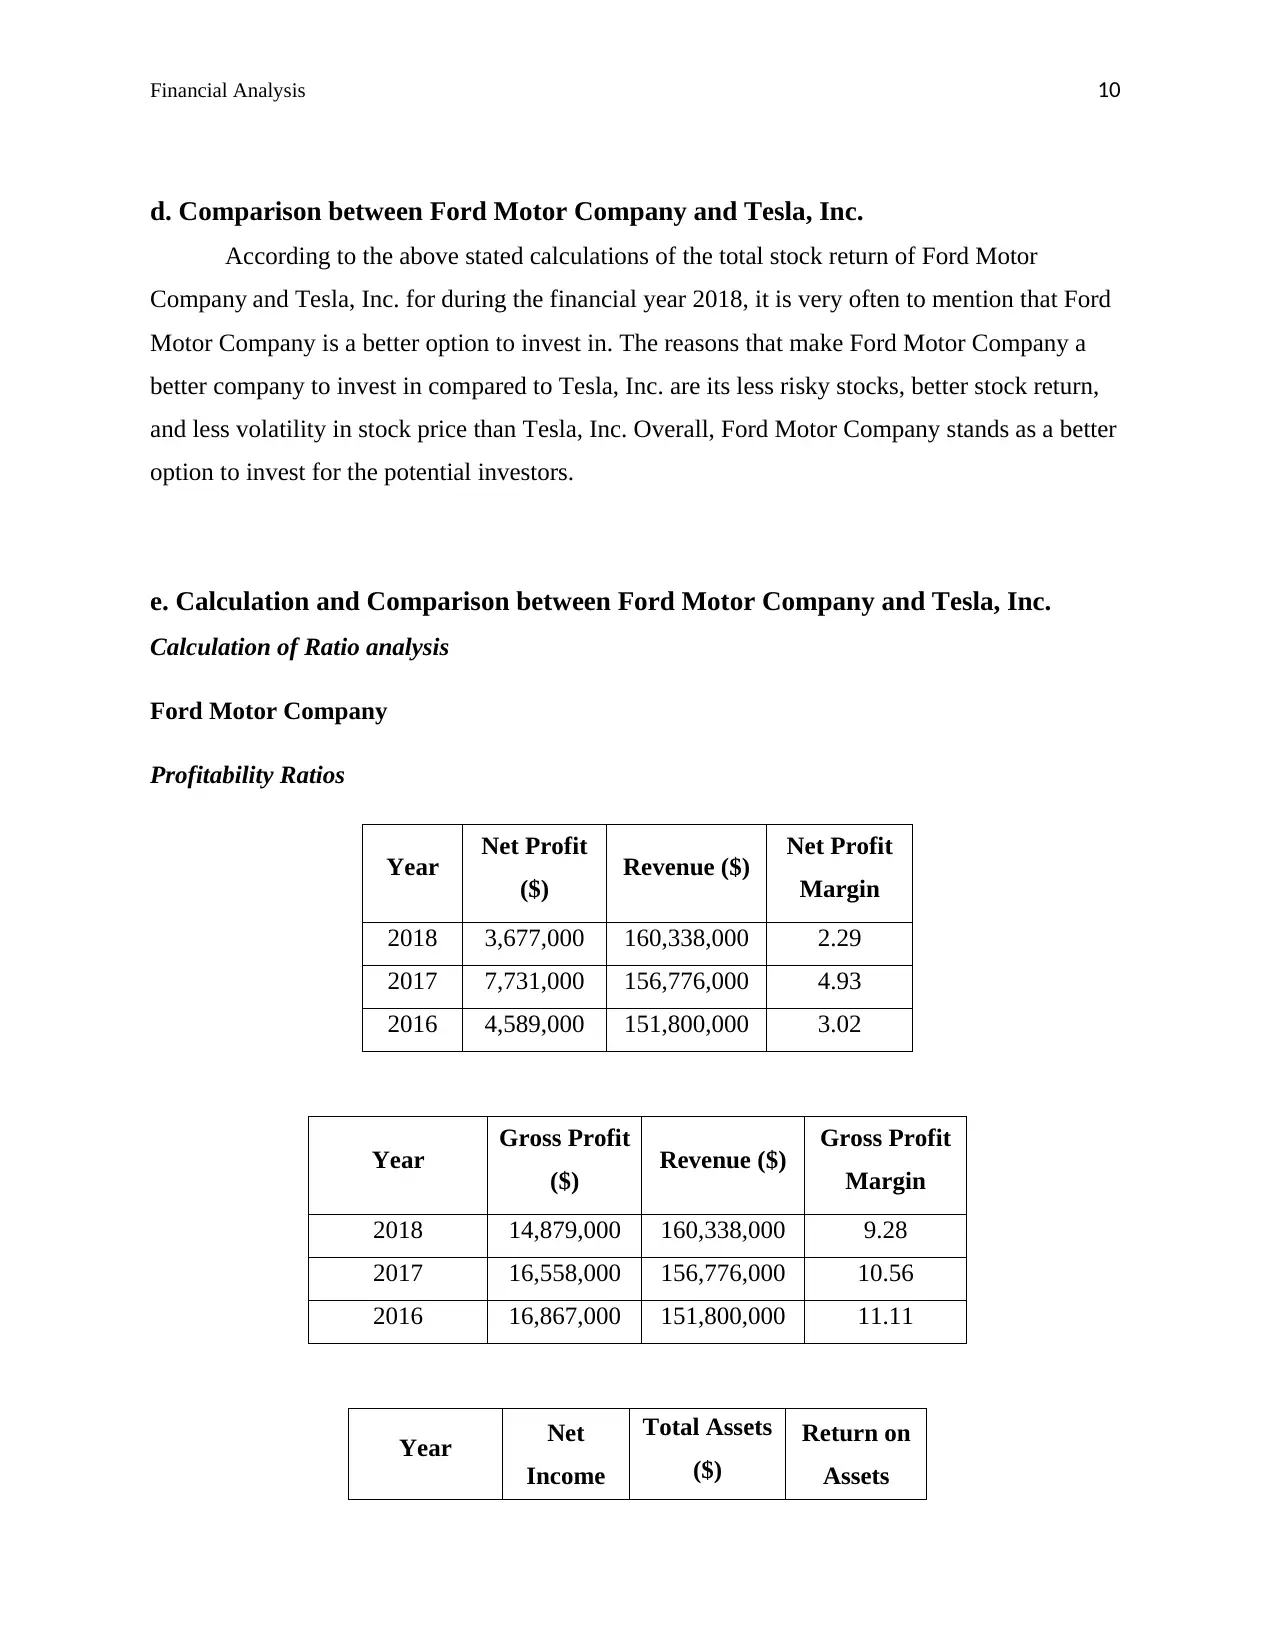
d. Comparison between Ford Motor Company and Tesla, Inc.
According to the above stated calculations of the total stock return of Ford Motor
Company and Tesla, Inc. for during the financial year 2018, it is very often to mention that Ford
Motor Company is a better option to invest in. The reasons that make Ford Motor Company a
better company to invest in compared to Tesla, Inc. are its less risky stocks, better stock return,
and less volatility in stock price than Tesla, Inc. Overall, Ford Motor Company stands as a better
option to invest for the potential investors.
e. Calculation and Comparison between Ford Motor Company and Tesla, Inc.
Calculation of Ratio analysis
Ford Motor Company
Profitability Ratios
Year Net Profit
($) Revenue ($) Net Profit
Margin
2018 3,677,000 160,338,000 2.29
2017 7,731,000 156,776,000 4.93
2016 4,589,000 151,800,000 3.02
Year Gross Profit
($) Revenue ($) Gross Profit
Margin
2018 14,879,000 160,338,000 9.28
2017 16,558,000 156,776,000 10.56
2016 16,867,000 151,800,000 11.11
Year Net
Income
Total Assets
($)
Return on
Assets
Paraphrase This Document
Need a fresh take? Get an instant paraphrase of this document with our AI Paraphraser
Financial Analysis 11
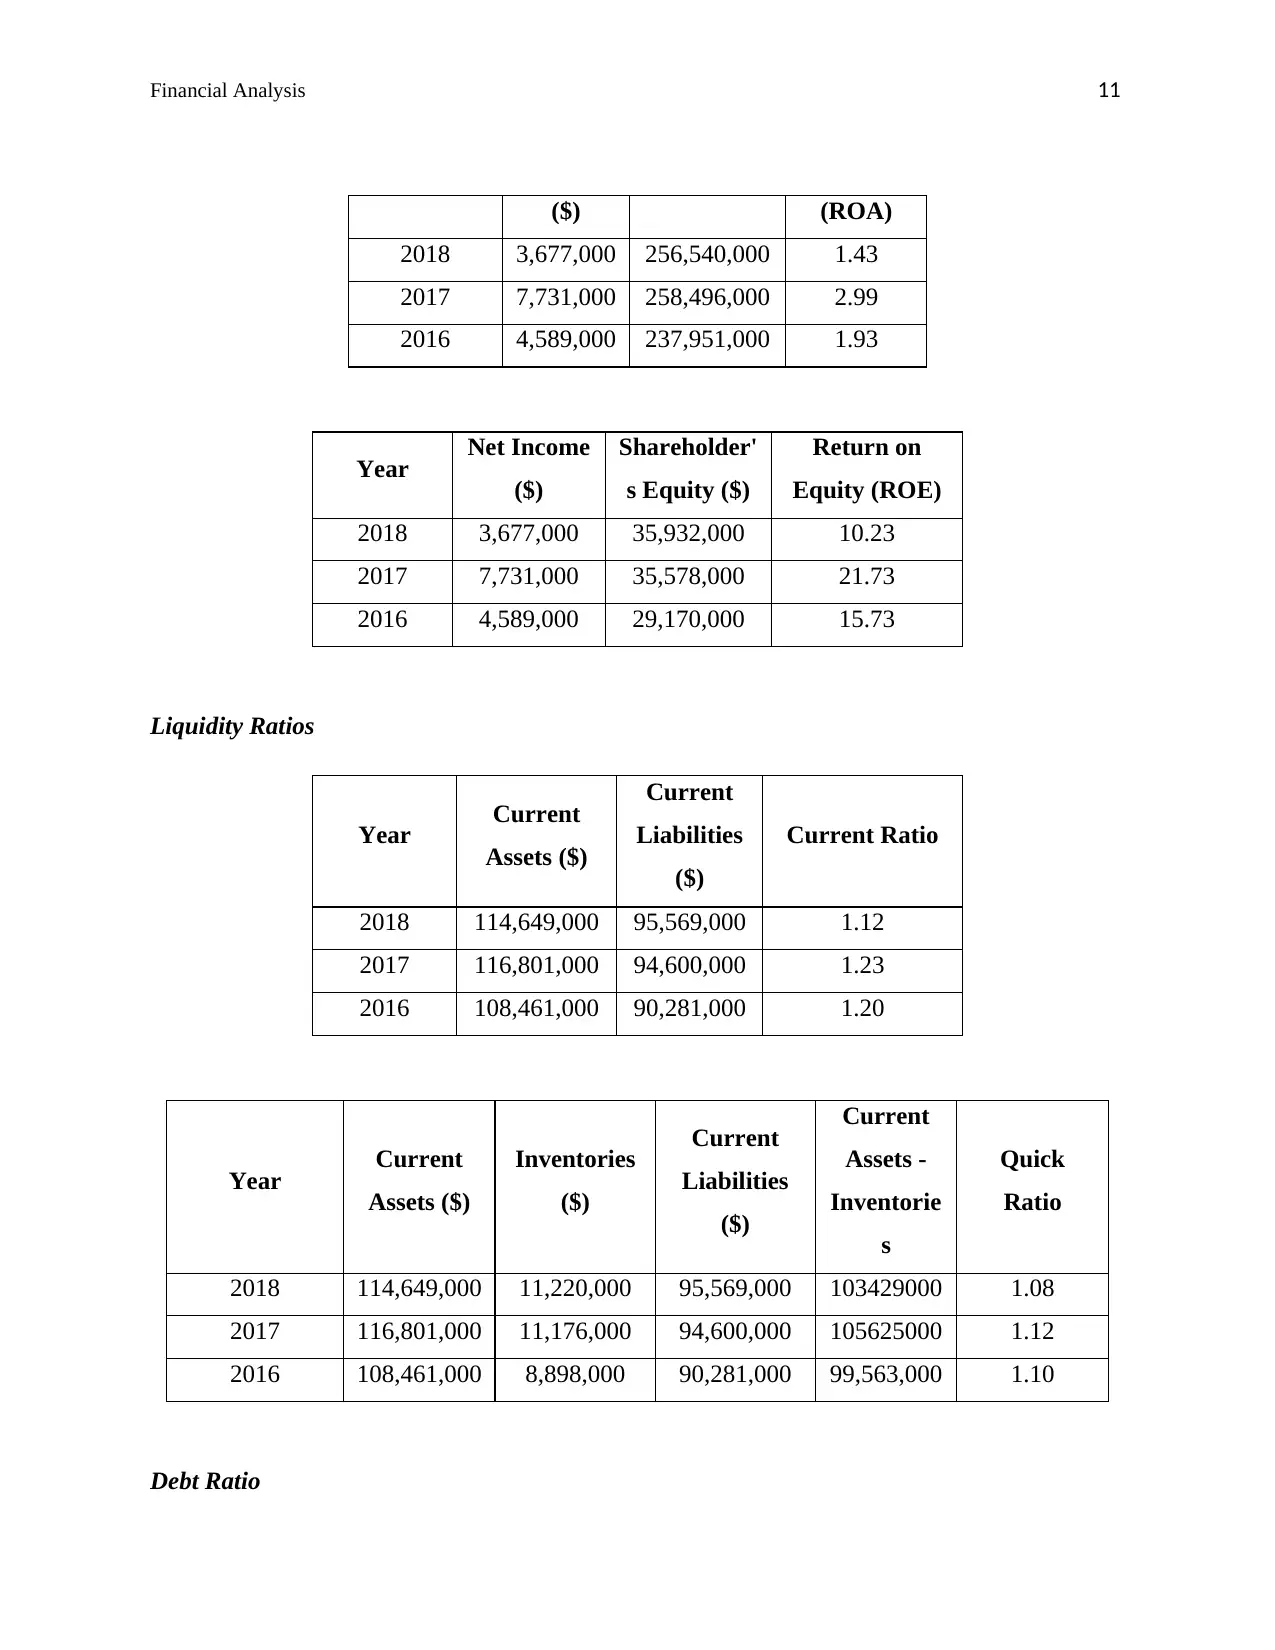
($) (ROA)
2018 3,677,000 256,540,000 1.43
2017 7,731,000 258,496,000 2.99
2016 4,589,000 237,951,000 1.93
Year Net Income
($)
Shareholder'
s Equity ($)
Return on
Equity (ROE)
2018 3,677,000 35,932,000 10.23
2017 7,731,000 35,578,000 21.73
2016 4,589,000 29,170,000 15.73
Liquidity Ratios
Year Current
Assets ($)
Current
Liabilities
($)
Current Ratio
2018 114,649,000 95,569,000 1.12
2017 116,801,000 94,600,000 1.23
2016 108,461,000 90,281,000 1.20
Year Current
Assets ($)
Inventories
($)
Current
Liabilities
($)
Current
Assets -
Inventorie
s
Quick
Ratio
2018 114,649,000 11,220,000 95,569,000 103429000 1.08
2017 116,801,000 11,176,000 94,600,000 105625000 1.12
2016 108,461,000 8,898,000 90,281,000 99,563,000 1.10
Debt Ratio
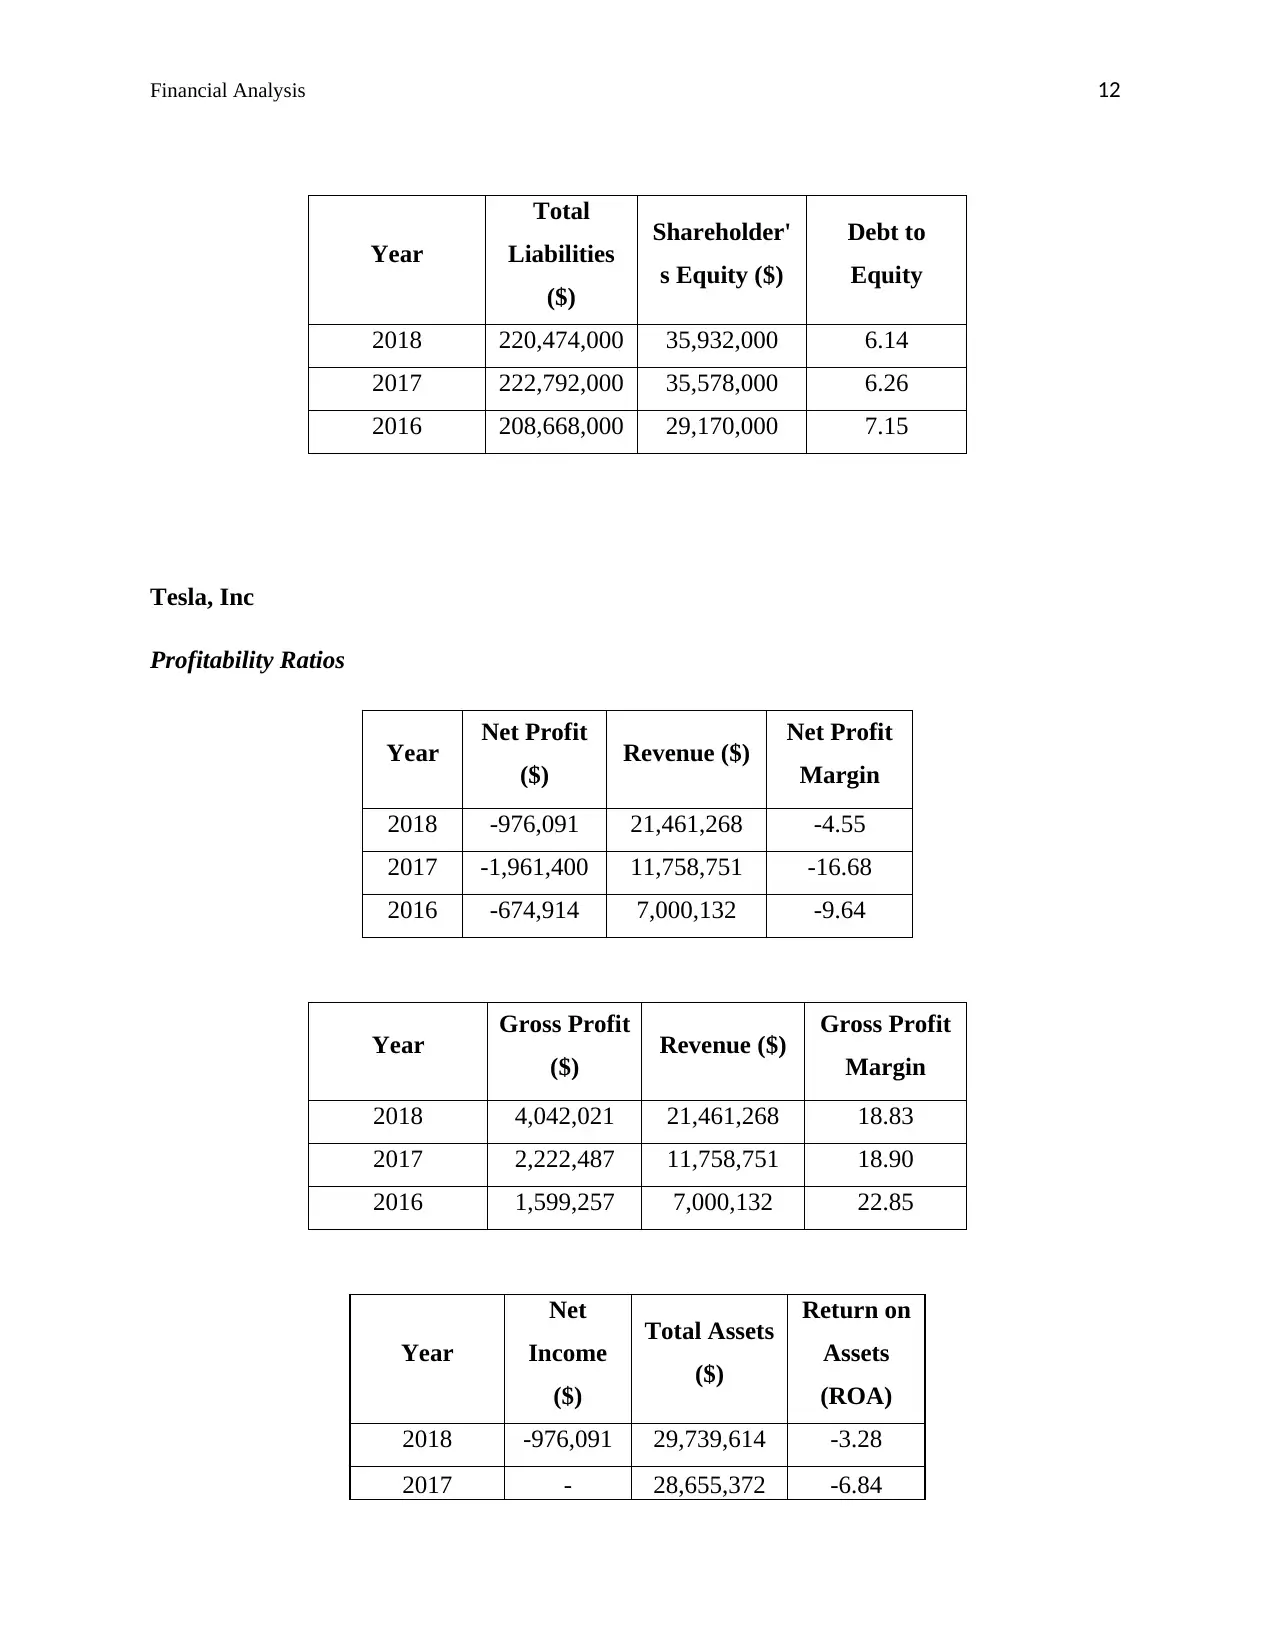
Financial Analysis 12
Year
Total
Liabilities
($)
Shareholder'
s Equity ($)
Debt to
Equity
2018 220,474,000 35,932,000 6.14
2017 222,792,000 35,578,000 6.26
2016 208,668,000 29,170,000 7.15
Tesla, Inc
Profitability Ratios
Year Net Profit
($) Revenue ($) Net Profit
Margin
2018 -976,091 21,461,268 -4.55
2017 -1,961,400 11,758,751 -16.68
2016 -674,914 7,000,132 -9.64
Year Gross Profit
($) Revenue ($) Gross Profit
Margin
2018 4,042,021 21,461,268 18.83
2017 2,222,487 11,758,751 18.90
2016 1,599,257 7,000,132 22.85
Year
Net
Income
($)
Total Assets
($)
Return on
Assets
(ROA)
2018 -976,091 29,739,614 -3.28
2017 - 28,655,372 -6.84
Year
Total
Liabilities
($)
Shareholder'
s Equity ($)
Debt to
Equity
2018 220,474,000 35,932,000 6.14
2017 222,792,000 35,578,000 6.26
2016 208,668,000 29,170,000 7.15
Tesla, Inc
Profitability Ratios
Year Net Profit
($) Revenue ($) Net Profit
Margin
2018 -976,091 21,461,268 -4.55
2017 -1,961,400 11,758,751 -16.68
2016 -674,914 7,000,132 -9.64
Year Gross Profit
($) Revenue ($) Gross Profit
Margin
2018 4,042,021 21,461,268 18.83
2017 2,222,487 11,758,751 18.90
2016 1,599,257 7,000,132 22.85
Year
Net
Income
($)
Total Assets
($)
Return on
Assets
(ROA)
2018 -976,091 29,739,614 -3.28
2017 - 28,655,372 -6.84
⊘ This is a preview!⊘
Do you want full access?
Subscribe today to unlock all pages.
Trusted by 1+ million students worldwide
1 out of 24


Your All-in-One AI-Powered Toolkit for Academic Success.
+13062052269
info@desklib.com
Available 24*7 on WhatsApp / Email
![[object Object]](/_next/static/media/star-bottom.7253800d.svg)
Unlock your academic potential
Copyright © 2020–2026 A2Z Services. All Rights Reserved. Developed and managed by ZUCOL.