ACC701: Financial Analysis Report - Globe International Limited
VerifiedAdded on 2023/01/05
|25
|6229
|62
Report
AI Summary
This report presents a comprehensive financial analysis of Globe International Limited, evaluating its performance through ratio analysis and trend analysis. The analysis covers key financial areas including profitability, liquidity, efficiency, and solvency, providing insights into the company's financial health from 2014 to 2018. The report examines profitability ratios (net margin, gross margin), liquidity ratios (current ratio, equity ratio), efficiency ratios (inventory turnover, credit period), and solvency ratios (debt ratio, interest time). It compares the company's performance against industry averages and offers recommendations for improvement. Trend analysis is also conducted to identify patterns and predict future performance. The report includes financial statements, ratio analysis calculations, and trend analysis data in the appendices, providing a detailed assessment of the company's financial standing and potential areas for strategic decision-making.
Running head: REPORT 0
ACCOUNTS FOR MANAGERS
SEPTEMBER 10, 2019
STUDENT DETAILS:
ACCOUNTS FOR MANAGERS
SEPTEMBER 10, 2019
STUDENT DETAILS:
Paraphrase This Document
Need a fresh take? Get an instant paraphrase of this document with our AI Paraphraser
REPORT 1
Executive summary
The financial strength of business is main concern for the business owners, investors,
managers as well as lenders. The cost control as well as efficiency is essential for success in
various organisations throughout the world. There are various manners to evaluate financial
strength of the organisation. The key is recognising correct measurement devices for the
corporation, taking into consideration, the sector, life cycle’s stage, time-horizon, objectives of
business, as well as financial condition. It is significant to understand the financial performance
of company relative to the industry as all corporations compete in the market on regional,
central, domestic, or global level. Generally, the financial strength of the entity may be evaluated
in 3 main areas: profitability, solvency as well as liquidity. The purpose and significance of ratio
analysis are to assess financial performance of entity in terms of risks, Profitability, efficiency as
well as solvency. The trend analysis looks at the performance of company over time (not only 1
year) and states whether an entity is improving or reducing in performance. The trend
analysis needs the business owner to calculate ratio over various business years. In the following
parts, the ratio analysis and trend analysis of Globe International Limited is discussed and
examined.
REPORT 2
Contents
Introduction......................................................................................................................................3
Ratio analysis...................................................................................................................................3
Profitability Ratios.......................................................................................................................4
Liquidity ratios.............................................................................................................................5
Efficiency ratio.............................................................................................................................6
Solvency ratios.............................................................................................................................8
Trend analysis-.................................................................................................................................9
Conclusion.....................................................................................................................................10
References......................................................................................................................................11
Appendix 1: Financial statements..................................................................................................13
Appendix 2: Ratio analysis............................................................................................................15
Appendix 3: Trend analysis...........................................................................................................16
⊘ This is a preview!⊘
Do you want full access?
Subscribe today to unlock all pages.
Trusted by 1+ million students worldwide
REPORT 3
Introduction
The financial analysis is a very important process. It can be used to determine the
corporation’s performance as per the balance sheet, cash flow as well as income statement of
company by the trend analysis as well as ratio analysis. A major objective of financial analysis is
to assess liquidity, solvency, stability as well as profitability of the corporation to confirm
financial investments. The financial analysis is used to evaluate the financial trends, financial
policies, and the long-term plans for the business functions. It is also used in identifying best
projects for the investment. The financial analysis is helpful to render the relevant information to
company’s stakeholders in taking good decision. The company’s management is liable for taking
decision as well as making plan and strategy for the upcoming period. Some areas are required to
be concerned by the company to enhance the financial health of corporation. This report states
financial strength of Globe International Limited by trend analysis as well as ratio analysis. The
following parts also discuss the recommendations for necessary changes.
Ratio analysis
The ratio analysis is assessment of financial performance of the corporation regarding
various bases like liquidity, solvency, and profitability, efficiency as well as efficiency ratios. It
is quantitative analysis of the information included in financial statement of the corporation. it is
helpful for comparing the trend of two or more entity over time. The ratio analysis provides the
idea to the investor in relation to the financial position of entity (Alexander, 2011). By
conducting the ratio analysis, the comparison can be made between data of one company can be
Paraphrase This Document
Need a fresh take? Get an instant paraphrase of this document with our AI Paraphraser
REPORT 4
made to competitor or industry’s data (Al Quait and Doherty, 2016). With the help of ratio
analysis, we interpret the numbers from the balance sheet and income statements. Every
stakeholders have numerous interests while this comes to an outcome from financial such as
equity investor is interested in development of the dividend payment as well as earning powers
of company in long-term. The ratios are mentioned below-
Profitability Ratios
The profitability examines earning ability or ability to get positive net earning for a given
level of sales or investments. While company is not profitable or cost effective, in that case the
corporation finally becomes bankrupt. The profit margin ratio can be considered as best example
of financial ratio. The profitability ratio assesses the net income the company gets relative to the
sales made by the corporation. The net profit margin is considered as main standard for the
investors that help in making the investment in the business for evaluating the financial condition
of company. The profitability ratio is so advantageous to assess the total profitability of
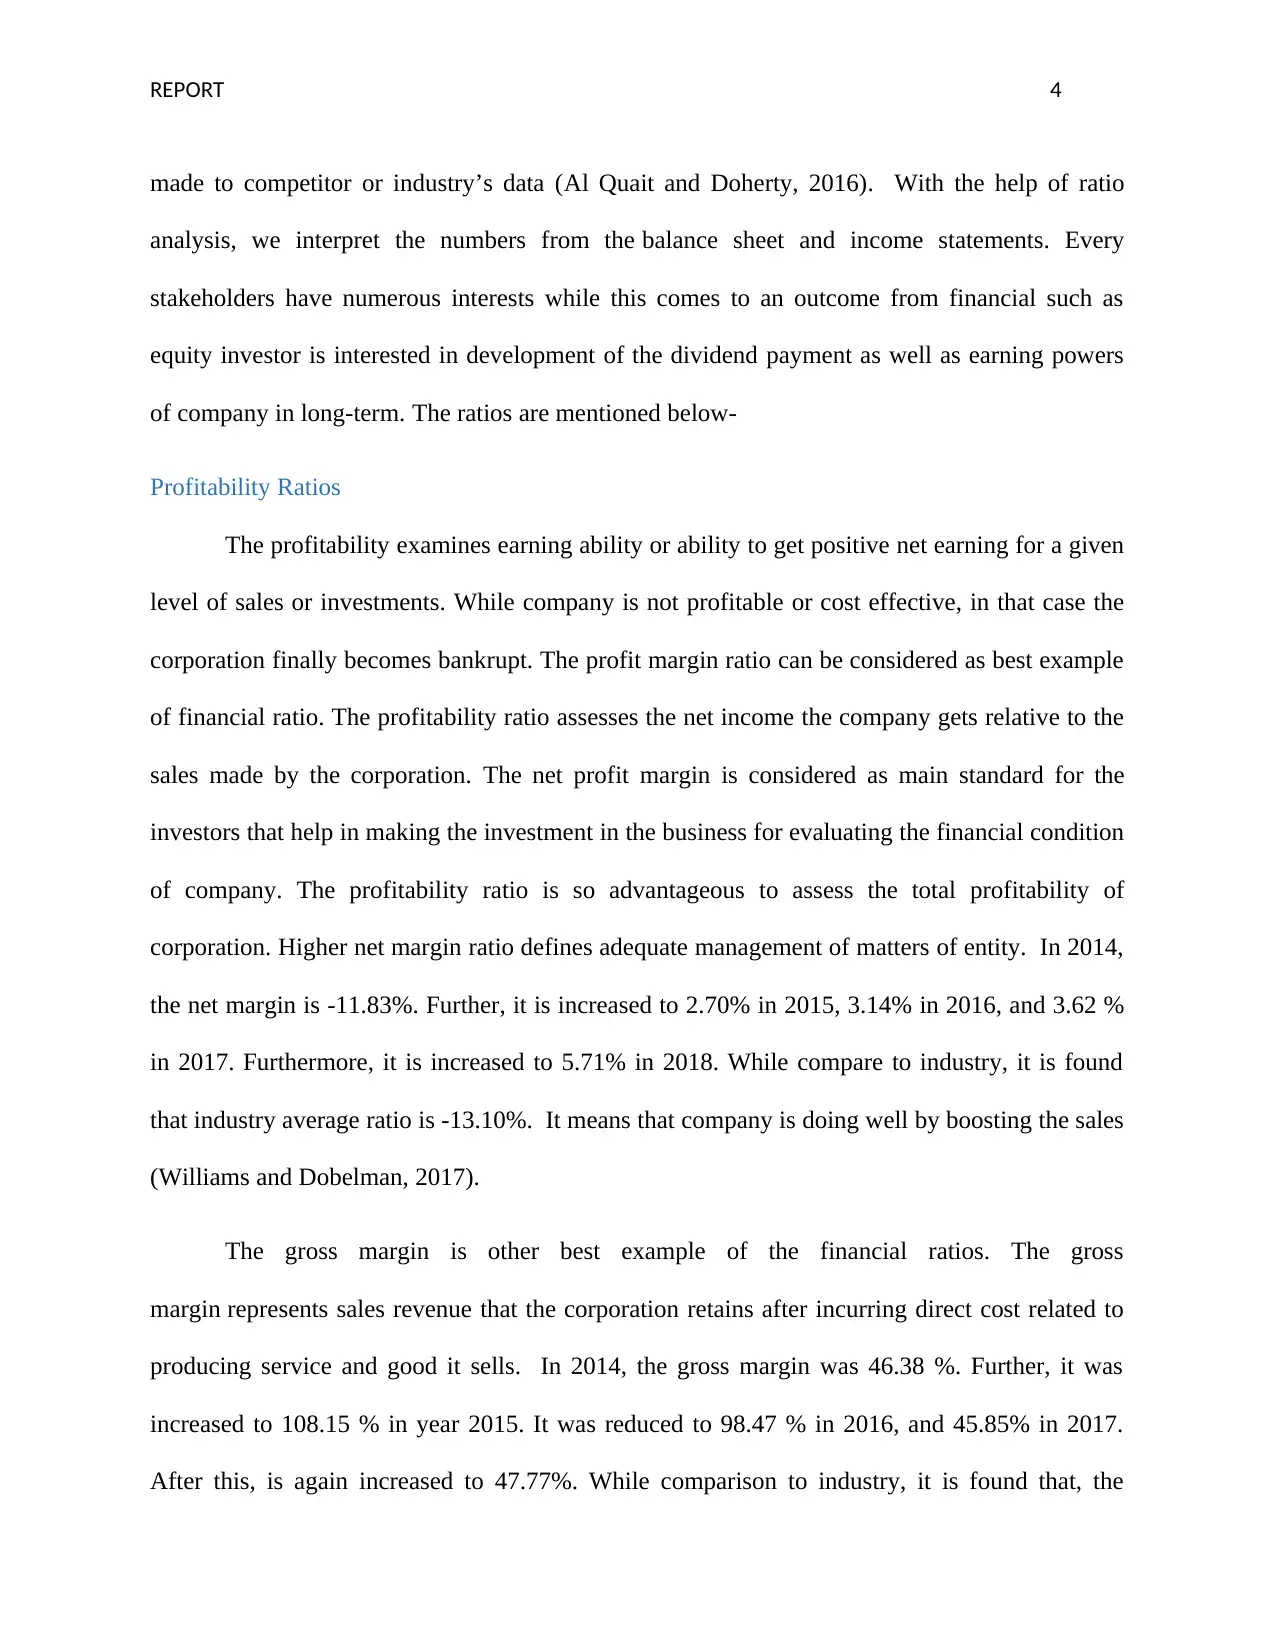
corporation. Higher net margin ratio defines adequate management of matters of entity. In 2014,
the net margin is -11.83%. Further, it is increased to 2.70% in 2015, 3.14% in 2016, and 3.62 %
in 2017. Furthermore, it is increased to 5.71% in 2018. While compare to industry, it is found
that industry average ratio is -13.10%. It means that company is doing well by boosting the sales
(Williams and Dobelman, 2017).
The gross margin is other best example of the financial ratios. The gross
margin represents sales revenue that the corporation retains after incurring direct cost related to
producing service and good it sells. In 2014, the gross margin was 46.38 %. Further, it was
increased to 108.15 % in year 2015. It was reduced to 98.47 % in 2016, and 45.85% in 2017.
After this, is again increased to 47.77%. While comparison to industry, it is found that, the
made to competitor or industry’s data (Al Quait and Doherty, 2016). With the help of ratio
analysis, we interpret the numbers from the balance sheet and income statements. Every
stakeholders have numerous interests while this comes to an outcome from financial such as
equity investor is interested in development of the dividend payment as well as earning powers
of company in long-term. The ratios are mentioned below-
Profitability Ratios
The profitability examines earning ability or ability to get positive net earning for a given
level of sales or investments. While company is not profitable or cost effective, in that case the
corporation finally becomes bankrupt. The profit margin ratio can be considered as best example
of financial ratio. The profitability ratio assesses the net income the company gets relative to the
sales made by the corporation. The net profit margin is considered as main standard for the
investors that help in making the investment in the business for evaluating the financial condition
of company. The profitability ratio is so advantageous to assess the total profitability of
corporation. Higher net margin ratio defines adequate management of matters of entity. In 2014,
the net margin is -11.83%. Further, it is increased to 2.70% in 2015, 3.14% in 2016, and 3.62 %
in 2017. Furthermore, it is increased to 5.71% in 2018. While compare to industry, it is found
that industry average ratio is -13.10%. It means that company is doing well by boosting the sales
(Williams and Dobelman, 2017).
The gross margin is other best example of the financial ratios. The gross
margin represents sales revenue that the corporation retains after incurring direct cost related to
producing service and good it sells. In 2014, the gross margin was 46.38 %. Further, it was
increased to 108.15 % in year 2015. It was reduced to 98.47 % in 2016, and 45.85% in 2017.
After this, is again increased to 47.77%. While comparison to industry, it is found that, the
REPORT 5
industry average ratio is 48.54%. It can see that the unmanaged gross margin can be losing
money for the company. The company should maintain the gross margin high to pay the fixed
overhead expenses such as rent, payroll, as well as utilities.
Liquidity ratios
The liquidity assesses ability of the corporation for utilising the current sources for
fulfilling the short-term requirements. While the corporation cannot meet short term obligation
timely, after that this finally becomes insolvent. An entity can need liquidation or reorganisation.
A high ratio of current sources to short-term obligations defines the solider the entity (Moolman,
2017).
For evaluating the company’s liquidity position, the ratios like current ratio as well as
equity ratio of the corporation are defined to search the capability of company to provide the
current liabilities in excess of current assets. Current ratio is considered as working-capital ratio.
A current ratio assesses the business ability for fulfilling the short-term due in the year. This ratio
includes weights of current asset v. liabilities. It examines current assets size to size of current
liabilities. The current ratio defines best financial condition of the corporation. This also defines
⊘ This is a preview!⊘
Do you want full access?
Subscribe today to unlock all pages.
Trusted by 1+ million students worldwide
REPORT 6
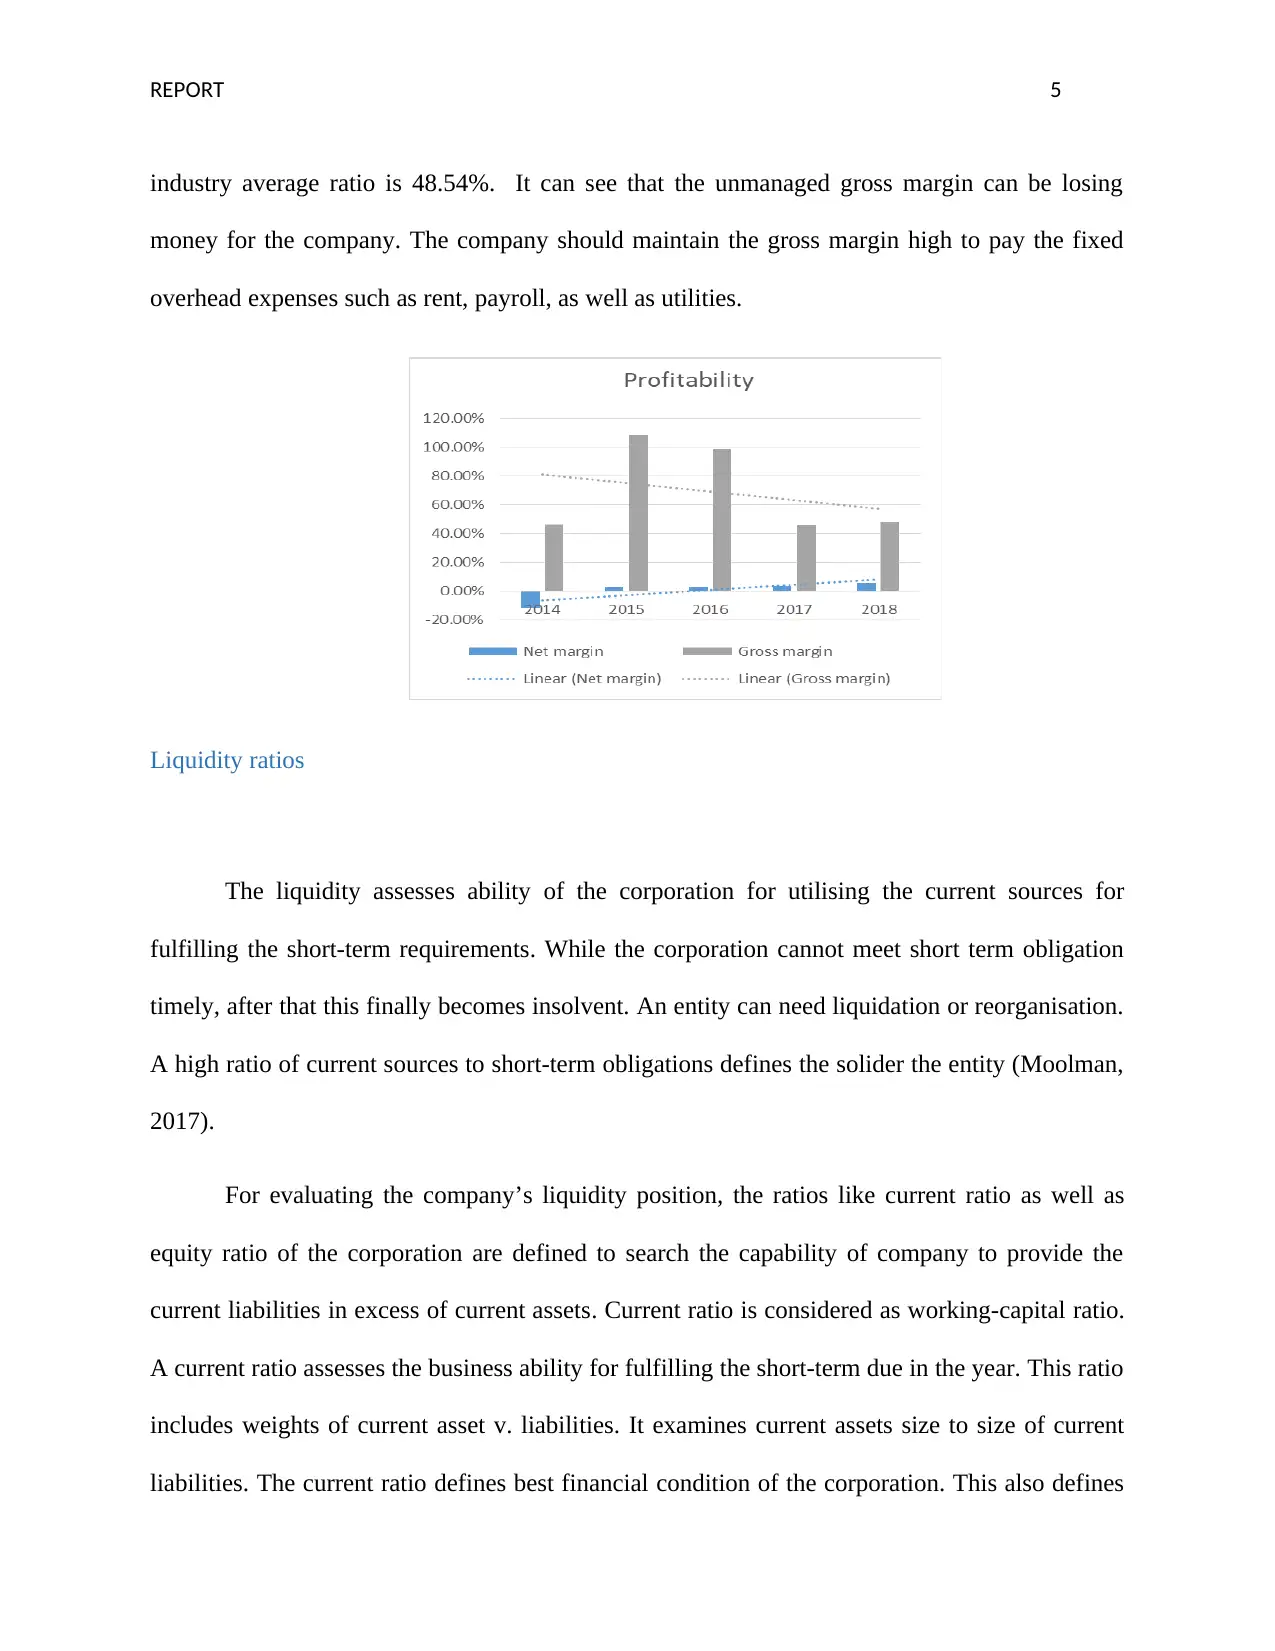
the procedure of improvements in liquidity of current asset to the debts. It is required that the
current ratio must be in a ratio of 2:1. However, in 2014 current ratio of Globe International
Limited was 1. It came to 2 in 2015, 2016 and 2017. Further, it is also increased to 3 in year
2018. The industry average ratio is 2.28. It means that the current ratio of company is
satisfactory. This increasing value of current ratio states more liquid of capability of company for
paying the current obligation timely.
Moreover, the equity ratio is the financial ratio stating relative equity’s amount utilised to
finance the assets of company. The higher equity ratio or the shareholder’s higher contribution to
capital states the best long-term solvency situation of company. On the other hand, the lower
equity ratio involves the high risk to creditors. The equity ratio of company is 0.52 in 2014.
Further, it is reduced to 0.49 in 2015 and again it is increased to 0.52 in 2016. It is more
increased to 0.58 in 2017, and then decreased to 0.56 in 2018. The company is more required to
increase equity ratio to make it easy for the corporation to get loan from bank as well as different
financial organisations (Caudron, et. al, 2018).
Paraphrase This Document
Need a fresh take? Get an instant paraphrase of this document with our AI Paraphraser
REPORT 7
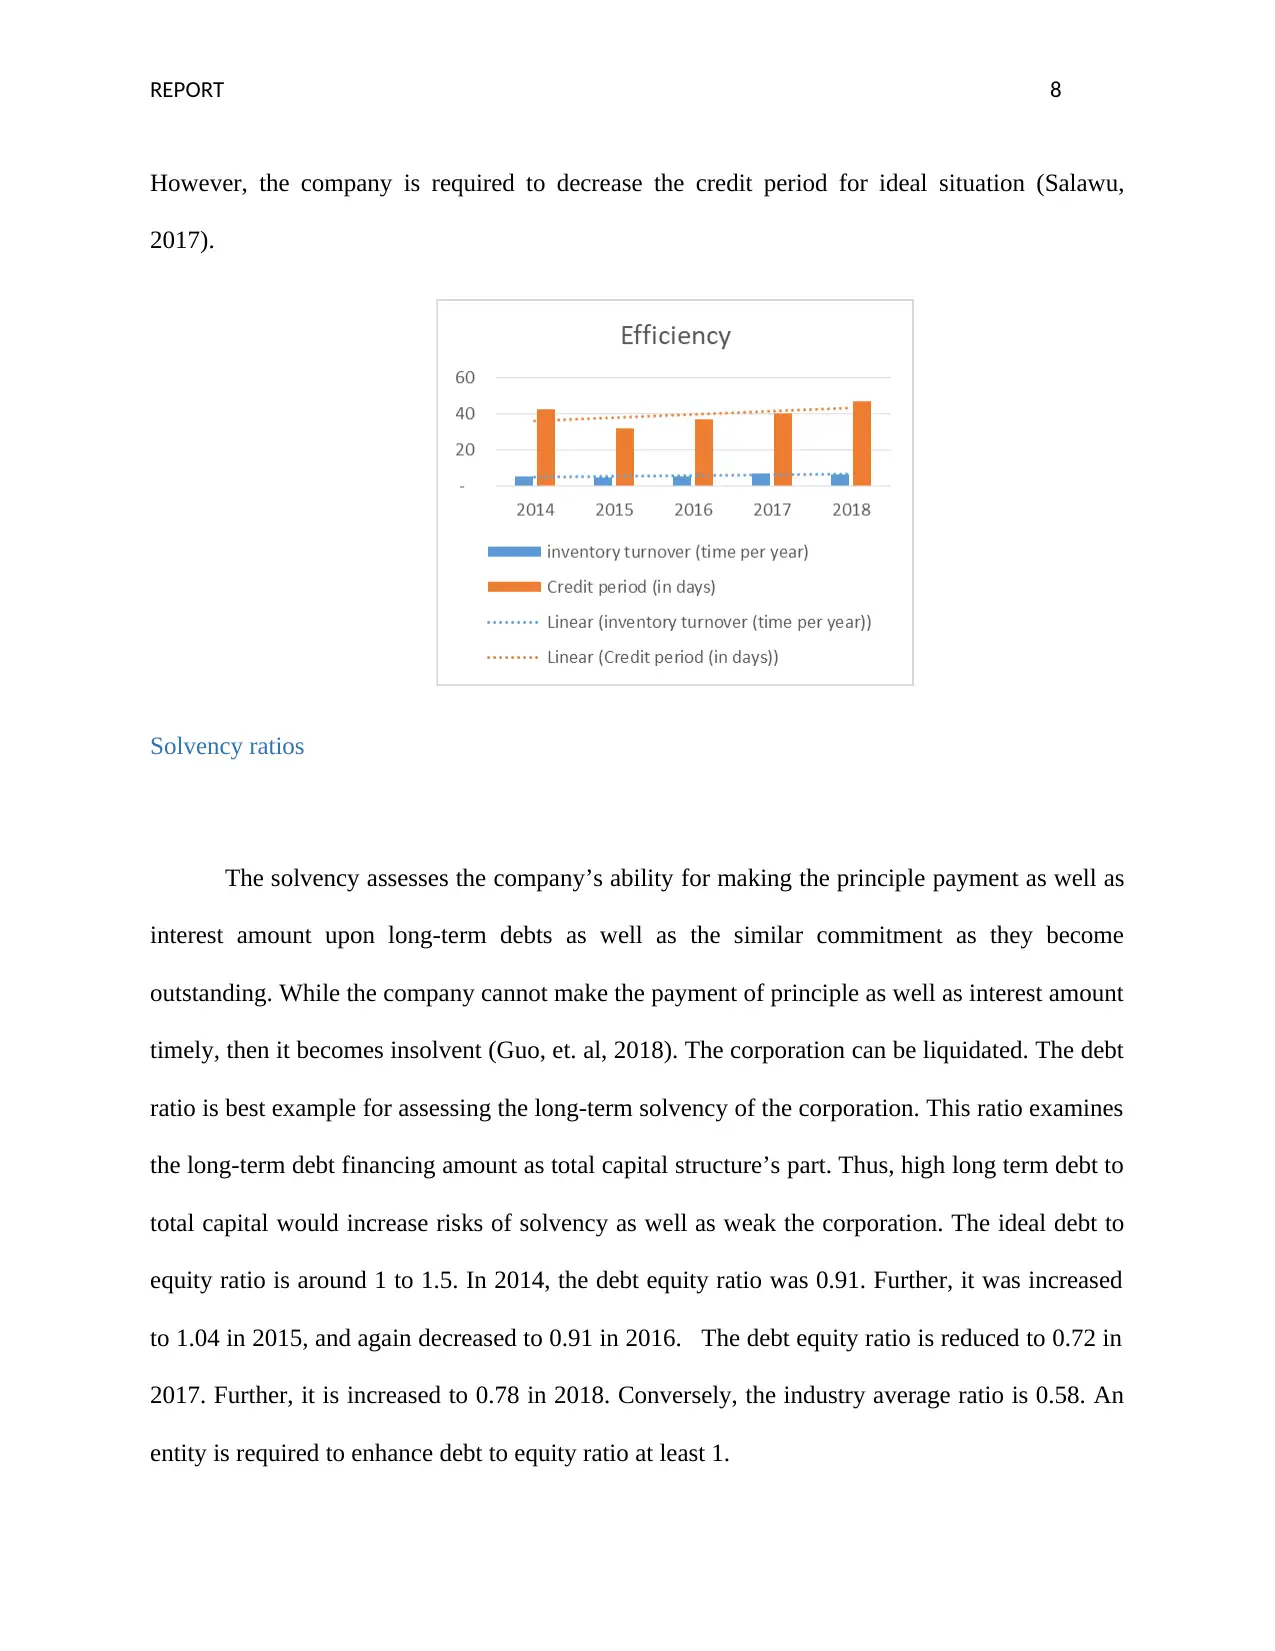
Efficiency ratio
The efficiency ratios can be useful for assessment because these ratios assess capability
of corporation for utilising assets and sources. The efficiency ratios include inventory turnover
ratio as well as credit period (Vogel, 2014). The inventory turnover ratio is considered as ratio
that tells that how many times corporation has replaced as well as sold inventory within given
period. The inventory turnover ratio can be helpful for the business for making good decision
related to manufacturing, purchase, costing as well as marketing the inventories. It is examined
by the inventory turnover that how quick the corporation sells inventory and how analysts make
the comparison of this to the industry’s average. The low inventory turnover ratio states the
weaker sale as well as possibly excess stocks. In contradiction of this, the higher inventory
turnover ratio states the inadequate inventories or stronger sale. In year 2014 and 2015, the
inventory turnover ratio was 5 times. It was increased to 5.34 in 2016. It is more increased to
6.71 in 2017. Furthermore, it is slightly decreased to 6.39 in 2018. The company is required to
decrease the cost as well as end the stagnant inventories. This is also needed to enhance the
supply chain (Bartram, Brown and Fehle, 2019).
Further, the credit period is considered as number of the days that the customers are
permitted to wait before making payment of invoice. The credit period can be considered as the
average collection period. The short collection period is ideal period. In 2014, it was 42 days. It
was decreased to 32 days in 2015. It was again improved to thirty seven days in 2016.
Furthermore, this was more improved to 40.40 days in 2017 and 47.08 days in 2018. It means
that this is not ideal situation for the company. The industry average ratio is 52.24 days.
REPORT 8
However, the company is required to decrease the credit period for ideal situation (Salawu,
2017).
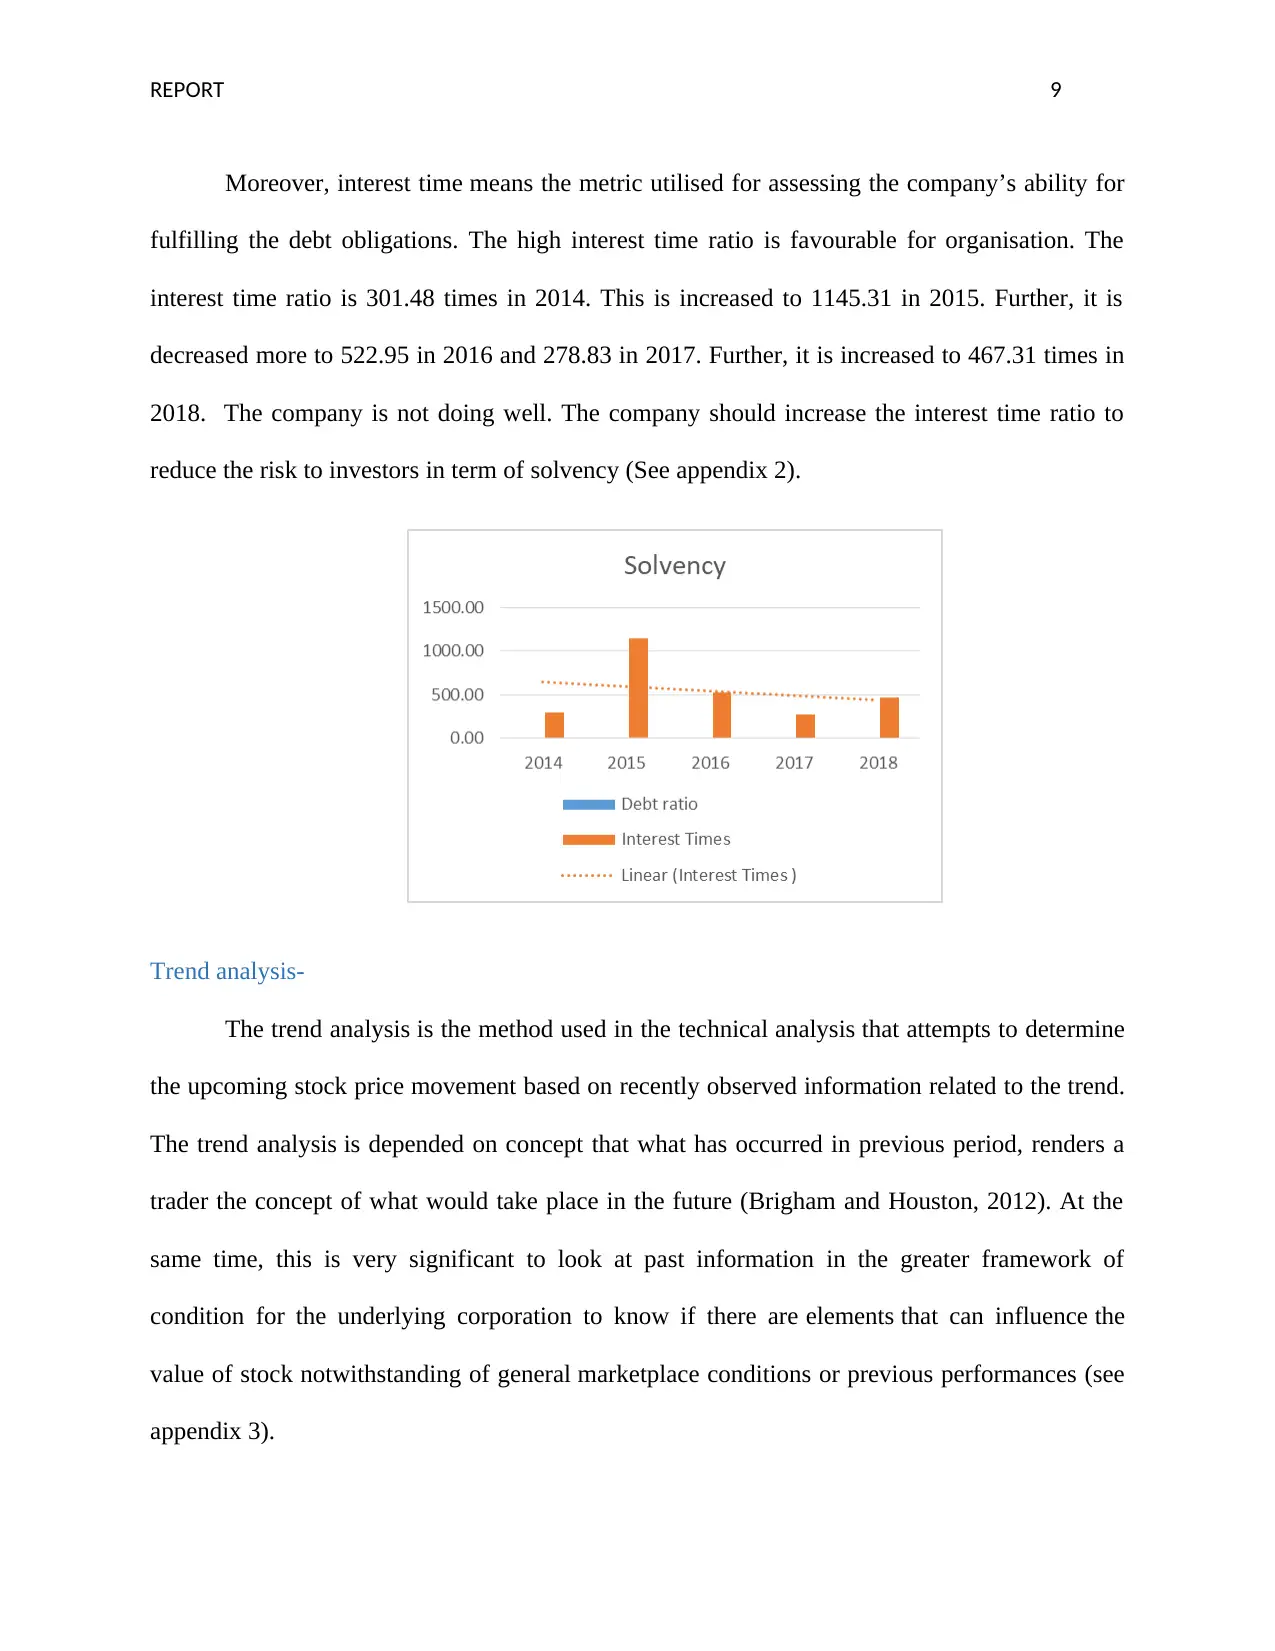
Solvency ratios
The solvency assesses the company’s ability for making the principle payment as well as
interest amount upon long-term debts as well as the similar commitment as they become
outstanding. While the company cannot make the payment of principle as well as interest amount
timely, then it becomes insolvent (Guo, et. al, 2018). The corporation can be liquidated. The debt
ratio is best example for assessing the long-term solvency of the corporation. This ratio examines
the long-term debt financing amount as total capital structure’s part. Thus, high long term debt to
total capital would increase risks of solvency as well as weak the corporation. The ideal debt to
equity ratio is around 1 to 1.5. In 2014, the debt equity ratio was 0.91. Further, it was increased
to 1.04 in 2015, and again decreased to 0.91 in 2016. The debt equity ratio is reduced to 0.72 in
2017. Further, it is increased to 0.78 in 2018. Conversely, the industry average ratio is 0.58. An
entity is required to enhance debt to equity ratio at least 1.
However, the company is required to decrease the credit period for ideal situation (Salawu,
2017).
Solvency ratios
The solvency assesses the company’s ability for making the principle payment as well as
interest amount upon long-term debts as well as the similar commitment as they become
outstanding. While the company cannot make the payment of principle as well as interest amount
timely, then it becomes insolvent (Guo, et. al, 2018). The corporation can be liquidated. The debt
ratio is best example for assessing the long-term solvency of the corporation. This ratio examines
the long-term debt financing amount as total capital structure’s part. Thus, high long term debt to
total capital would increase risks of solvency as well as weak the corporation. The ideal debt to
equity ratio is around 1 to 1.5. In 2014, the debt equity ratio was 0.91. Further, it was increased
to 1.04 in 2015, and again decreased to 0.91 in 2016. The debt equity ratio is reduced to 0.72 in
2017. Further, it is increased to 0.78 in 2018. Conversely, the industry average ratio is 0.58. An
entity is required to enhance debt to equity ratio at least 1.
⊘ This is a preview!⊘
Do you want full access?
Subscribe today to unlock all pages.
Trusted by 1+ million students worldwide
REPORT 9
Moreover, interest time means the metric utilised for assessing the company’s ability for
fulfilling the debt obligations. The high interest time ratio is favourable for organisation. The
interest time ratio is 301.48 times in 2014. This is increased to 1145.31 in 2015. Further, it is
decreased more to 522.95 in 2016 and 278.83 in 2017. Further, it is increased to 467.31 times in
2018. The company is not doing well. The company should increase the interest time ratio to
reduce the risk to investors in term of solvency (See appendix 2).
Trend analysis-
The trend analysis is the method used in the technical analysis that attempts to determine
the upcoming stock price movement based on recently observed information related to the trend.
The trend analysis is depended on concept that what has occurred in previous period, renders a
trader the concept of what would take place in the future (Brigham and Houston, 2012). At the
same time, this is very significant to look at past information in the greater framework of
condition for the underlying corporation to know if there are elements that can influence the
value of stock notwithstanding of general marketplace conditions or previous performances (see
appendix 3).
Paraphrase This Document
Need a fresh take? Get an instant paraphrase of this document with our AI Paraphraser
REPORT 10
Conclusion
In conclusion, it can say that the financial analyses are very important method for
evaluating financial position of corporation effectively. By financial analysis, health of
corporation may be decided in proper manner. It also develops how corporation runs the
businesses. In this way, it is recommended to conclude the analysis of financial statement is only
a device at the time of taking the decisions related to investment. The financial strength of
business is main issue to the business proprietor, directors, the depositor, as well as lenders. The
cost control and effectiveness are very significant for getting the success. With the help of the
financial analysis, the managers can also make and apply the approaches in upcoming period.
However, this is very important to have the knowledge in relation to the shortcomings of the
financial analysis. The financial statement analysis does not provide the answer to all the
questions of users. It normally makes additional queries. From above calculation, it is clear that
there are mixed results. It is required to assess financial statement’s quality. This is suggested to
evaluate current profitability as well as the related risk.
REPORT 11
References
Al Quait, A. and Doherty, P. (2016) Year-by-year trend analysis in modifiable risk factors
reduction after completing cardiac rehabilitation across different age groups: 58. European
Journal of Preventive Cardiology, 23(1).
Alexander, C. (2011) Market models: A guide to financial data analysis. USA: John Wiley &
Sons.
Bartram, S. M., Brown, G. W., and Fehle, F. R. (2019) International evidence on financial
derivatives usage. Financial management, 38(1), pp. 185-206.
Brigham, E. F., and Houston, J. F. (2012) Fundamentals of financial management. UK: Cengage
Learning.
Caudron, C., White, R. S., Green, R. G., Woods, J., Ágústsdóttir, T., Donaldson, C., and
Brandsdóttir, B. (2018) Seismic Amplitude Ratio Analysis of the 2014–2015 Bár arbunga‐
Holuhraun Dike Propagation and Eruption. Journal of Geophysical Research: Solid
Earth, 123(1), pp. 264-276.
Guo, T., Xie, L., Zhao, J., Song, W., Dai, W., Liu, F., Zheng, Y. and Xu, Y. (2018) Trend
analysis of morbidity and mortality of colorectal cancer in China from 1988 to 2009. Zhonghua
wei chang wai ke za zhi= Chinese journal of gastrointestinal surgery, 21(1), pp.33-40.
Moolman, A.M. (2017) The Usefulness Of Analytical Procedures, Other Than Ratio And Trend
Analysis, For Auditor Decisions. The International Business & Economics Research Journal
(Online), 16(3), p.171.
⊘ This is a preview!⊘
Do you want full access?
Subscribe today to unlock all pages.
Trusted by 1+ million students worldwide
1 out of 25
Related Documents


Your All-in-One AI-Powered Toolkit for Academic Success.
+13062052269
info@desklib.com
Available 24*7 on WhatsApp / Email
![[object Object]](/_next/static/media/star-bottom.7253800d.svg)
Unlock your academic potential
Copyright © 2020–2026 A2Z Services. All Rights Reserved. Developed and managed by ZUCOL.