Financial Analysis Report on New Talisman Gold Mines Limited
VerifiedAdded on 2020/05/16
|16
|2359
|120
Report
AI Summary
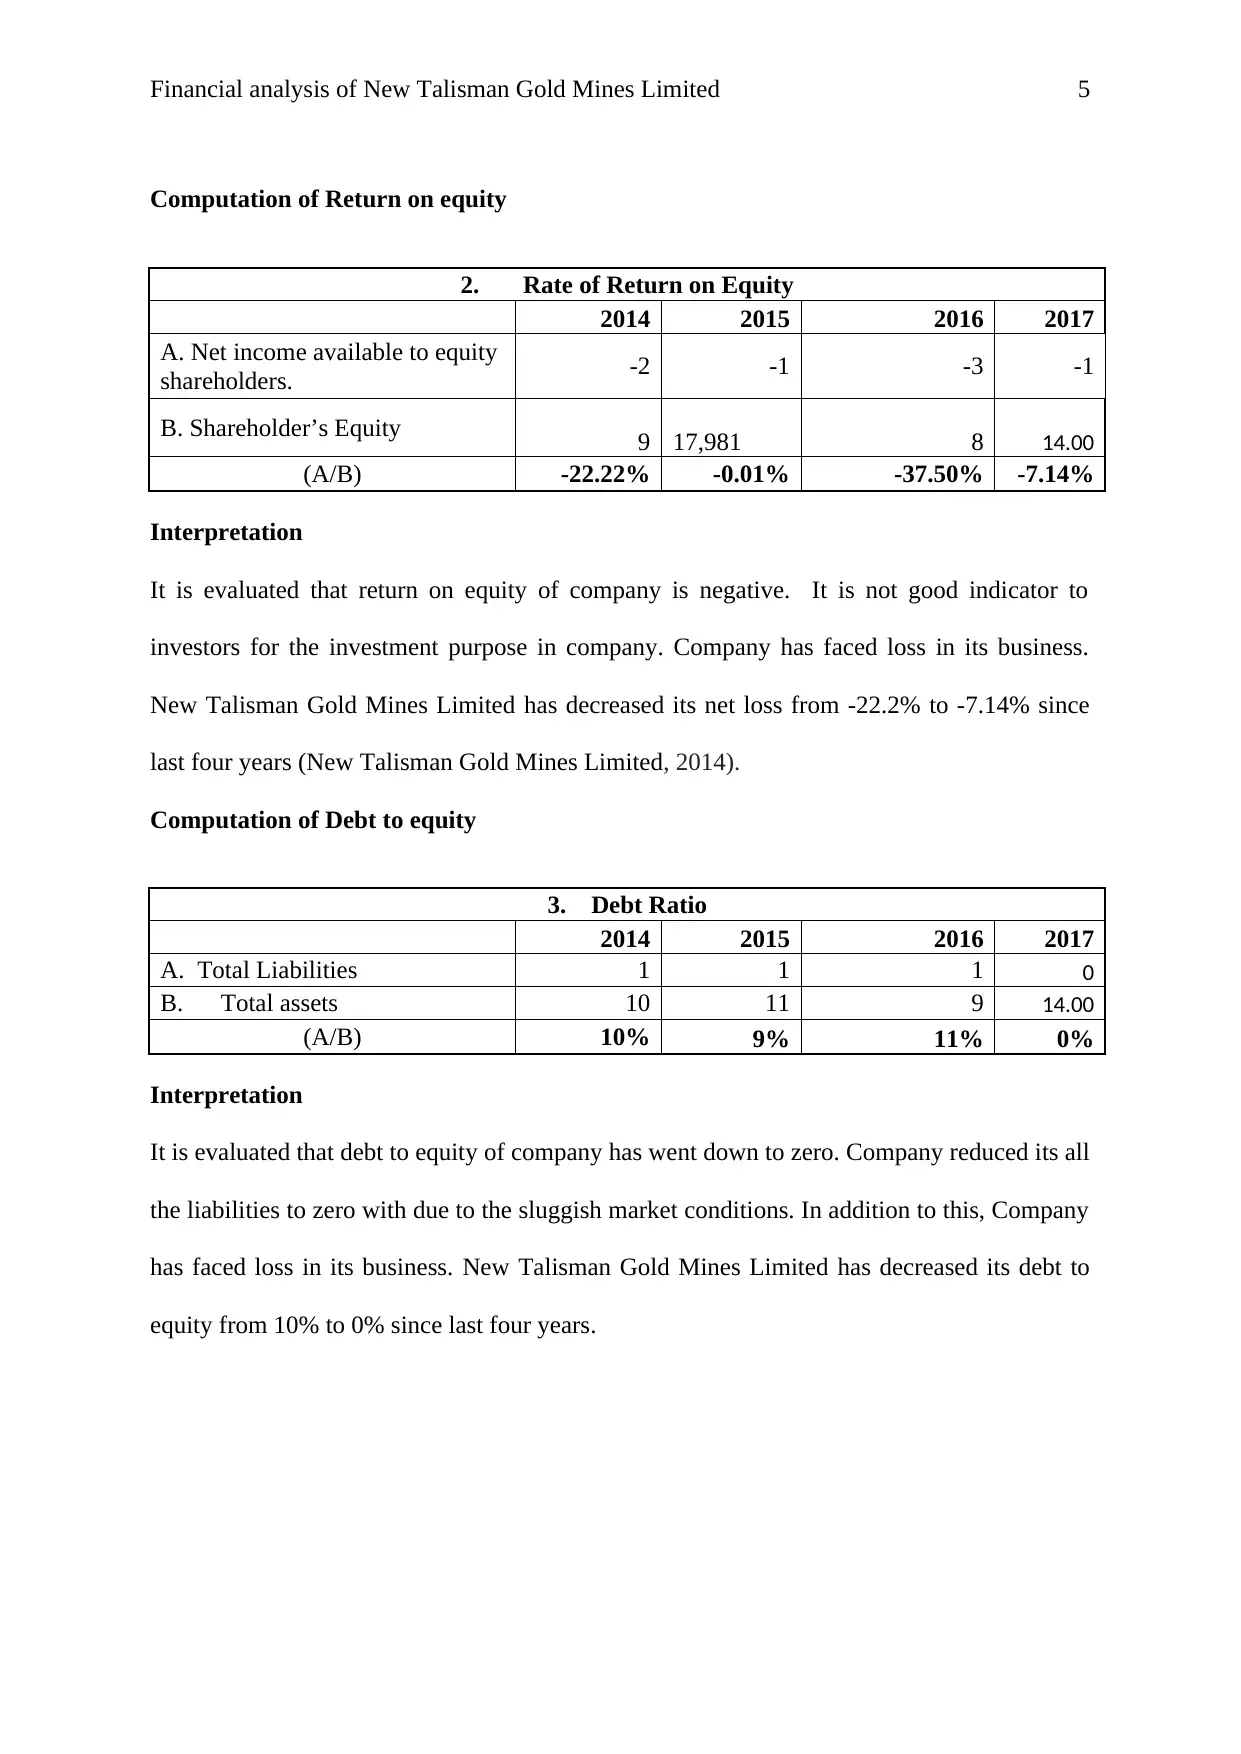
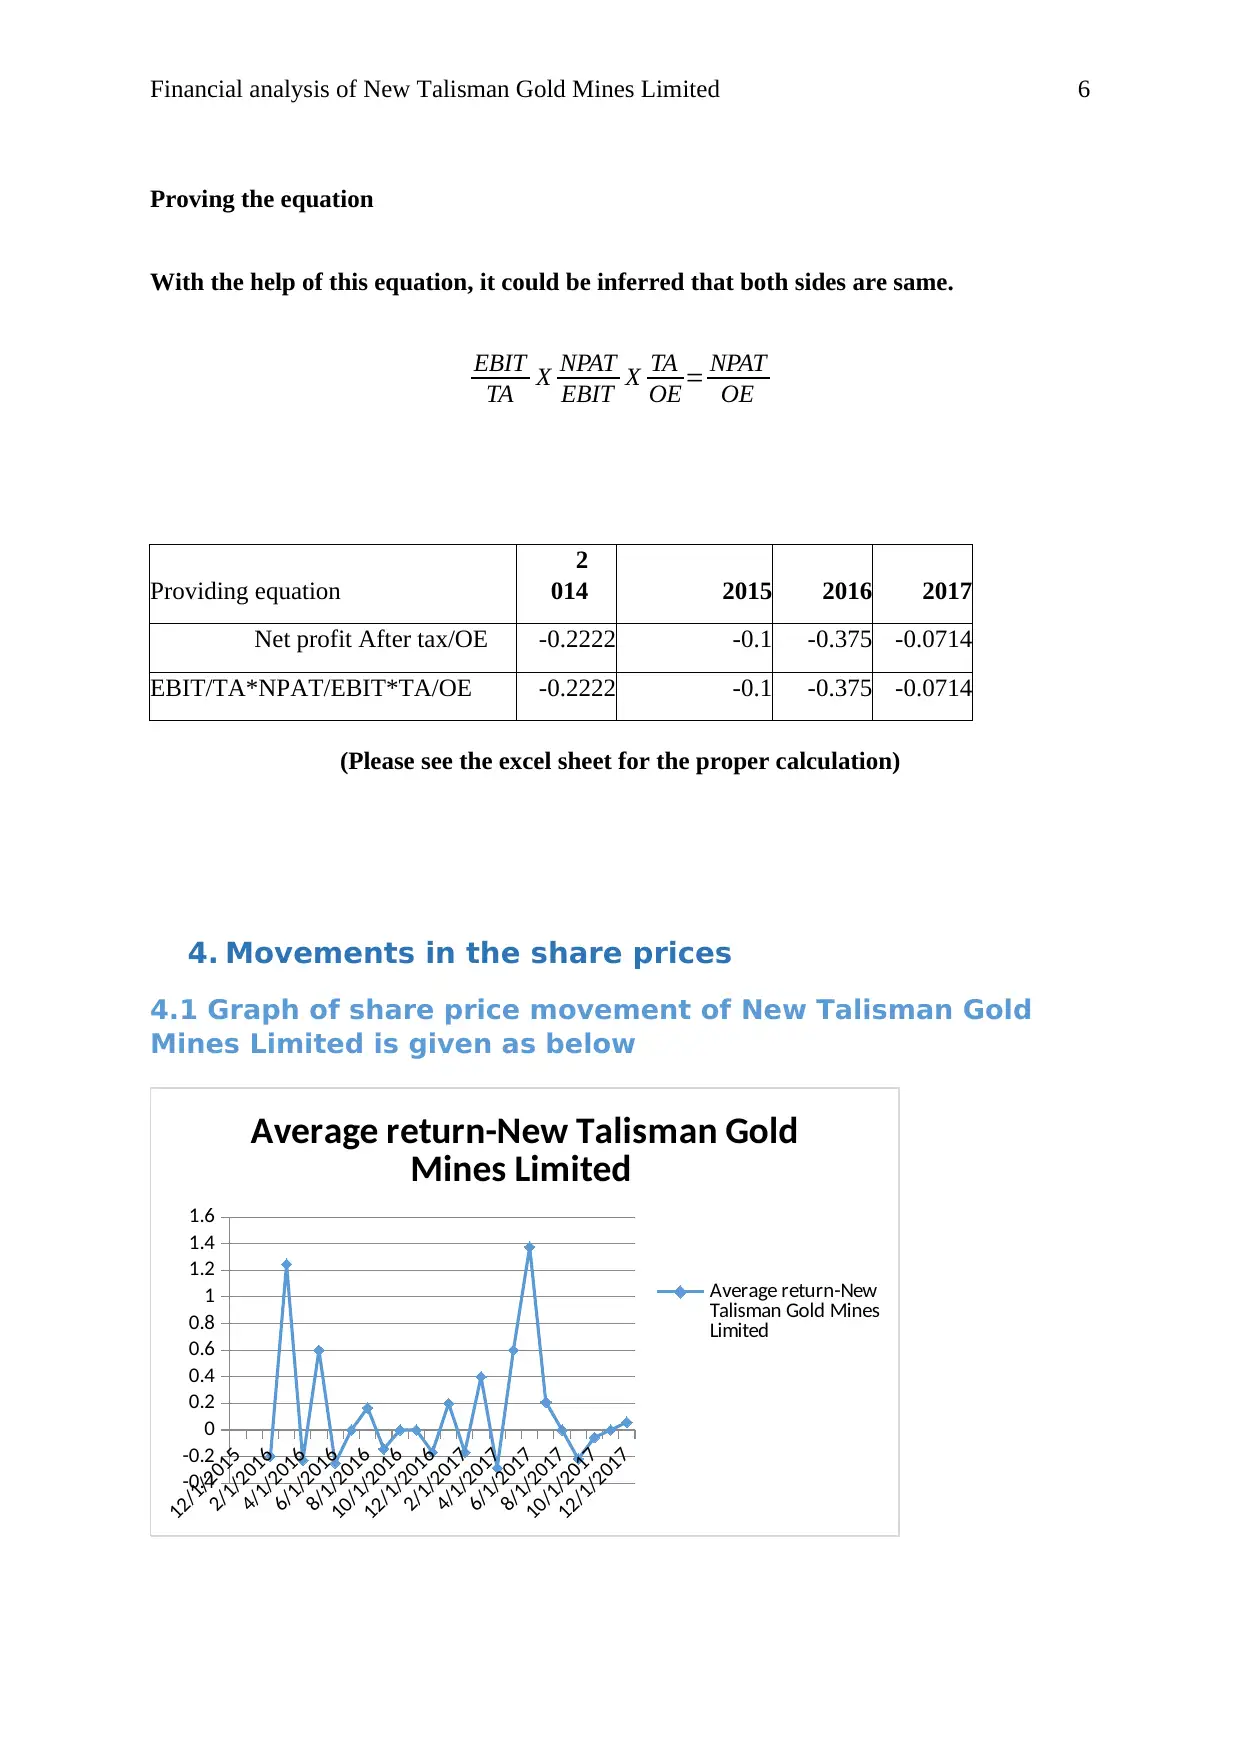
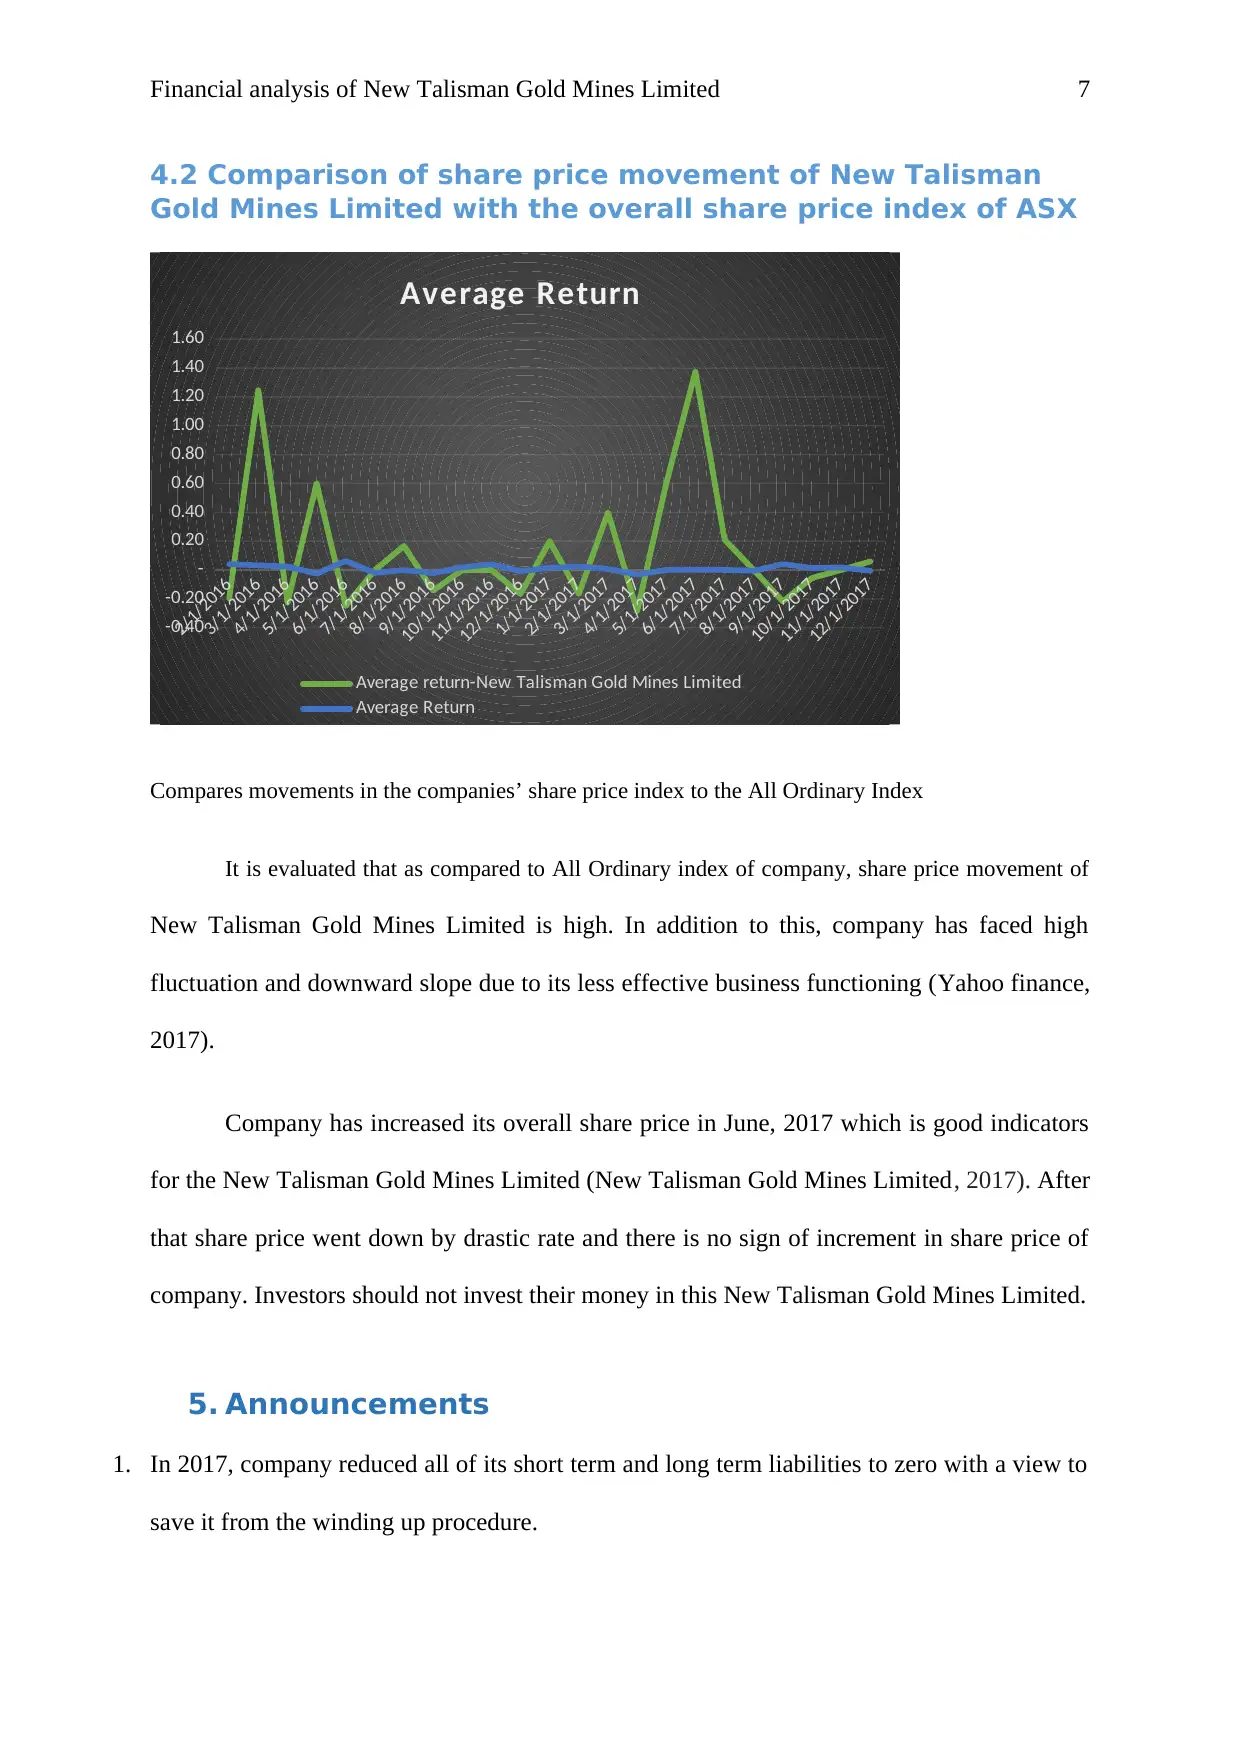
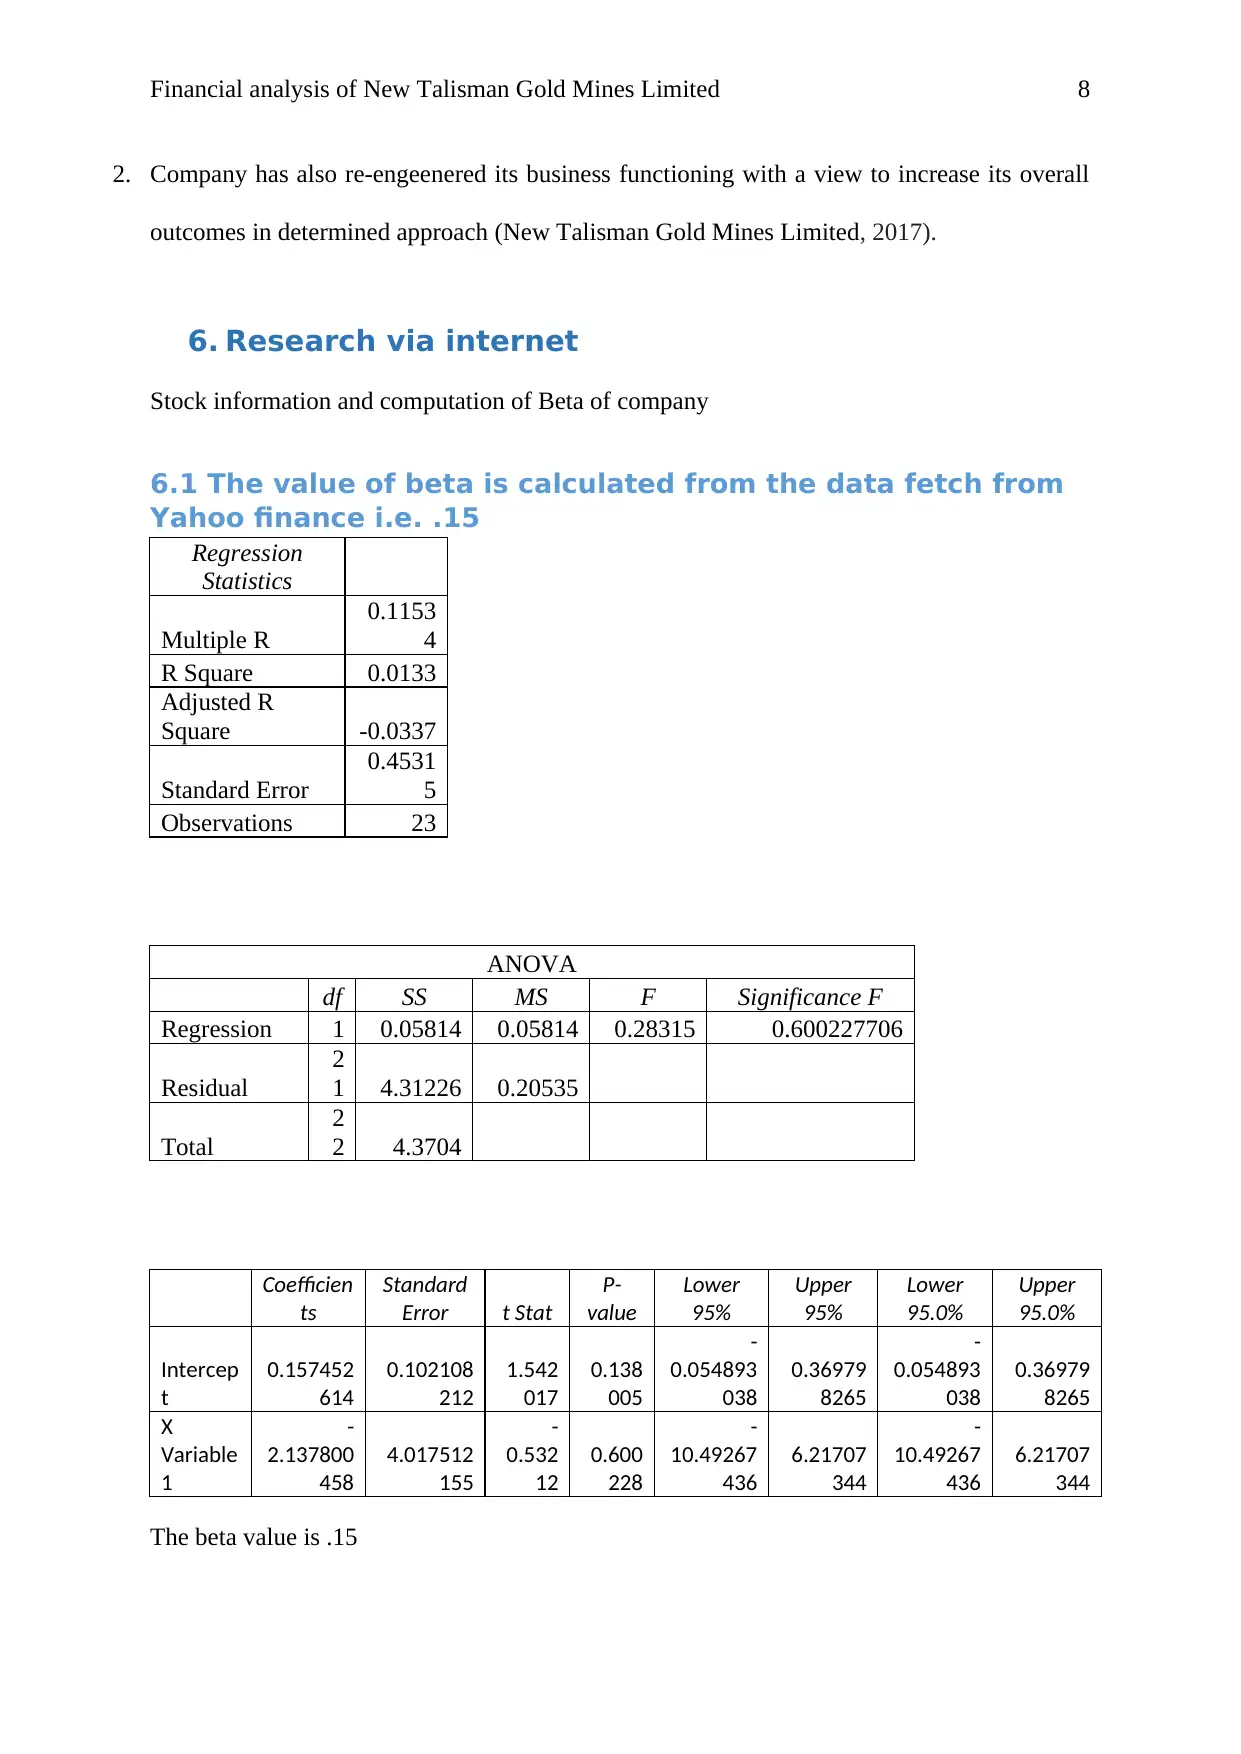
This report provides a financial analysis of New Talisman Gold Mines Limited, evaluating its performance from 2014 to 2017. It examines key financial ratios such as Return on Assets (ROA), Return on Equity (ROE), and the debt ratio, revealing negative trends and financial losses. The report also analyzes share price movements, comparing them to the All Ordinary Index, and calculates the company's beta and Weighted Average Cost of Capital (WACC) using the Capital Asset Pricing Model (CAPM). The analysis concludes with a recommendation against investment, highlighting the company's financial instability and aggressive investment strategies. The report includes detailed calculations, graphs, and references to support the analysis and conclusions. The study emphasizes that investors should conduct thorough financial analysis before investing in any company.

RUNNING HEAD: Financial analysis of New Talisman Gold Mines Limited 1
Name of the student
Topic- Financial analysis of New Talisman Gold Mines Limited
University name
Name of the student
Topic- Financial analysis of New Talisman Gold Mines Limited
University name
Paraphrase This Document
Need a fresh take? Get an instant paraphrase of this document with our AI Paraphraser

Financial analysis of New Talisman Gold Mines Limited 2
Introduction
It is important to evaluate the financial performance of company before investing
capital. In this report, New Talisman Gold Mines Limited has been taken into consideration
for financial analysis. The main objective of this report is to provide advice to investor
whether he should make investment in New Talisman Gold Mines Limited
1. Present description of the company
New Talisman Gold Mines Limited is listed Australian Company. This company holds
mining permit and an exploration permit over the Talisman Gold mine project in the Hauraki
Gold Field. At the present time, Company has entered into binding agreement with New
Crest over the rahu exploration area ((New Talisman Gold Mines Limited, 2015).
2. Ownership and governance structure
Yasuhiro and Mark is the key person who owns highest share in company (Laudon and
Traver, 2013).
Key managerial person who owns the highest shares holding ((New Talisman Gold Mines
Limited, 2017).

Financial analysis of New Talisman Gold Mines Limited 3
3. Performance ratio analysis
This ratio has been calculated on the basis of detail given in the annual report of company
(Garrett, Hoitash and Prawitt, 2014).
Calculation of ROA and ROE
New Talisman Gold Mines Limited
Particulars (Amount in Million 2014 2015 2016 2017
AUD$ AUD$
AU
D$
EBIT -2 -1 -3 -1
Net profit -2 -1 -3 -1
Total Assets 10 11 9
14.0
0
Total Liabilities 1 1 1 0
Shareholders' Equity 9 10 8
14.0
0
Computation of Return on assets
1. Rate of Return on Assets
2014 2015 2016 2017
⊘ This is a preview!⊘
Do you want full access?
Subscribe today to unlock all pages.

Trusted by 1+ million students worldwide

Financial analysis of New Talisman Gold Mines Limited 4
A. Net income -2 -1 -3 -1
B. Total assets 10 11 9 14
(A/B) -20.00% -9% -33% -7%
Interpretation
It is evaluated that return on assets of company is negative since last four years. It is not good
indicators. Company has faced loss in its business. Nonetheless, company has decreased its
net loss from -20% to -7% since last four years (New Talisman Gold Mines Limited, 2016).
Paraphrase This Document
Need a fresh take? Get an instant paraphrase of this document with our AI Paraphraser

Financial analysis of New Talisman Gold Mines Limited 5
Computation of Return on equity
2. Rate of Return on Equity
2014 2015 2016 2017
A. Net income available to equity
shareholders. -2 -1 -3 -1
B. Shareholder’s Equity 9 17,981 8 14.00
(A/B) -22.22% -0.01% -37.50% -7.14%
Interpretation
It is evaluated that return on equity of company is negative. It is not good indicator to
investors for the investment purpose in company. Company has faced loss in its business.
New Talisman Gold Mines Limited has decreased its net loss from -22.2% to -7.14% since
last four years (New Talisman Gold Mines Limited, 2014).
Computation of Debt to equity
3. Debt Ratio
2014 2015 2016 2017
A. Total Liabilities 1 1 1 0
B. Total assets 10 11 9 14.00
(A/B) 10% 9% 11% 0%
Interpretation
It is evaluated that debt to equity of company has went down to zero. Company reduced its all
the liabilities to zero with due to the sluggish market conditions. In addition to this, Company
has faced loss in its business. New Talisman Gold Mines Limited has decreased its debt to
equity from 10% to 0% since last four years.

Financial analysis of New Talisman Gold Mines Limited 6
Proving the equation
With the help of this equation, it could be inferred that both sides are same.
EBIT
TA X NPAT
EBIT X TA
OE = NPAT
OE
Providing equation
2
014 2015 2016 2017
Net profit After tax/OE -0.2222 -0.1 -0.375 -0.0714
EBIT/TA*NPAT/EBIT*TA/OE -0.2222 -0.1 -0.375 -0.0714
(Please see the excel sheet for the proper calculation)
4. Movements in the share prices
4.1 Graph of share price movement of New Talisman Gold
Mines Limited is given as below
12/1/2015
2/1/2016
4/1/2016
6/1/2016
8/1/2016
10/1/2016
12/1/2016
2/1/2017
4/1/2017
6/1/2017
8/1/2017
10/1/2017
12/1/2017
-0.4
-0.2
0
0.2
0.4
0.6
0.8
1
1.2
1.4
1.6
Average return-New Talisman Gold
Mines Limited
Average return-New
Talisman Gold Mines
Limited
⊘ This is a preview!⊘
Do you want full access?
Subscribe today to unlock all pages.

Trusted by 1+ million students worldwide

Financial analysis of New Talisman Gold Mines Limited 7
4.2 Comparison of share price movement of New Talisman
Gold Mines Limited with the overall share price index of ASX
2/1/2016
3/1/2016
4/1/2016
5/1/2016
6/1/2016
7/1/2016
8/1/2016
9/1/2016
10/1/2016
11/1/2016
12/1/2016
1/1/2017
2/1/2017
3/1/2017
4/1/2017
5/1/2017
6/1/2017
7/1/2017
8/1/2017
9/1/2017
10/1/2017
11/1/2017
12/1/2017
-0.40
-0.20
-
0.20
0.40
0.60
0.80
1.00
1.20
1.40
1.60
Average Return
Average return-New Talisman Gold Mines Limited
Average Return
Compares movements in the companies’ share price index to the All Ordinary Index
It is evaluated that as compared to All Ordinary index of company, share price movement of
New Talisman Gold Mines Limited is high. In addition to this, company has faced high
fluctuation and downward slope due to its less effective business functioning (Yahoo finance,
2017).
Company has increased its overall share price in June, 2017 which is good indicators
for the New Talisman Gold Mines Limited (New Talisman Gold Mines Limited, 2017). After
that share price went down by drastic rate and there is no sign of increment in share price of
company. Investors should not invest their money in this New Talisman Gold Mines Limited.
5. Announcements
1. In 2017, company reduced all of its short term and long term liabilities to zero with a view to
save it from the winding up procedure.
Paraphrase This Document
Need a fresh take? Get an instant paraphrase of this document with our AI Paraphraser

Financial analysis of New Talisman Gold Mines Limited 8
2. Company has also re-engeenered its business functioning with a view to increase its overall
outcomes in determined approach (New Talisman Gold Mines Limited, 2017).
6. Research via internet
Stock information and computation of Beta of company
6.1 The value of beta is calculated from the data fetch from
Yahoo finance i.e. .15
Regression
Statistics
Multiple R
0.1153
4
R Square 0.0133
Adjusted R
Square -0.0337
Standard Error
0.4531
5
Observations 23
ANOVA
df SS MS F Significance F
Regression 1 0.05814 0.05814 0.28315 0.600227706
Residual
2
1 4.31226 0.20535
Total
2
2 4.3704
Coefficien
ts
Standard
Error t Stat
P-
value
Lower
95%
Upper
95%
Lower
95.0%
Upper
95.0%
Intercep
t
0.157452
614
0.102108
212
1.542
017
0.138
005
-
0.054893
038
0.36979
8265
-
0.054893
038
0.36979
8265
X
Variable
1
-
2.137800
458
4.017512
155
-
0.532
12
0.600
228
-
10.49267
436
6.21707
344
-
10.49267
436
6.21707
344
The beta value is .15

Financial analysis of New Talisman Gold Mines Limited 9
6.2 Computation of required rate of return by using CAPM
method
E(R) = Rf +( β∗R p)
E(R) = Expected rate of return
Rf = Risk free rate of return
β = Beta
Rp= Market Risk Premium
Calculation of Required rate of return
Risk free rate (A) 4%
Beta (B) 0.157452614
Market Risk premium (C) 6%
Required rate of return [A+(B*C)] 4.94%
(Please see the excel)
6.3 Determination of conservative investment
The investment decision of Company is highly aggressive. It is observed that company has
faced high loss in its business. It is further observed that company has reduced its investment
in its own business and invested more funds in outside business organization. Therefore, due
to sluggish market condition, company has been investing its money in other business to cope
up with its existing business losses (Bekaert and Hodrick, 2017).
7. Weighted Average Cost of Capital (WACC)
7.1 Cost of equity (calculated above using CAPM
Cost of equity (calculated above using CAPM) = 4.94%
Cost of Debt = 0%
WACC = Cost of debt (interest rate after tax) + cost of equity
⊘ This is a preview!⊘
Do you want full access?
Subscribe today to unlock all pages.

Trusted by 1+ million students worldwide

Financial analysis of New Talisman Gold Mines Limited 10
= 0% + 4.94%
= 4.94%
The cost of debt of company is taken zero. Company does not have any debts in its business
nor have any interest payment. Therefore, company have zero debt (Kundakchyan and
Zulfakarova, 2014).
7.2 Implications that a higher WACC on investment decision
It is evaluated that if company has higher WACC then it could put negative impact
while selecting any project by the management. It will reduce the return on capital employed
and also increase the risk of covering project loss. Higher WACC reflects higher risk so
financial leverage. Therefore, it could be inferred that higher WACC could impact
management decision in negative manner (Brigham and Ehrhardt, 2013).
8. Consideration of debt ratio for the company
8.1 Appear to stable
It is evaluated that debt ratio of company has went down since last four years.
However, determining the optimum debt ratio is not possible as it based on the economic
factors, business factors and internal factors of business (New Talisman Gold Mines Limited,
2017).
3. Debt Ratio
2014 2015 2016 2017
A. Total Liabilities 1 1 1 0
B. Total assets 10 11 9 14.00
(A/B) 10% 9% 11% 0%
It is considered that debt to equity of company has gone down to zero. Company
reduced its all the liabilities to zero with due to the sluggish market conditions. New
Paraphrase This Document
Need a fresh take? Get an instant paraphrase of this document with our AI Paraphraser

Financial analysis of New Talisman Gold Mines Limited 11
Talisman Gold Mines Limited has decreased its debt to equity from 10% to 0% since last four
years. It is the best management decision to keep its debt ratio to zero to save it from winding
up or dissolution procedure (Zhu, 2014).
8.2 Gearing ratio discussion
It is observed that company has no interest payment. Therefore, the gearing ratio of
company is zero. It is the best management decision to keep its gearing ratio to zero as
company has been facing loss in its business.
9. Divided policies of company
Company has adopted profit based dividend policies in its business. The main reason
of determining this dividend policy is based on the amount of dividend which company has
paid since last four year. Company has paid zero dividends to its shareholders as it has not
earned profit throughout the time.
10. Letter of recommendation
After evaluating the above given data, it is considered that investors should not invest their
money in New Talisman Gold Mines Limited. It is observed that company has faced high
loss in its business. Therefore, due to sluggish market condition, company has been investing
its money in other business to cope up with its existing business losses. Investors should not
invest their money in this company otherwise they would have to face high loss in their
business.
11. Conclusion
It is very important for the investors to conduct financial analysis to identify all the internal
and external factors of particular company before investing capital. Now in the end, it could

Financial analysis of New Talisman Gold Mines Limited 12
be inferred that investors should not invest their capital in New Talisman Gold Mines
Limited.
be inferred that investors should not invest their capital in New Talisman Gold Mines
Limited.
⊘ This is a preview!⊘
Do you want full access?
Subscribe today to unlock all pages.

Trusted by 1+ million students worldwide
1 out of 16
Related Documents
Your All-in-One AI-Powered Toolkit for Academic Success.
+13062052269
info@desklib.com
Available 24*7 on WhatsApp / Email
Unlock your academic potential
Copyright © 2020–2025 A2Z Services. All Rights Reserved. Developed and managed by ZUCOL.


