HI5002 Finance: Financial Analysis of Growth Point Properties Limited
VerifiedAdded on 2022/11/26
|20
|3959
|183
Report
AI Summary
This report provides a comprehensive financial analysis of Growth Point Properties Limited (GOZ), a real estate company listed on the Australian Stock Exchange. The analysis examines the company's financial performance from 2015 to 2018, utilizing tools such as vertical, horizontal, and ratio analysis. Key financial ratios, including gross profit margin, operating margin, return on assets (ROA), return on equity (ROE), asset turnover, and operating expense ratio, are calculated and evaluated to assess the company's profitability and efficiency. The report also addresses systematic and unsystematic risks, such as foreign exchange and interest rate risks, and offers recommendations for informed investment decision-making. The study highlights the company's comparative advantages, including a strong brand portfolio, market penetration, and customer satisfaction, and concludes with an assessment of the company's financial health and investment potential, providing valuable insights for investors.

FINANCIAL ANALYSIS FOR INVESTMENT ADVICE 1
FINANCIAL ANALYSIS FOR INVESTMENT ADVICE
Student Name
Professors Name
University
City/State
Date
FINANCIAL ANALYSIS FOR INVESTMENT ADVICE
Student Name
Professors Name
University
City/State
Date
Paraphrase This Document
Need a fresh take? Get an instant paraphrase of this document with our AI Paraphraser
FINANCIAL ANALYSIS FOR INVESTMENT ADVICE 2
FINANCIAL ANALYSIS FOR INVESTMENT ADVICE.
Abstract
This research was purposed towards financial analysis of Growth point properties limited.
The main purpose was to assess different financial drivers of the company to achieve objectives
such like profit and shareholders wealth maximization. Different tools of financial statements
were considered since they were considered important for this study. Precautions were thereafter
developed to enhance company’s economic development. The tools that were used for this study
range from analysis of the current period financial information available on financial statement
to analysis of data from 2015 to 2018 for trend analysis of ratios. The whole work consisted of
theoretical and analytical analysis. The theory was used to support analytical results arrived at
while analytical evidence which was obtained from rigorous analysis of financial statements
contained in the books of accounts like vertical, horizontal and ratio analysis all of which are
important in determining company’s financial position. Based on the result of this study,
recommendations were proposed thereafter to institutional investor for informed investment
decision making.
FINANCIAL ANALYSIS FOR INVESTMENT ADVICE 3
Introduction
Investors always purpose to invest in corporate promising future high return on
investment. This is because they are always looking for the best portfolios to diversify their
wealth. Therefore, investment analyst are tasked with analysis of the company’s financial
performance and future cash flow panorama for the investor to make informed decision.
Investors always take advantage of possibility of future success of a company so that they can be
well position to maximize their wealth and investment report is best to aid with such information.
Australian stock market is a complicated market and companies involve in this market
are always in competition so that they can hold or improve their position to attract even more
investments. For the purpose of our analysis, we will use Growth point properties limited which
are real estate company which are also listed with Australian stock exchange. Real estate is
considered as one of the fast growing industry in the current world (Geltner, Miller, Clayton,
Eichholtz 2011). Measure of a corporate performance is very important for a range of
stakeholders and investors to make decisions on investment.
These performance evaluations is viewed on the basis of financial performance which has
a broad perspective ranging from project evaluation to analysis of return on investments, analysis
of risks business is exposed to, trend analysis, analysis of dividend payout and retention ratio,
and analysis of financial and performance ratios. Consequently, it is important to note that
financial information provides a background for analysis in which shareholders; prospective
investors and researchers can use to compare different corporate to make investment decisions
(Gallizo & Salvador, 2013).
⊘ This is a preview!⊘
Do you want full access?
Subscribe today to unlock all pages.
Trusted by 1+ million students worldwide
FINANCIAL ANALYSIS FOR INVESTMENT ADVICE 4
Description of the company
Growth point properties Australia is a company that invests in rental generating and well
maintained properties within Australia and is considered as the best real estate property company
based on its recent performances. These properties may also be considered to be leased. The
Company is listed in Australian securities exchange ASX with GOZ code and has maintained
this position for the current years. Growth point properties Australia has diversified in terms of
workplace set up with 57 offices and properties worth up to $3.8B and over 80% of assets
located on the Eastern market segment which has a mandate to invest in retail, industrial and
office properties.
Growth point properties limited are the major security holder in GOZ. This is a South
Africa's largest listed property group with gross assets of over $13.1 billion. Growth point
Properties Limited is the largest shareholder in GOZ with a stake of 65% therefore exercising
much control. This can be contributed by the increased demand of real estate products in this
country and other investors in New Zealand and Australian corporate investors and other
Australian wealthy individuals.
Historical and current factors that have contributed to the company’s comparative
advantage
Some of the key factor that have led to the growth of the company as well as comparative
advantage on this industry are extensively discussed in fern fort university extensive research.
These factors have been held over time and significant improvement on them has helped the
company gain financial superiority. These among the factors are;
Paraphrase This Document
Need a fresh take? Get an instant paraphrase of this document with our AI Paraphraser
FINANCIAL ANALYSIS FOR INVESTMENT ADVICE 5
Stronger brand portfolios: The company has identified a mix of portfolio to produce a
stronger brand a secret that is not shared by other companies in the industry. Customers always
prefer quality products and a strong brand means a better quality. Brand portfolio is also
important whenever a company need to expand to other jurisdiction therefore providing a market
edge.
Penetration into new market: The Company has consistently expanded to new markets.
As noticed previously, it has over 57 offices in operation. This expansion has been contributed to
expertise who works round the clock to deliver success. Entrant into new markets has helped the
company to build new sources of revenue and maximize profits. When the number of new
businesses acquired by Growth point properties, Australia are compared to other companies in
the industry, they are considered to have a higher investor’s consideration.
Favorable return on investment: The company has successfully executed new projects
that generate revenue as compared to cost. These projects have immensely diversified revenue
streams. A company which has a better return of investment has an advantage to be considered
for investment than those with lower return since investor always want money back on capital
employed.
Stronger network of distribution: The company has from time and again developed a
strong distribution chain to reach out to customers. It has employed a mix of both distributors
and dealers who not only sell the company’s products but are also involved in consumer
education and training of the sales team (Stata, 2010, p.4567). This is considered as one of the
success factor for the company having to maintain top position in the real estate companies
ranking.
FINANCIAL ANALYSIS FOR INVESTMENT ADVICE 6
Product innovation: Strategizing to enter new market requires product design and
specification to fit that particular market. GOZ has not relented on boosting revenues from new
product innovation time and again targeted to a particular market segment (Leuz, Nanda and
Wysocki, 2013).
Customer satisfaction: Customer have frequently embraced Growth point properties
Australia products as compared to other products due to overwhelming customers’ satisfaction.
Since the customer base is wide, the company has increased revenues from high return on
investment as compared to other companies in the real estate industry.
Calculation and analysis of selected performance ratios
GOZ aims to grow its portfolio over time and diversify its property investment by asset
class, geography and tenant exposure through individual property acquisitions, portfolio
transactions and corporate activity (M&A transactions) as opportunities arise. Ratios always
allow shareholders to make comparison of diverse information in a meaningful manner to come
up with informed decisions (Singh & Schmidgall 2012)
Types financial and efficiency ratios
From the financial information obtained at www.asx.com.au,
⊘ This is a preview!⊘
Do you want full access?
Subscribe today to unlock all pages.
Trusted by 1+ million students worldwide
FINANCIAL ANALYSIS FOR INVESTMENT ADVICE 7
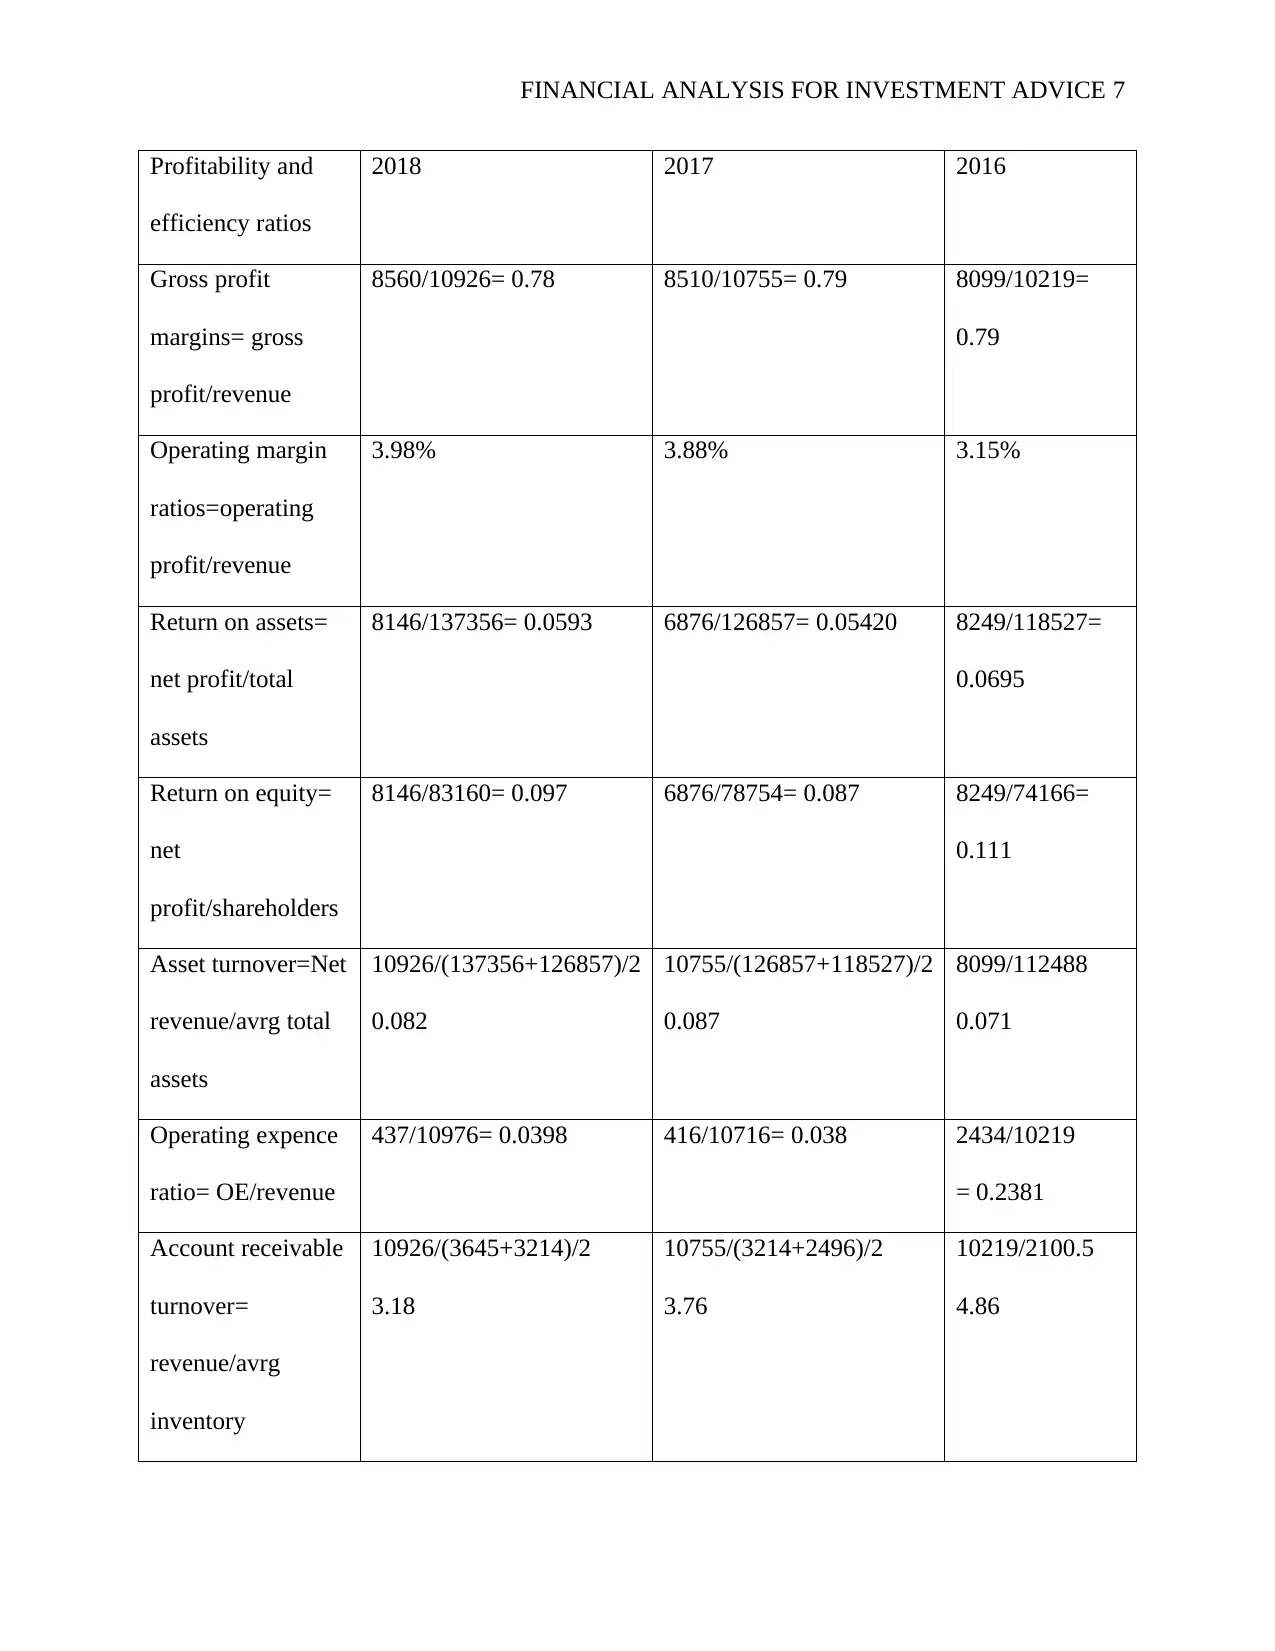
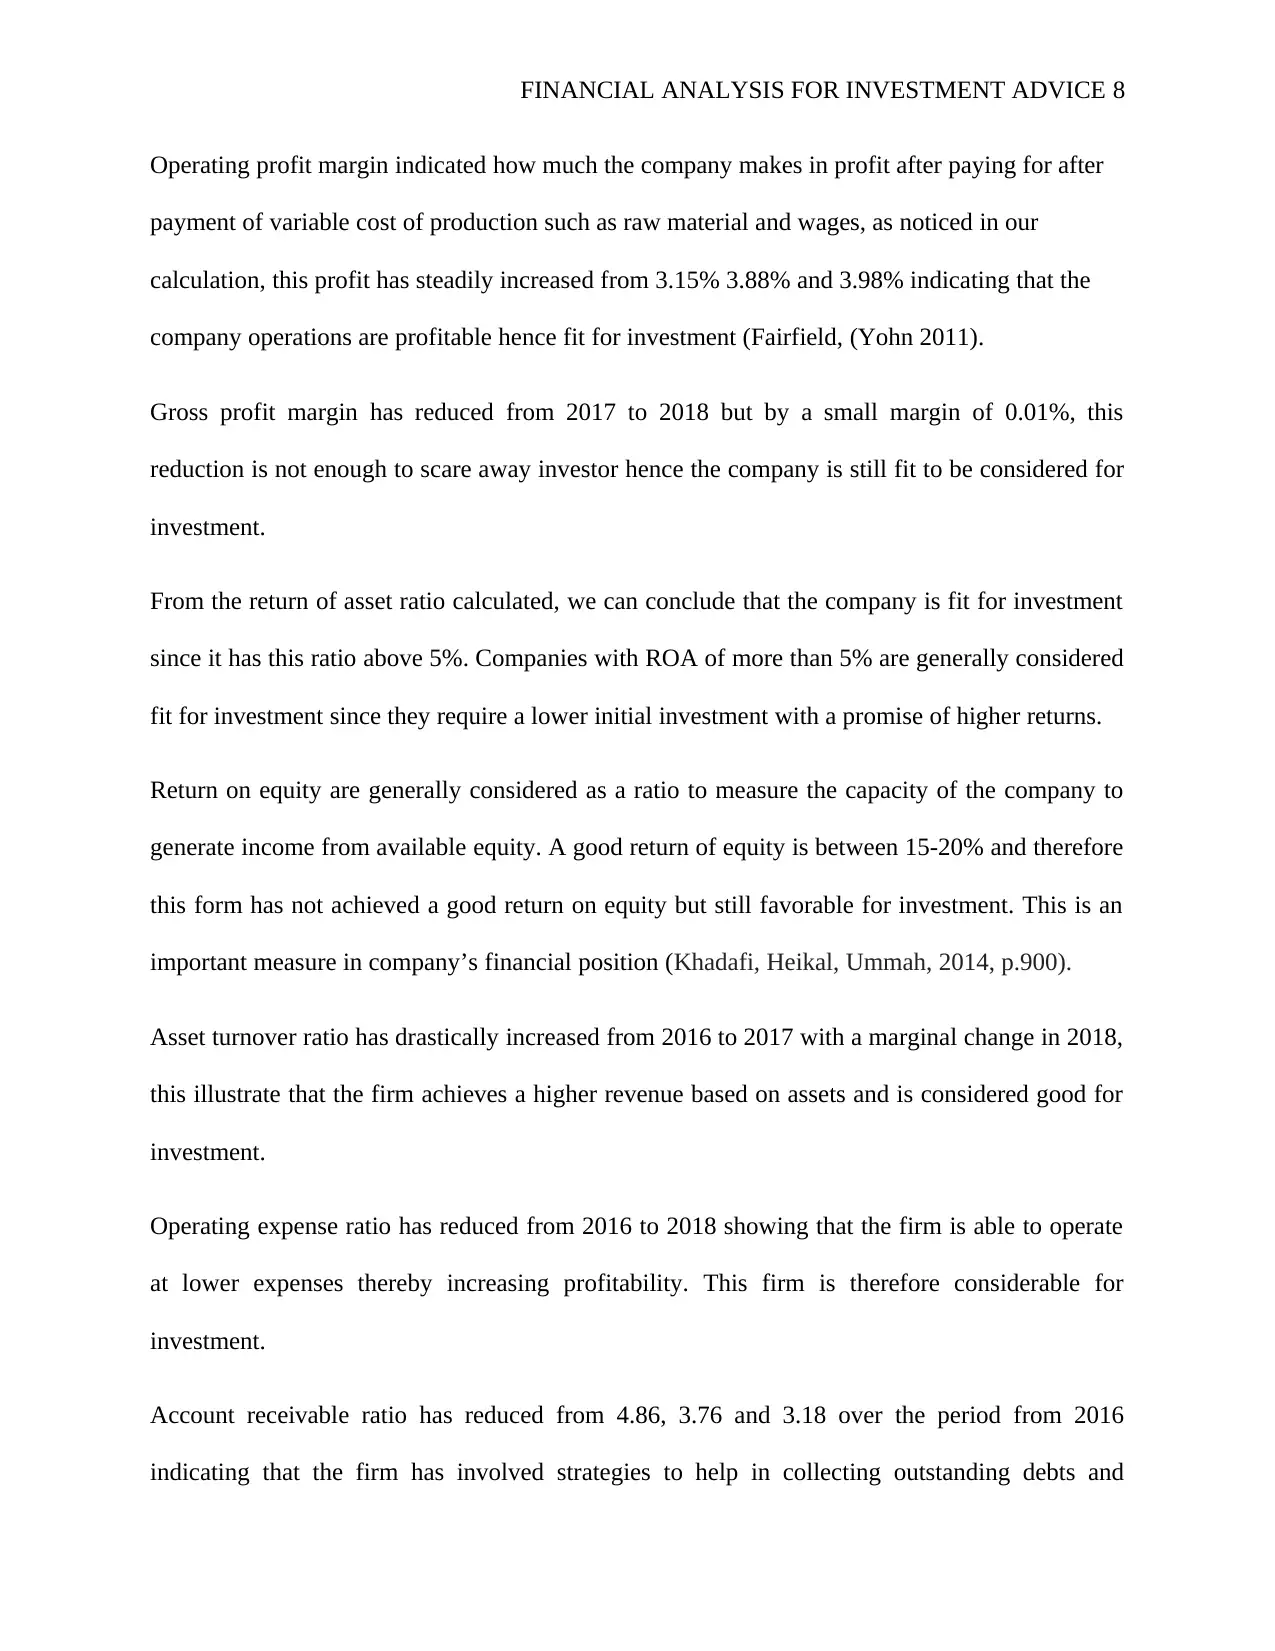
Profitability and
efficiency ratios
2018 2017 2016
Gross profit
margins= gross
profit/revenue
8560/10926= 0.78 8510/10755= 0.79 8099/10219=
0.79
Operating margin
ratios=operating
profit/revenue
3.98% 3.88% 3.15%
Return on assets=
net profit/total
assets
8146/137356= 0.0593 6876/126857= 0.05420 8249/118527=
0.0695
Return on equity=
net
profit/shareholders
8146/83160= 0.097 6876/78754= 0.087 8249/74166=
0.111
Asset turnover=Net
revenue/avrg total
assets
10926/(137356+126857)/2
0.082
10755/(126857+118527)/2
0.087
8099/112488
0.071
Operating expence
ratio= OE/revenue
437/10976= 0.0398 416/10716= 0.038 2434/10219
= 0.2381
Account receivable
turnover=
revenue/avrg
inventory
10926/(3645+3214)/2
3.18
10755/(3214+2496)/2
3.76
10219/2100.5
4.86
Paraphrase This Document
Need a fresh take? Get an instant paraphrase of this document with our AI Paraphraser
FINANCIAL ANALYSIS FOR INVESTMENT ADVICE 8
Operating profit margin indicated how much the company makes in profit after paying for after
payment of variable cost of production such as raw material and wages, as noticed in our
calculation, this profit has steadily increased from 3.15% 3.88% and 3.98% indicating that the
company operations are profitable hence fit for investment (Fairfield, (Yohn 2011).
Gross profit margin has reduced from 2017 to 2018 but by a small margin of 0.01%, this
reduction is not enough to scare away investor hence the company is still fit to be considered for
investment.
From the return of asset ratio calculated, we can conclude that the company is fit for investment
since it has this ratio above 5%. Companies with ROA of more than 5% are generally considered
fit for investment since they require a lower initial investment with a promise of higher returns.
Return on equity are generally considered as a ratio to measure the capacity of the company to
generate income from available equity. A good return of equity is between 15-20% and therefore
this form has not achieved a good return on equity but still favorable for investment. This is an
important measure in company’s financial position (Khadafi, Heikal, Ummah, 2014, p.900).
Asset turnover ratio has drastically increased from 2016 to 2017 with a marginal change in 2018,
this illustrate that the firm achieves a higher revenue based on assets and is considered good for
investment.
Operating expense ratio has reduced from 2016 to 2018 showing that the firm is able to operate
at lower expenses thereby increasing profitability. This firm is therefore considerable for
investment.
Account receivable ratio has reduced from 4.86, 3.76 and 3.18 over the period from 2016
indicating that the firm has involved strategies to help in collecting outstanding debts and
FINANCIAL ANALYSIS FOR INVESTMENT ADVICE 9
reducing debtor’s collection period. All these ratios help the company to determine long term
standings (Horrigan, 2016, pp.345-400)
Marketable securities on the financial statement
Consistently, scholars have used diverse measures of earnings quality indication derived
from profits and cash (Dechow, Schrand 2010, p.457). These measures include persistence,
actuarial, timelessness, loss avoidance and external indicators using instruments available in the
assets of the company such as derivatives. Derivatives always reduce the volatility that earnings
are exposed in the cash flows which are caused by fluctuations and changes in interest rates,
exchange rates and risk factors. This derivatives composed in the company’s statement of
financial position can be used for streamlining earnings.
Analysis of systematic and unsystematic risks
Risks should be identified and measured by management since they reflect on returns
(Waemustafa, Sukri, 2016, pp.900-987). Systematic risks are considered to be risks that face the
entire market and not just particular stock in the industry. They are sometimes referred to as
market risks. The entire market in which an organization operate is referred to as external
environment and as well, systematic risks can be viewed as those risks that affect external
environment (Bevan and Danbolt, 2012). The risks have the same effect to companies within a
certain industry.
⊘ This is a preview!⊘
Do you want full access?
Subscribe today to unlock all pages.
Trusted by 1+ million students worldwide
FINANCIAL ANALYSIS FOR INVESTMENT ADVICE 10
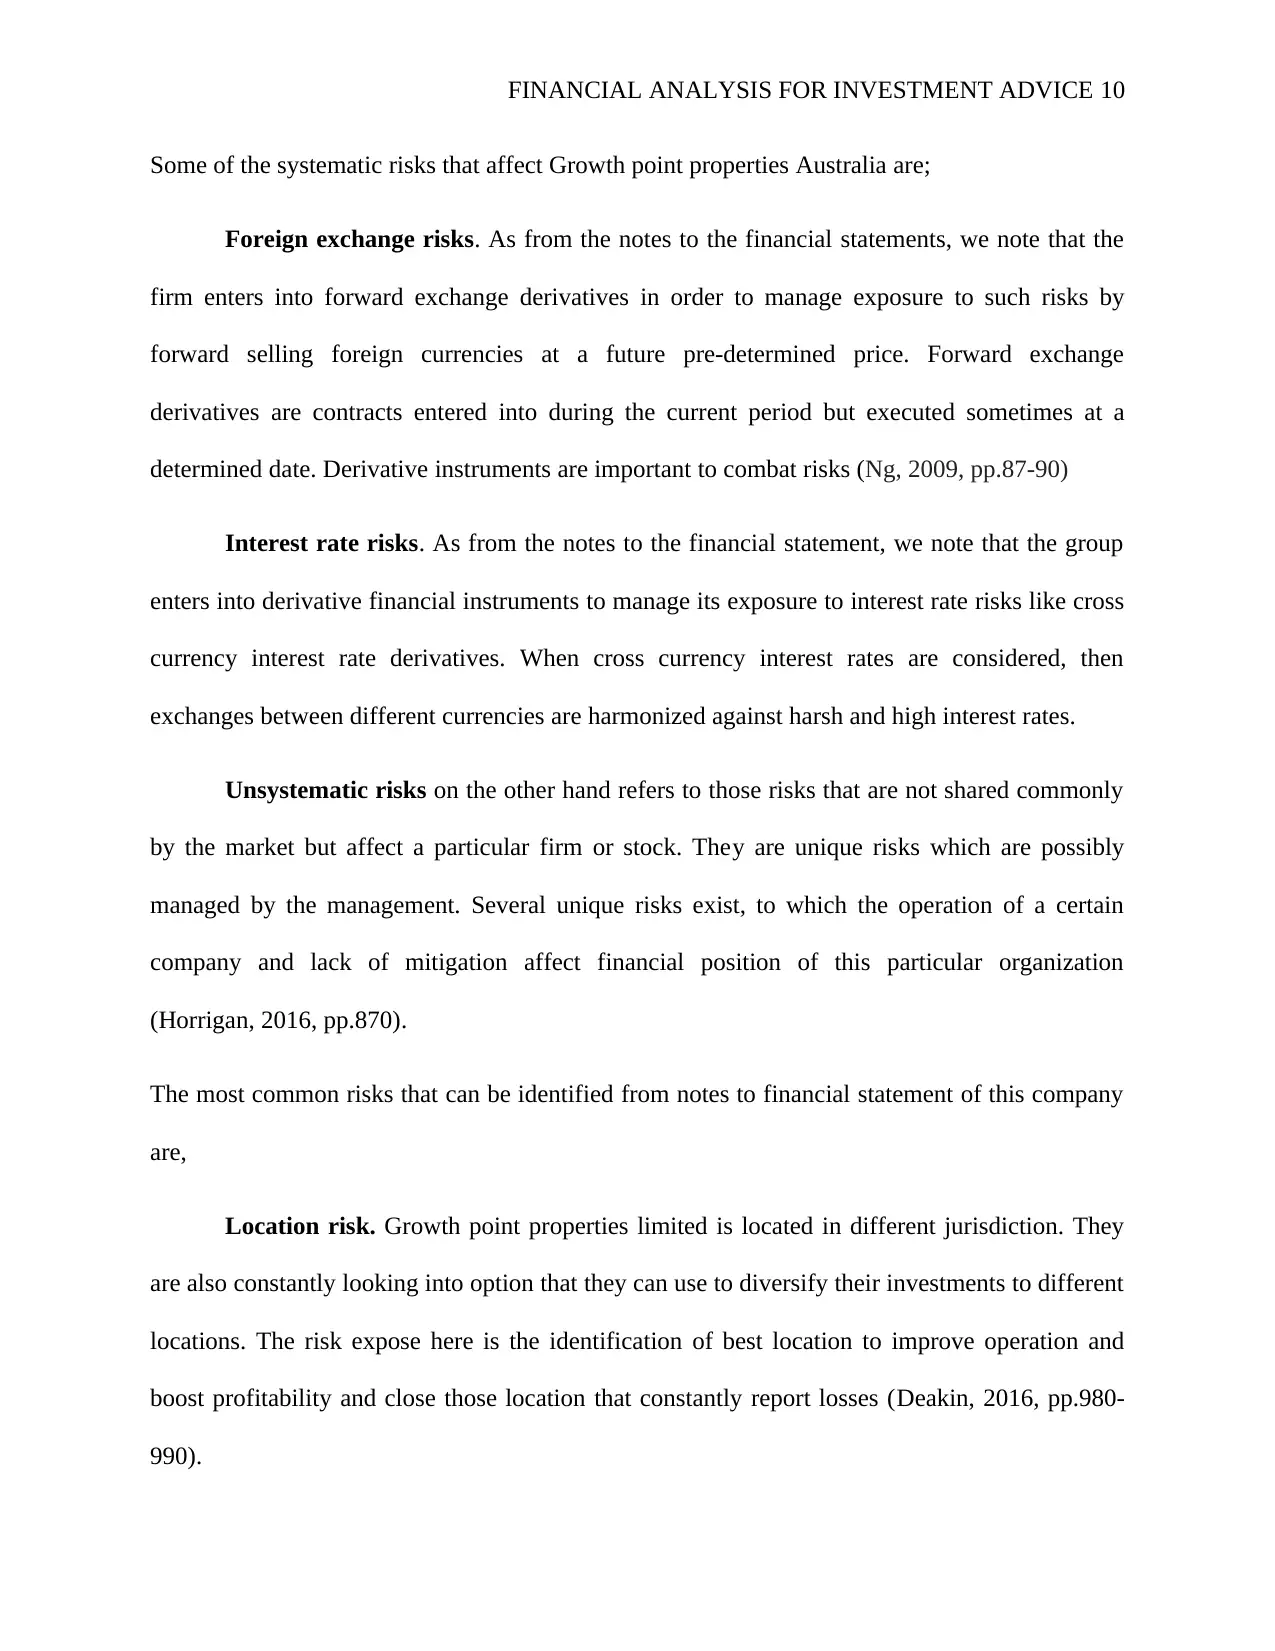
Some of the systematic risks that affect Growth point properties Australia are;
Foreign exchange risks. As from the notes to the financial statements, we note that the
firm enters into forward exchange derivatives in order to manage exposure to such risks by
forward selling foreign currencies at a future pre-determined price. Forward exchange
derivatives are contracts entered into during the current period but executed sometimes at a
determined date. Derivative instruments are important to combat risks (Ng, 2009, pp.87-90)
Interest rate risks. As from the notes to the financial statement, we note that the group
enters into derivative financial instruments to manage its exposure to interest rate risks like cross
currency interest rate derivatives. When cross currency interest rates are considered, then
exchanges between different currencies are harmonized against harsh and high interest rates.
Unsystematic risks on the other hand refers to those risks that are not shared commonly
by the market but affect a particular firm or stock. They are unique risks which are possibly
managed by the management. Several unique risks exist, to which the operation of a certain
company and lack of mitigation affect financial position of this particular organization
(Horrigan, 2016, pp.870).
The most common risks that can be identified from notes to financial statement of this company
are,
Location risk. Growth point properties limited is located in different jurisdiction. They
are also constantly looking into option that they can use to diversify their investments to different
locations. The risk expose here is the identification of best location to improve operation and
boost profitability and close those location that constantly report losses (Deakin, 2016, pp.980-
990).
Paraphrase This Document
Need a fresh take? Get an instant paraphrase of this document with our AI Paraphraser
FINANCIAL ANALYSIS FOR INVESTMENT ADVICE 11
Management risks. Proper or poor management are identified from the results of
financial statement. Higher profits are attributed to proper management while lower profits are
attributed to poor management. This company has not posted consistent figures in the financial
statement. Although having proper management in some departments, other sectors need to step
up on their management techniques to future enhance the group revenue.
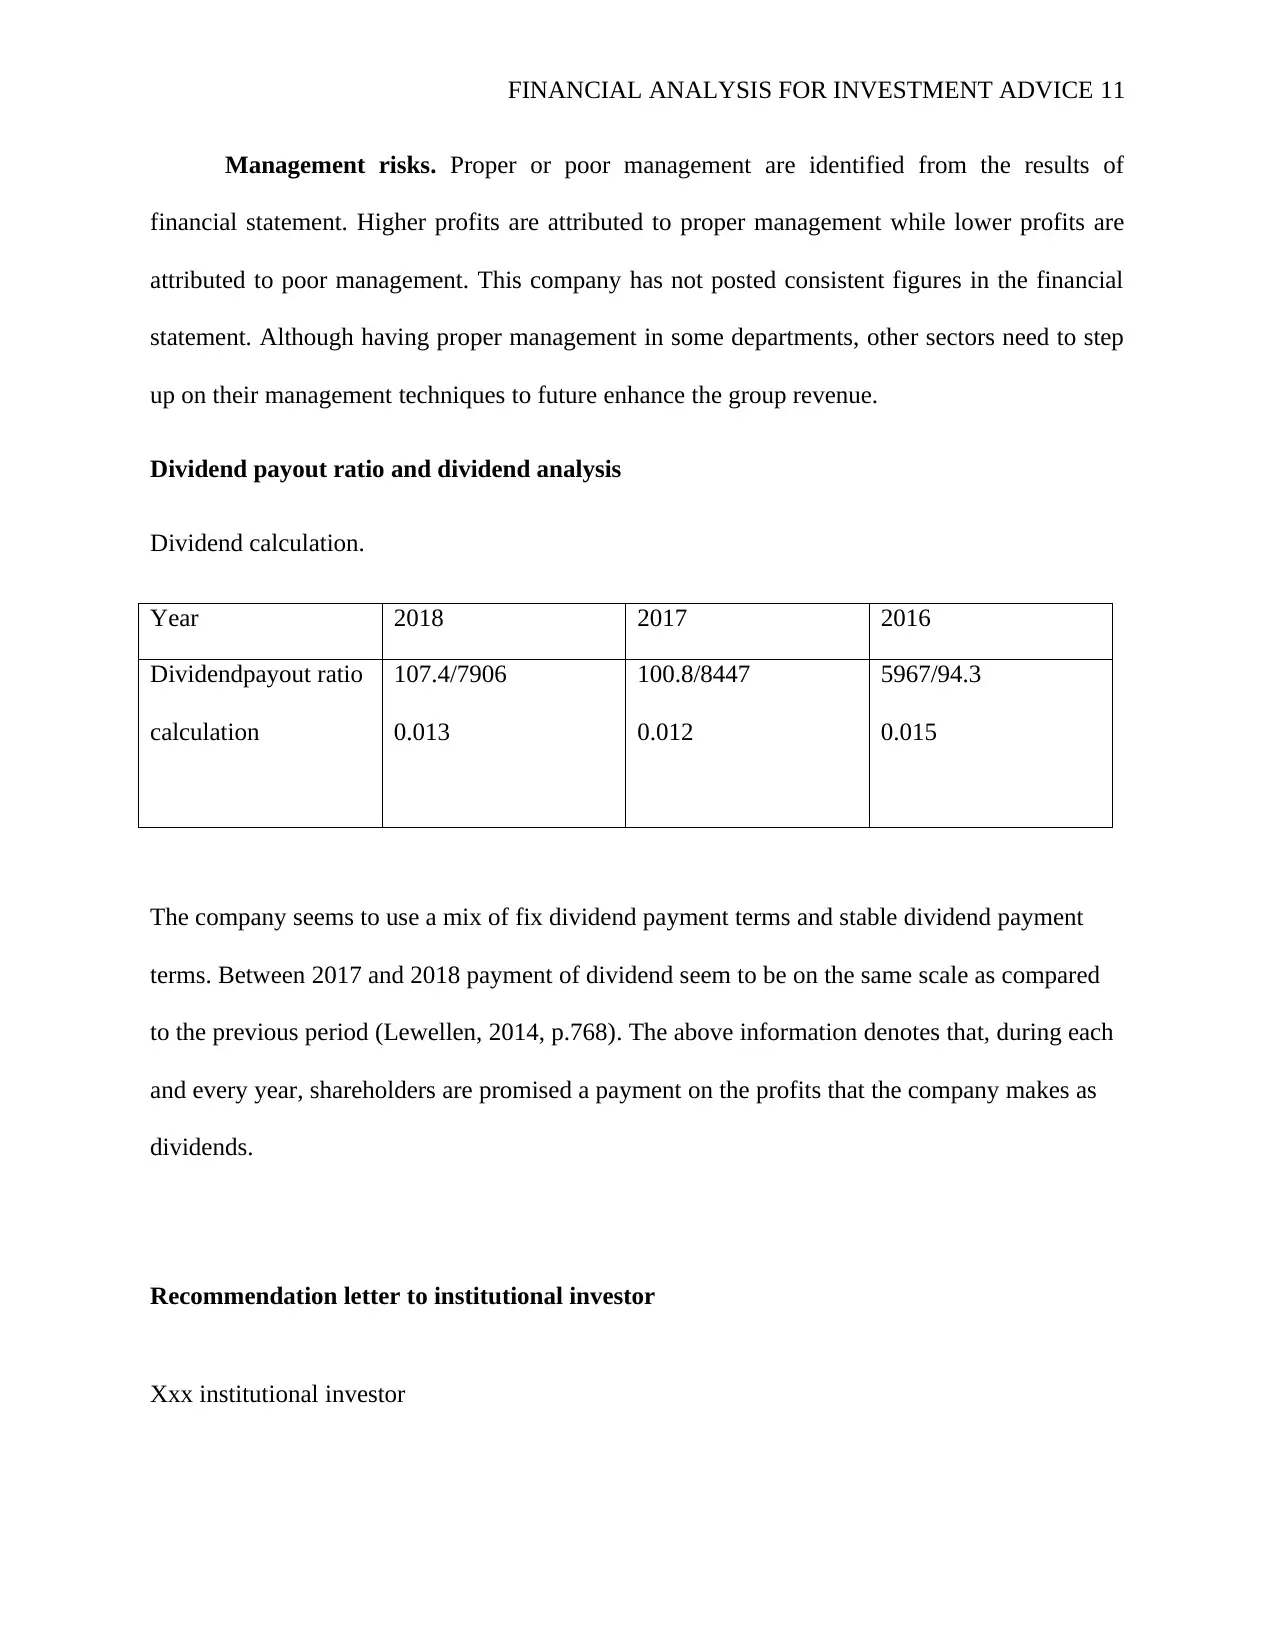
Dividend payout ratio and dividend analysis
Dividend calculation.
Year 2018 2017 2016
Dividendpayout ratio
calculation
107.4/7906
0.013
100.8/8447
0.012
5967/94.3
0.015
The company seems to use a mix of fix dividend payment terms and stable dividend payment
terms. Between 2017 and 2018 payment of dividend seem to be on the same scale as compared
to the previous period (Lewellen, 2014, p.768). The above information denotes that, during each
and every year, shareholders are promised a payment on the profits that the company makes as
dividends.
Recommendation letter to institutional investor
Xxx institutional investor
Management risks. Proper or poor management are identified from the results of
financial statement. Higher profits are attributed to proper management while lower profits are
attributed to poor management. This company has not posted consistent figures in the financial
statement. Although having proper management in some departments, other sectors need to step
up on their management techniques to future enhance the group revenue.
Dividend payout ratio and dividend analysis
Dividend calculation.
Year 2018 2017 2016
Dividendpayout ratio
calculation
107.4/7906
0.013
100.8/8447
0.012
5967/94.3
0.015
The company seems to use a mix of fix dividend payment terms and stable dividend payment
terms. Between 2017 and 2018 payment of dividend seem to be on the same scale as compared
to the previous period (Lewellen, 2014, p.768). The above information denotes that, during each
and every year, shareholders are promised a payment on the profits that the company makes as
dividends.
Recommendation letter to institutional investor
Xxx institutional investor
FINANCIAL ANALYSIS FOR INVESTMENT ADVICE 12
Investment proposal to invest in Growth point properties Australia
Dear sir/ madam,
As from available information that you have had, Growth point properties Australia is a real
estate investment firm in Australia listed with the Australian stock exchange. After conducting
vigorous and in depth analysis on financial of the company, analysis that can be used to make
future investment decisions I would like to give a recommendation towards favorable return on
investment.
Growth point properties Australia has continually over the years become a market leader and
‘big fish’ in the industry. The government has also diversified and invested continually in
innovative ways to produce and improve on quality products. This has been through conducting
campaigns and brand marketing in different locations to improve on revenue and increase on the
company’s portfolio the company definitely has the proper management to ensure objectives of
the company is achieved (Ohlson, 2010, pp.453-456). It is therefore with immense pleasure that
we invite recommend this investment.
The company has stayed an edge in the market due to various reasons such as customer
satisfaction, strong brand portfolios, high return on investment and stronger distribution
channels. This among the factors has continually improve the revenue to the company attracting
investment and offering a return on the investment. It also has multi-level procedures that they
use to deal with difficulties and risks that the firm may face into the future such as hedging the
foreign exchange risks (Geltner, Miller, Clayton and Eichholtz, 2015, p.642). Proper
management of risks that the business face therefore mean that the company can easily mitigate
⊘ This is a preview!⊘
Do you want full access?
Subscribe today to unlock all pages.
Trusted by 1+ million students worldwide
1 out of 20
Related Documents


Your All-in-One AI-Powered Toolkit for Academic Success.
+13062052269
info@desklib.com
Available 24*7 on WhatsApp / Email
![[object Object]](/_next/static/media/star-bottom.7253800d.svg)
Unlock your academic potential
Copyright © 2020–2026 A2Z Services. All Rights Reserved. Developed and managed by ZUCOL.