Managerial Finance: Financial Ratio Analysis of GSK and RB Group
VerifiedAdded on 2023/01/17
|20
|4050
|97
Report
AI Summary
This managerial finance report presents a comparative financial analysis of Glaxo Smith Kline plc (GSK) and Reckitt Benckiser Group plc (RBG), focusing on their financial performance, position, and investment potential. The report calculates and analyzes various financial ratios, including current, quick, net profit margin, gross profit margin, gearing, P/E, EPS, ROCE, inventory turnover, and dividend payout ratios for the years 2017 and 2018. The analysis assesses the short-term liquidity, profitability, efficiency, and solvency of both companies, highlighting their strengths and weaknesses. The report offers recommendations for improving the financial performance of the underperforming business and discusses the limitations of using financial ratios and investment appraisal techniques. The objective is to provide investors with insights to make informed decisions regarding investment viability, contributing to the broader understanding of corporate finance principles.

Managerial Finance
Paraphrase This Document
Need a fresh take? Get an instant paraphrase of this document with our AI Paraphraser
Table of Contents
INTRODUCTION...........................................................................................................................3
TASK 1............................................................................................................................................3
(a) Calculation of different financial ratios for two years (2017 – 2018):..................................3
(b) Analyse the performance, financial position and investment potential of both companies:. 7
(c). Recommendations of how the financial performance of the poorly performing business
can be improved:.......................................................................................................................12
(d) Limitations of financial ratios:............................................................................................12
TASK 2..........................................................................................................................................13
(a). Calculation of financial ratios for two years (2017 - 2018):..............................................13
(b) Limitations of using investment appraisal techniques:.......................................................17
CONCLUSION..............................................................................................................................18
REFERENCES..............................................................................................................................19
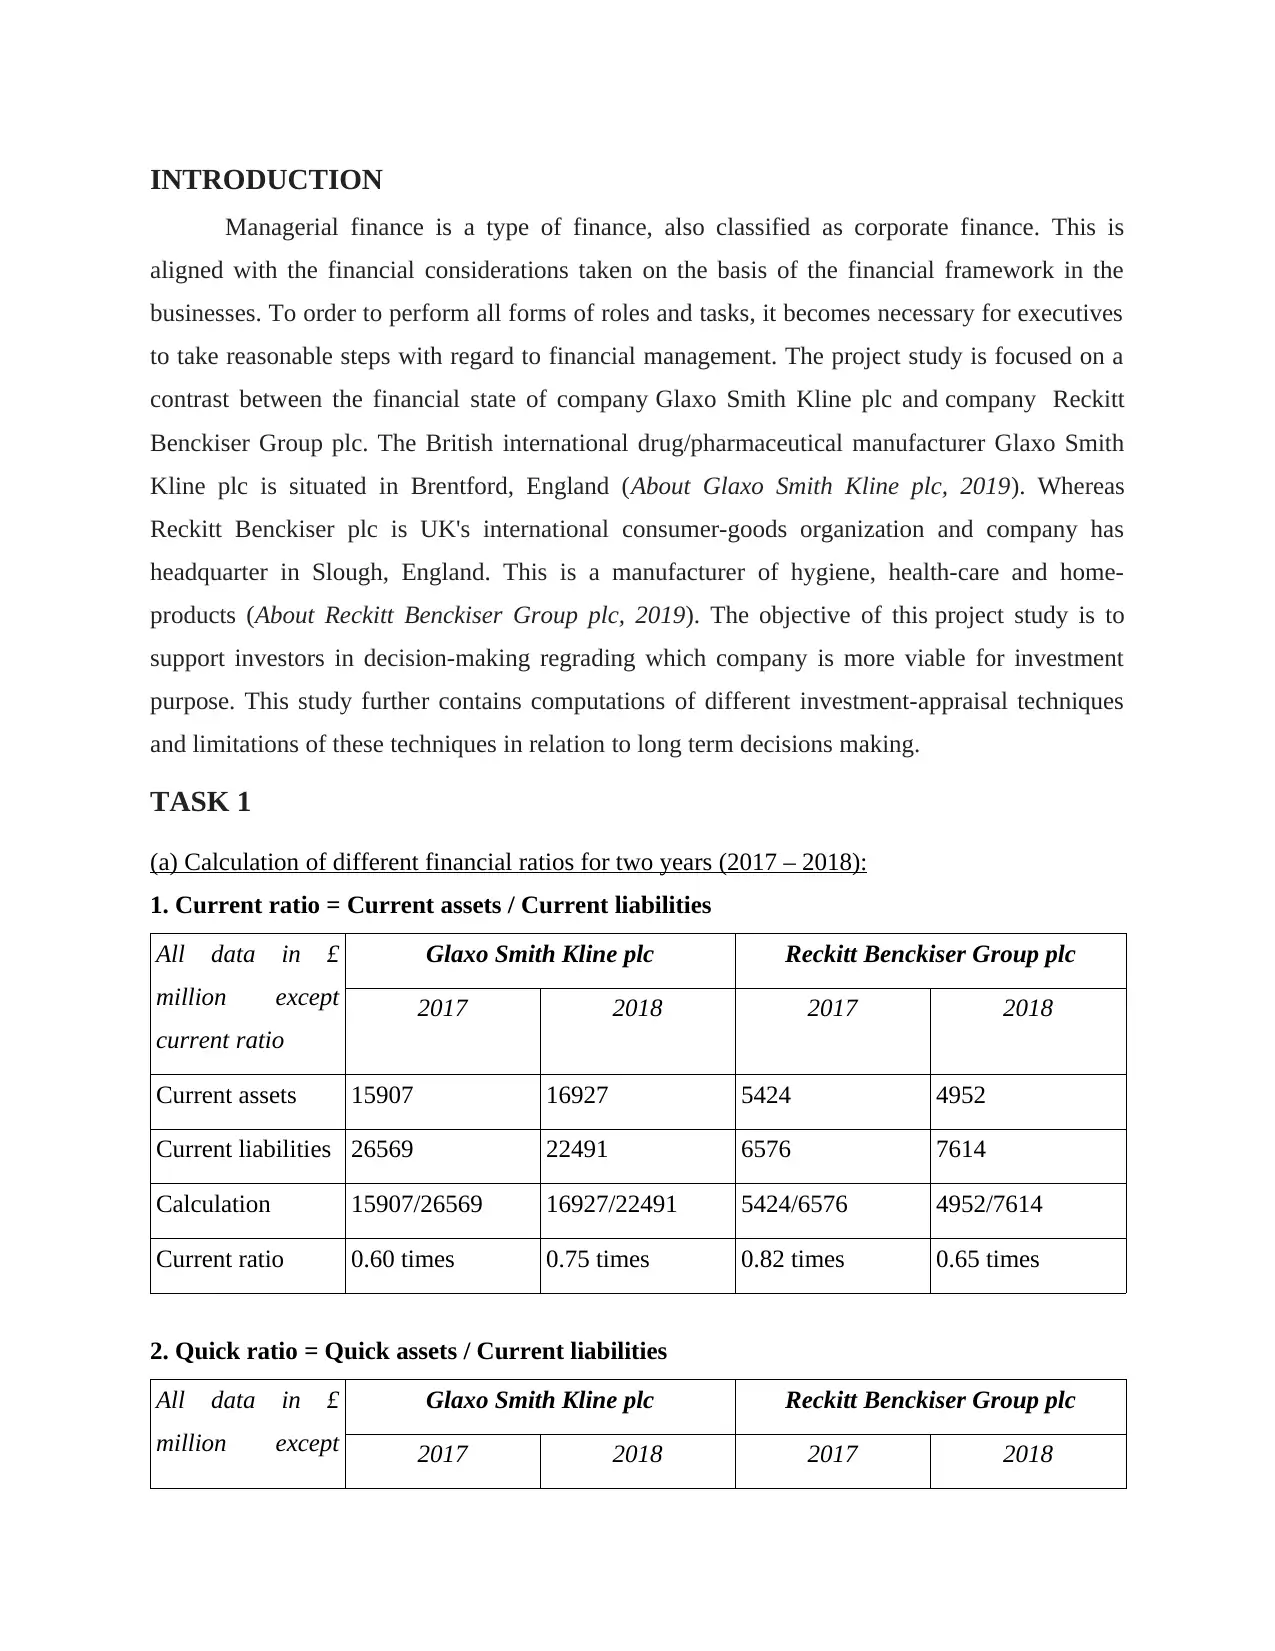
INTRODUCTION
Managerial finance is a type of finance, also classified as corporate finance. This is
aligned with the financial considerations taken on the basis of the financial framework in the
businesses. To order to perform all forms of roles and tasks, it becomes necessary for executives
to take reasonable steps with regard to financial management. The project study is focused on a
contrast between the financial state of company Glaxo Smith Kline plc and company Reckitt
Benckiser Group plc. The British international drug/pharmaceutical manufacturer Glaxo Smith
Kline plc is situated in Brentford, England (About Glaxo Smith Kline plc, 2019). Whereas
Reckitt Benckiser plc is UK's international consumer-goods organization and company has
headquarter in Slough, England. This is a manufacturer of hygiene, health-care and home-
products (About Reckitt Benckiser Group plc, 2019). The objective of this project study is to
support investors in decision-making regrading which company is more viable for investment
purpose. This study further contains computations of different investment-appraisal techniques
and limitations of these techniques in relation to long term decisions making.
TASK 1
(a) Calculation of different financial ratios for two years (2017 – 2018):
1. Current ratio = Current assets / Current liabilities
All data in £
million except
current ratio
Glaxo Smith Kline plc Reckitt Benckiser Group plc
2017 2018 2017 2018
Current assets 15907 16927 5424 4952
Current liabilities 26569 22491 6576 7614
Calculation 15907/26569 16927/22491 5424/6576 4952/7614
Current ratio 0.60 times 0.75 times 0.82 times 0.65 times
2. Quick ratio = Quick assets / Current liabilities
All data in £
million except
Glaxo Smith Kline plc Reckitt Benckiser Group plc
2017 2018 2017 2018
⊘ This is a preview!⊘
Do you want full access?
Subscribe today to unlock all pages.
Trusted by 1+ million students worldwide
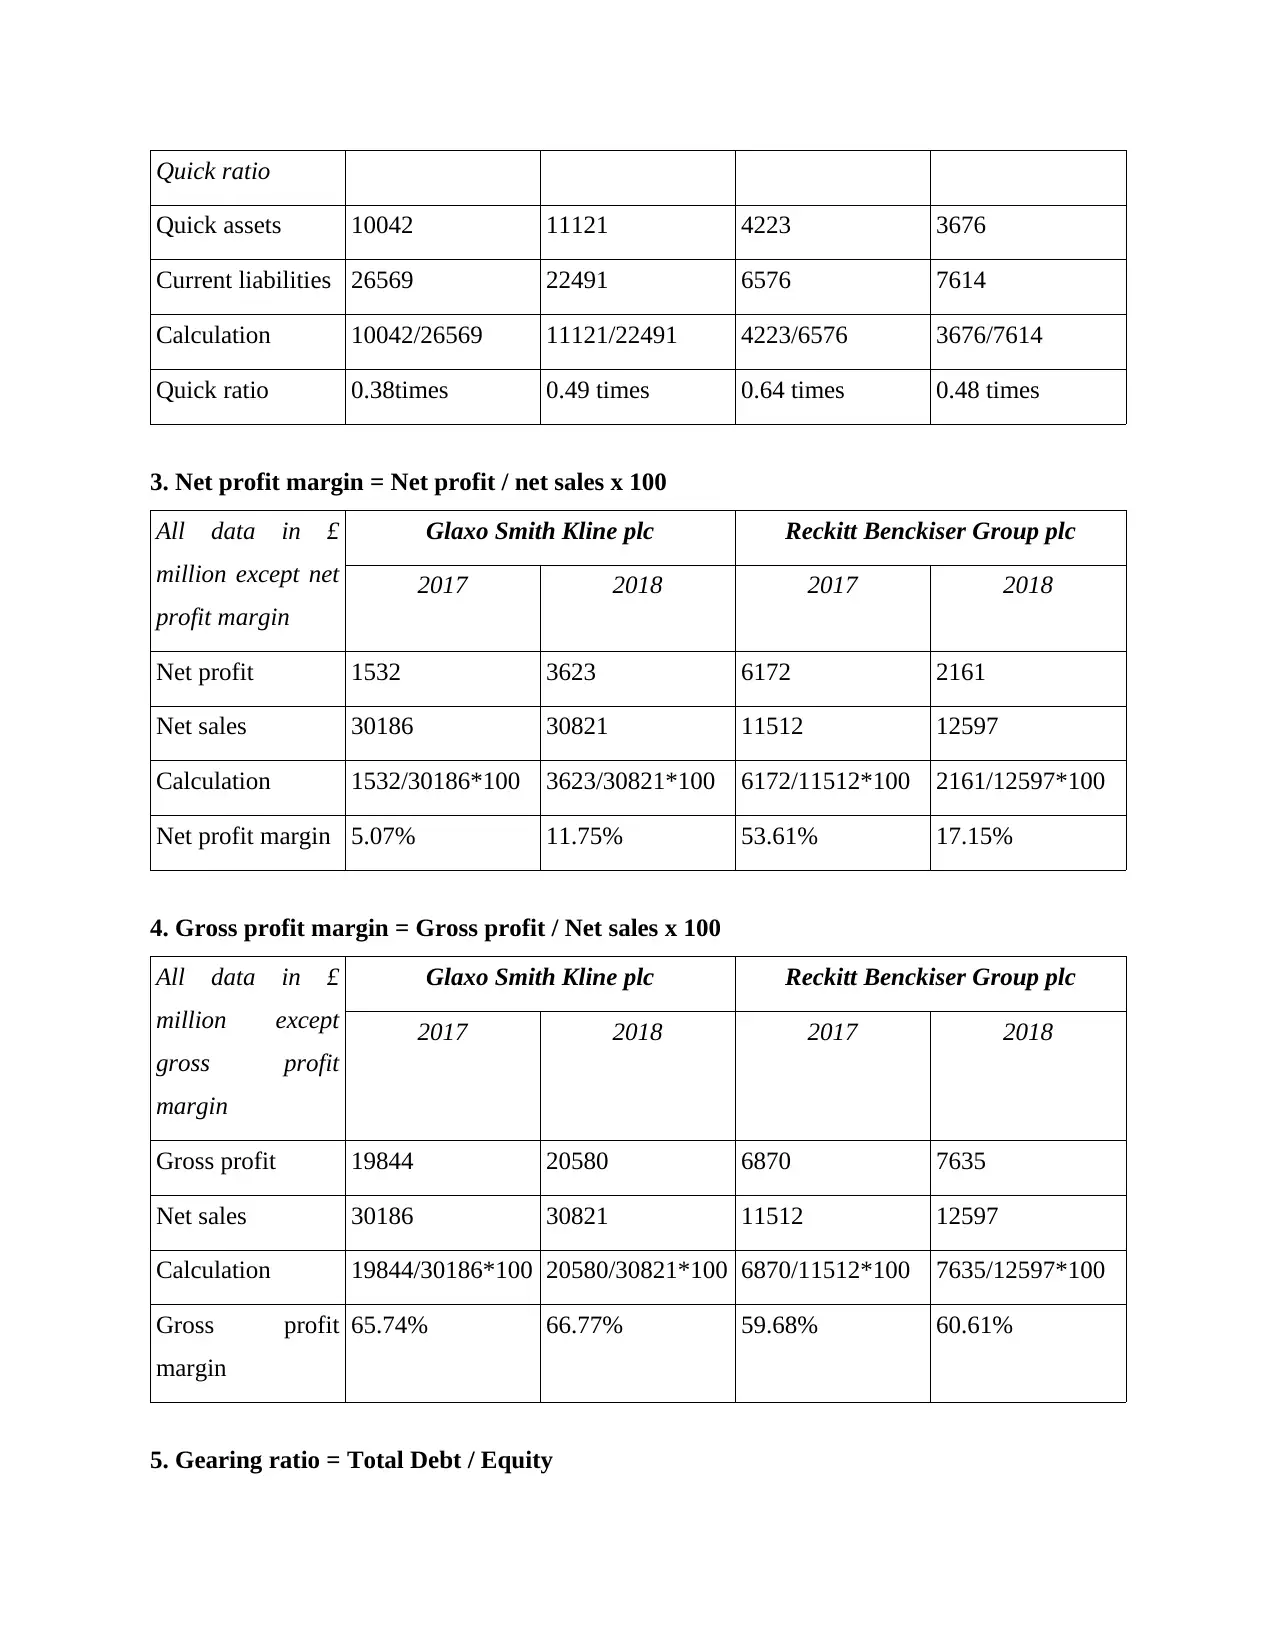
Quick ratio
Quick assets 10042 11121 4223 3676
Current liabilities 26569 22491 6576 7614
Calculation 10042/26569 11121/22491 4223/6576 3676/7614
Quick ratio 0.38times 0.49 times 0.64 times 0.48 times
3. Net profit margin = Net profit / net sales x 100
All data in £
million except net
profit margin
Glaxo Smith Kline plc Reckitt Benckiser Group plc
2017 2018 2017 2018
Net profit 1532 3623 6172 2161
Net sales 30186 30821 11512 12597
Calculation 1532/30186*100 3623/30821*100 6172/11512*100 2161/12597*100
Net profit margin 5.07% 11.75% 53.61% 17.15%
4. Gross profit margin = Gross profit / Net sales x 100
All data in £
million except
gross profit
margin
Glaxo Smith Kline plc Reckitt Benckiser Group plc
2017 2018 2017 2018
Gross profit 19844 20580 6870 7635
Net sales 30186 30821 11512 12597
Calculation 19844/30186*100 20580/30821*100 6870/11512*100 7635/12597*100
Gross profit
margin
65.74% 66.77% 59.68% 60.61%
5. Gearing ratio = Total Debt / Equity
Paraphrase This Document
Need a fresh take? Get an instant paraphrase of this document with our AI Paraphraser
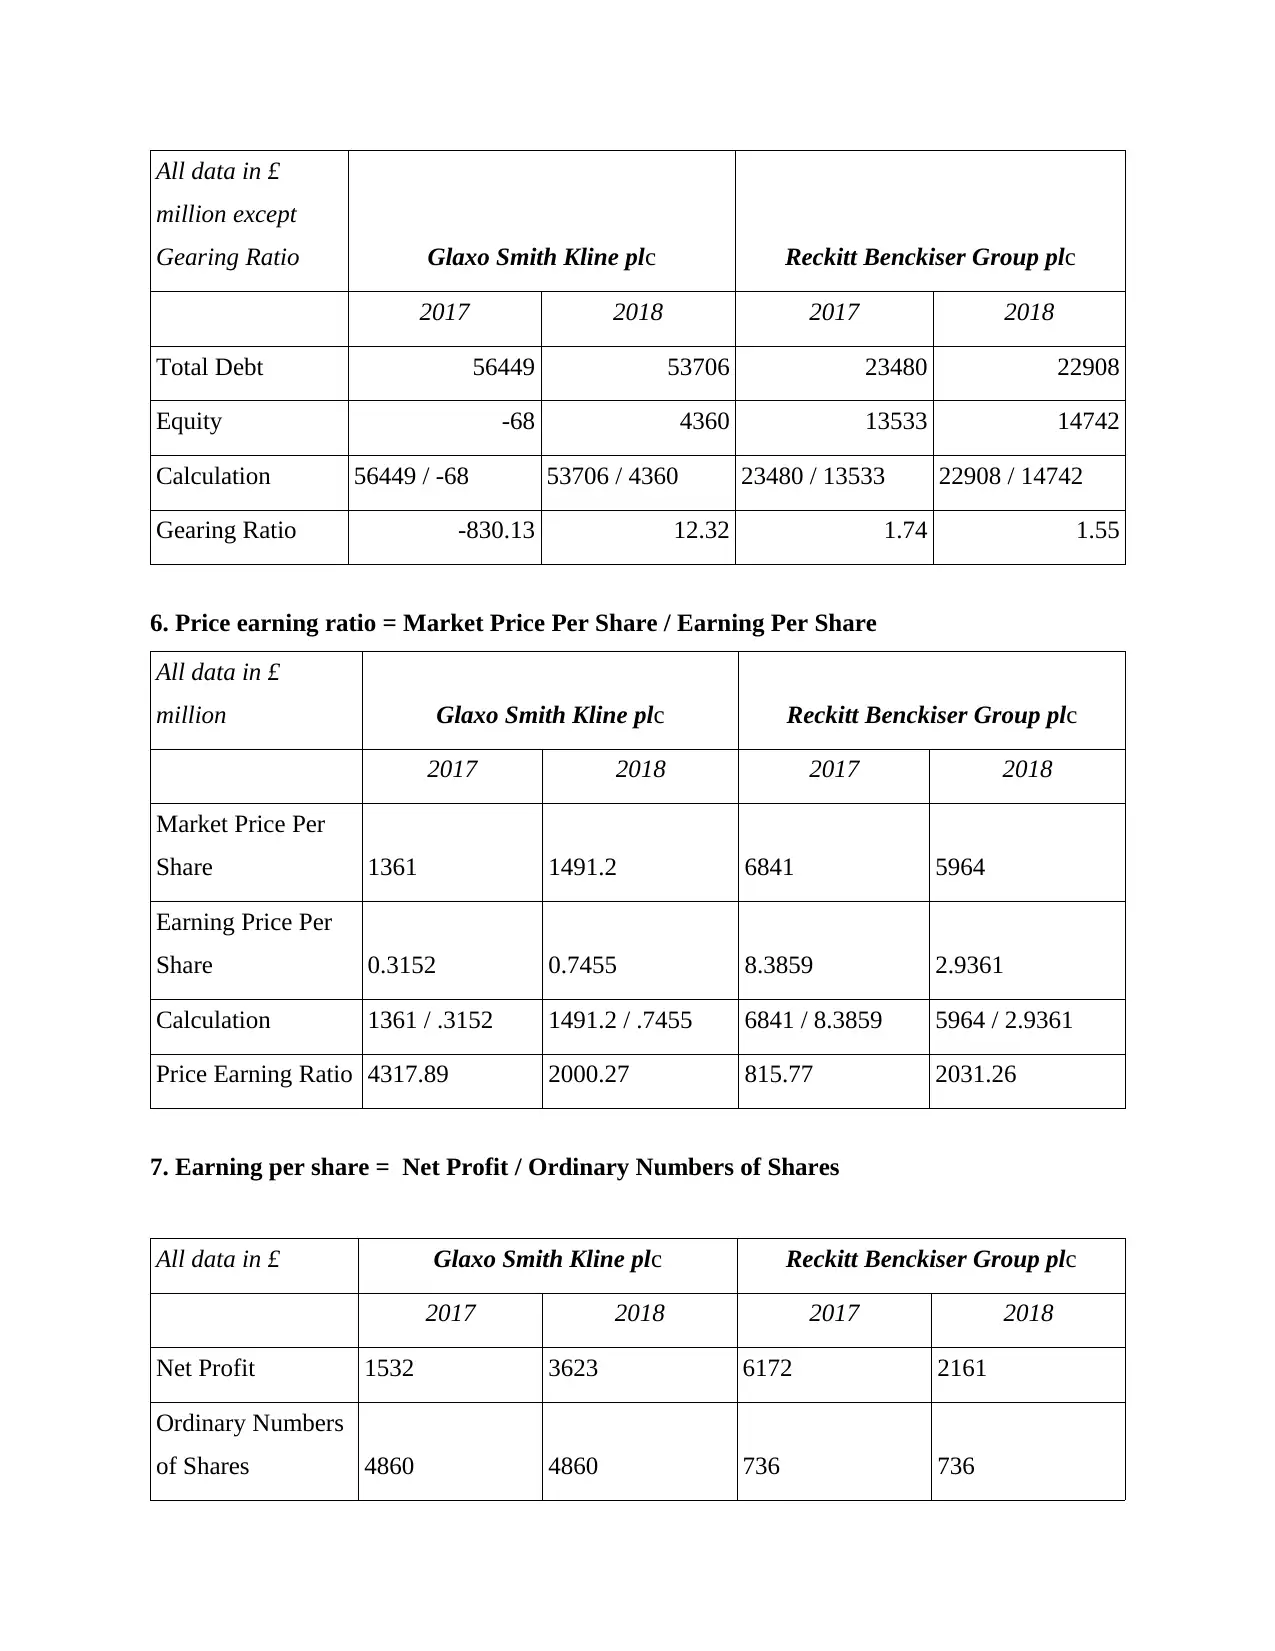
All data in £
million except
Gearing Ratio Glaxo Smith Kline plc Reckitt Benckiser Group plc
2017 2018 2017 2018
Total Debt 56449 53706 23480 22908
Equity -68 4360 13533 14742
Calculation 56449 / -68 53706 / 4360 23480 / 13533 22908 / 14742
Gearing Ratio -830.13 12.32 1.74 1.55
6. Price earning ratio = Market Price Per Share / Earning Per Share
All data in £
million Glaxo Smith Kline plc Reckitt Benckiser Group plc
2017 2018 2017 2018
Market Price Per
Share 1361 1491.2 6841 5964
Earning Price Per
Share 0.3152 0.7455 8.3859 2.9361
Calculation 1361 / .3152 1491.2 / .7455 6841 / 8.3859 5964 / 2.9361
Price Earning Ratio 4317.89 2000.27 815.77 2031.26
7. Earning per share = Net Profit / Ordinary Numbers of Shares
All data in £ Glaxo Smith Kline plc Reckitt Benckiser Group plc
2017 2018 2017 2018
Net Profit 1532 3623 6172 2161
Ordinary Numbers
of Shares 4860 4860 736 736
Calculation 1532/4860 3623/4860 6172/736 2161/736
EPS 0.3152 0.7455 8.3859 2.9361
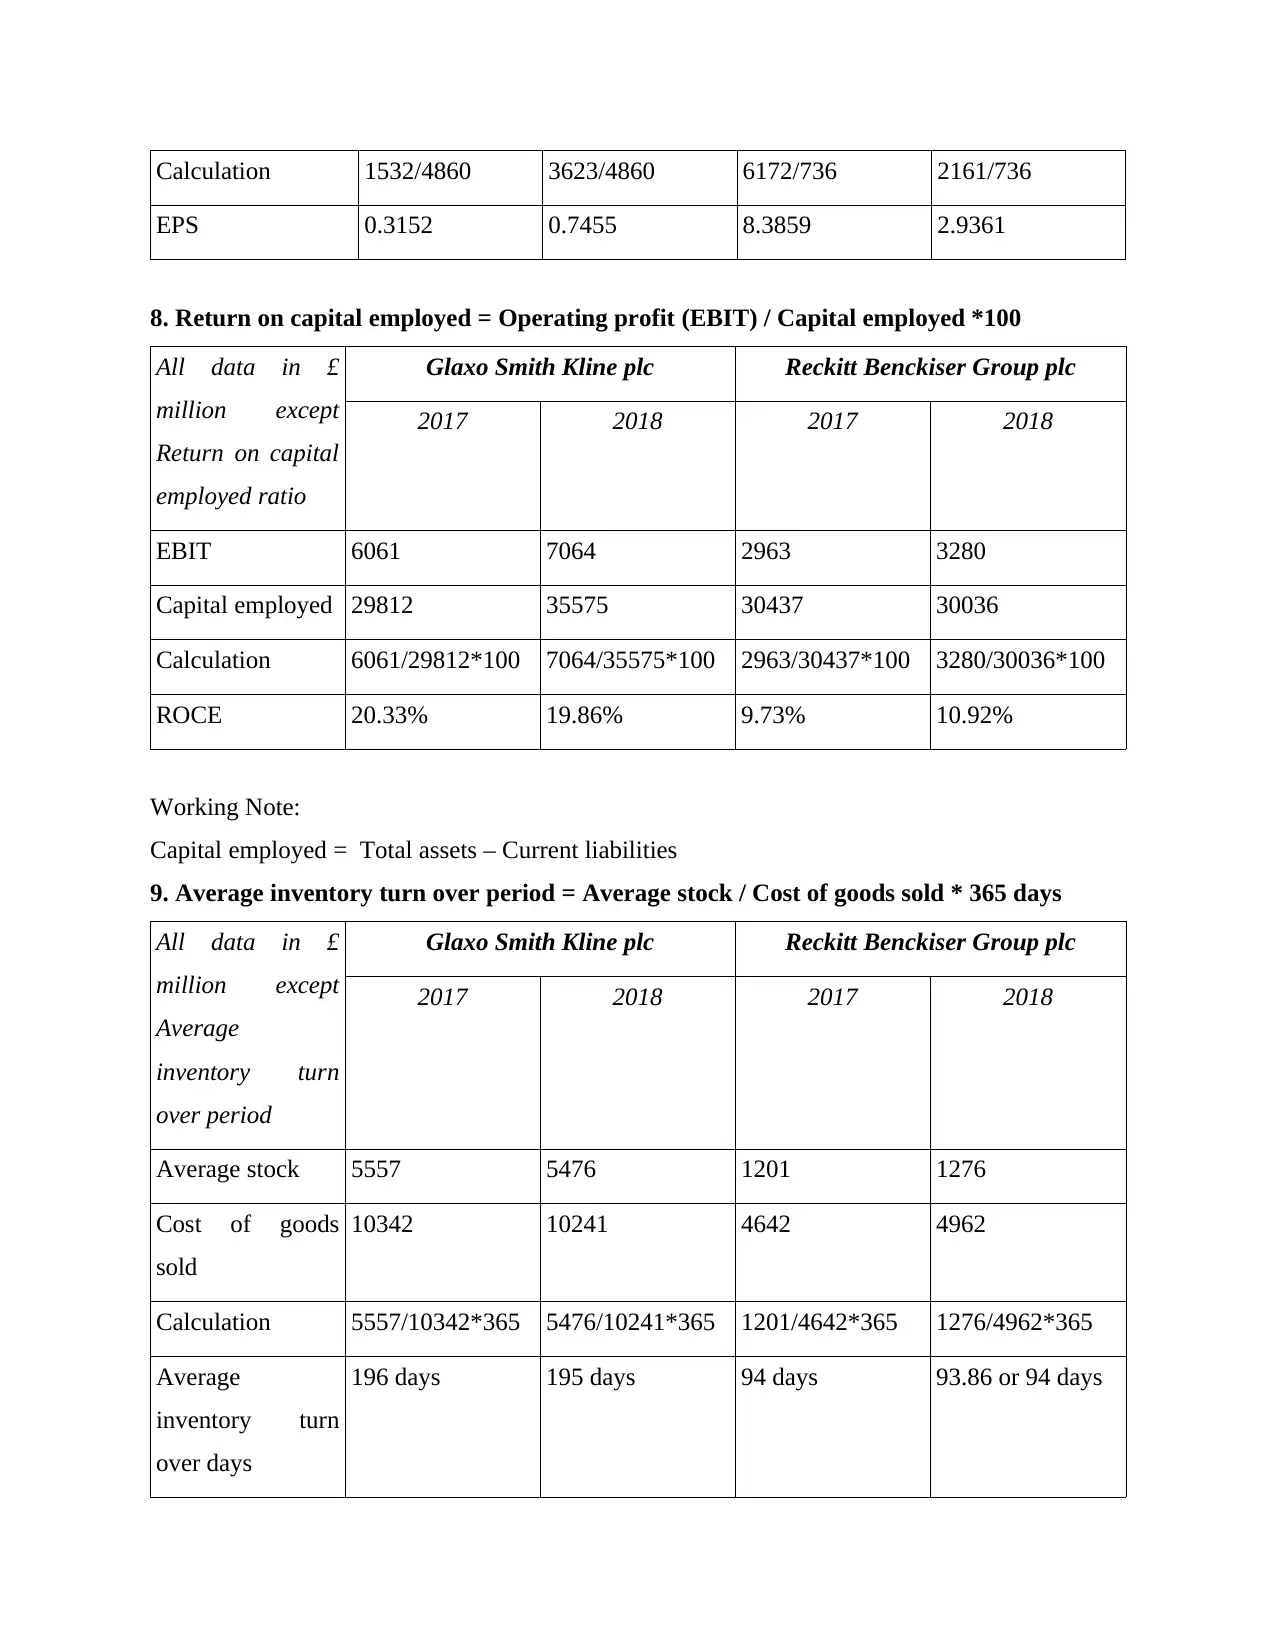
8. Return on capital employed = Operating profit (EBIT) / Capital employed *100
All data in £
million except
Return on capital
employed ratio
Glaxo Smith Kline plc Reckitt Benckiser Group plc
2017 2018 2017 2018
EBIT 6061 7064 2963 3280
Capital employed 29812 35575 30437 30036
Calculation 6061/29812*100 7064/35575*100 2963/30437*100 3280/30036*100
ROCE 20.33% 19.86% 9.73% 10.92%
Working Note:
Capital employed = Total assets – Current liabilities
9. Average inventory turn over period = Average stock / Cost of goods sold * 365 days
All data in £
million except
Average
inventory turn
over period
Glaxo Smith Kline plc Reckitt Benckiser Group plc
2017 2018 2017 2018
Average stock 5557 5476 1201 1276
Cost of goods
sold
10342 10241 4642 4962
Calculation 5557/10342*365 5476/10241*365 1201/4642*365 1276/4962*365
Average
inventory turn
over days
196 days 195 days 94 days 93.86 or 94 days
EPS 0.3152 0.7455 8.3859 2.9361
8. Return on capital employed = Operating profit (EBIT) / Capital employed *100
All data in £
million except
Return on capital
employed ratio
Glaxo Smith Kline plc Reckitt Benckiser Group plc
2017 2018 2017 2018
EBIT 6061 7064 2963 3280
Capital employed 29812 35575 30437 30036
Calculation 6061/29812*100 7064/35575*100 2963/30437*100 3280/30036*100
ROCE 20.33% 19.86% 9.73% 10.92%
Working Note:
Capital employed = Total assets – Current liabilities
9. Average inventory turn over period = Average stock / Cost of goods sold * 365 days
All data in £
million except
Average
inventory turn
over period
Glaxo Smith Kline plc Reckitt Benckiser Group plc
2017 2018 2017 2018
Average stock 5557 5476 1201 1276
Cost of goods
sold
10342 10241 4642 4962
Calculation 5557/10342*365 5476/10241*365 1201/4642*365 1276/4962*365
Average
inventory turn
over days
196 days 195 days 94 days 93.86 or 94 days
⊘ This is a preview!⊘
Do you want full access?
Subscribe today to unlock all pages.
Trusted by 1+ million students worldwide
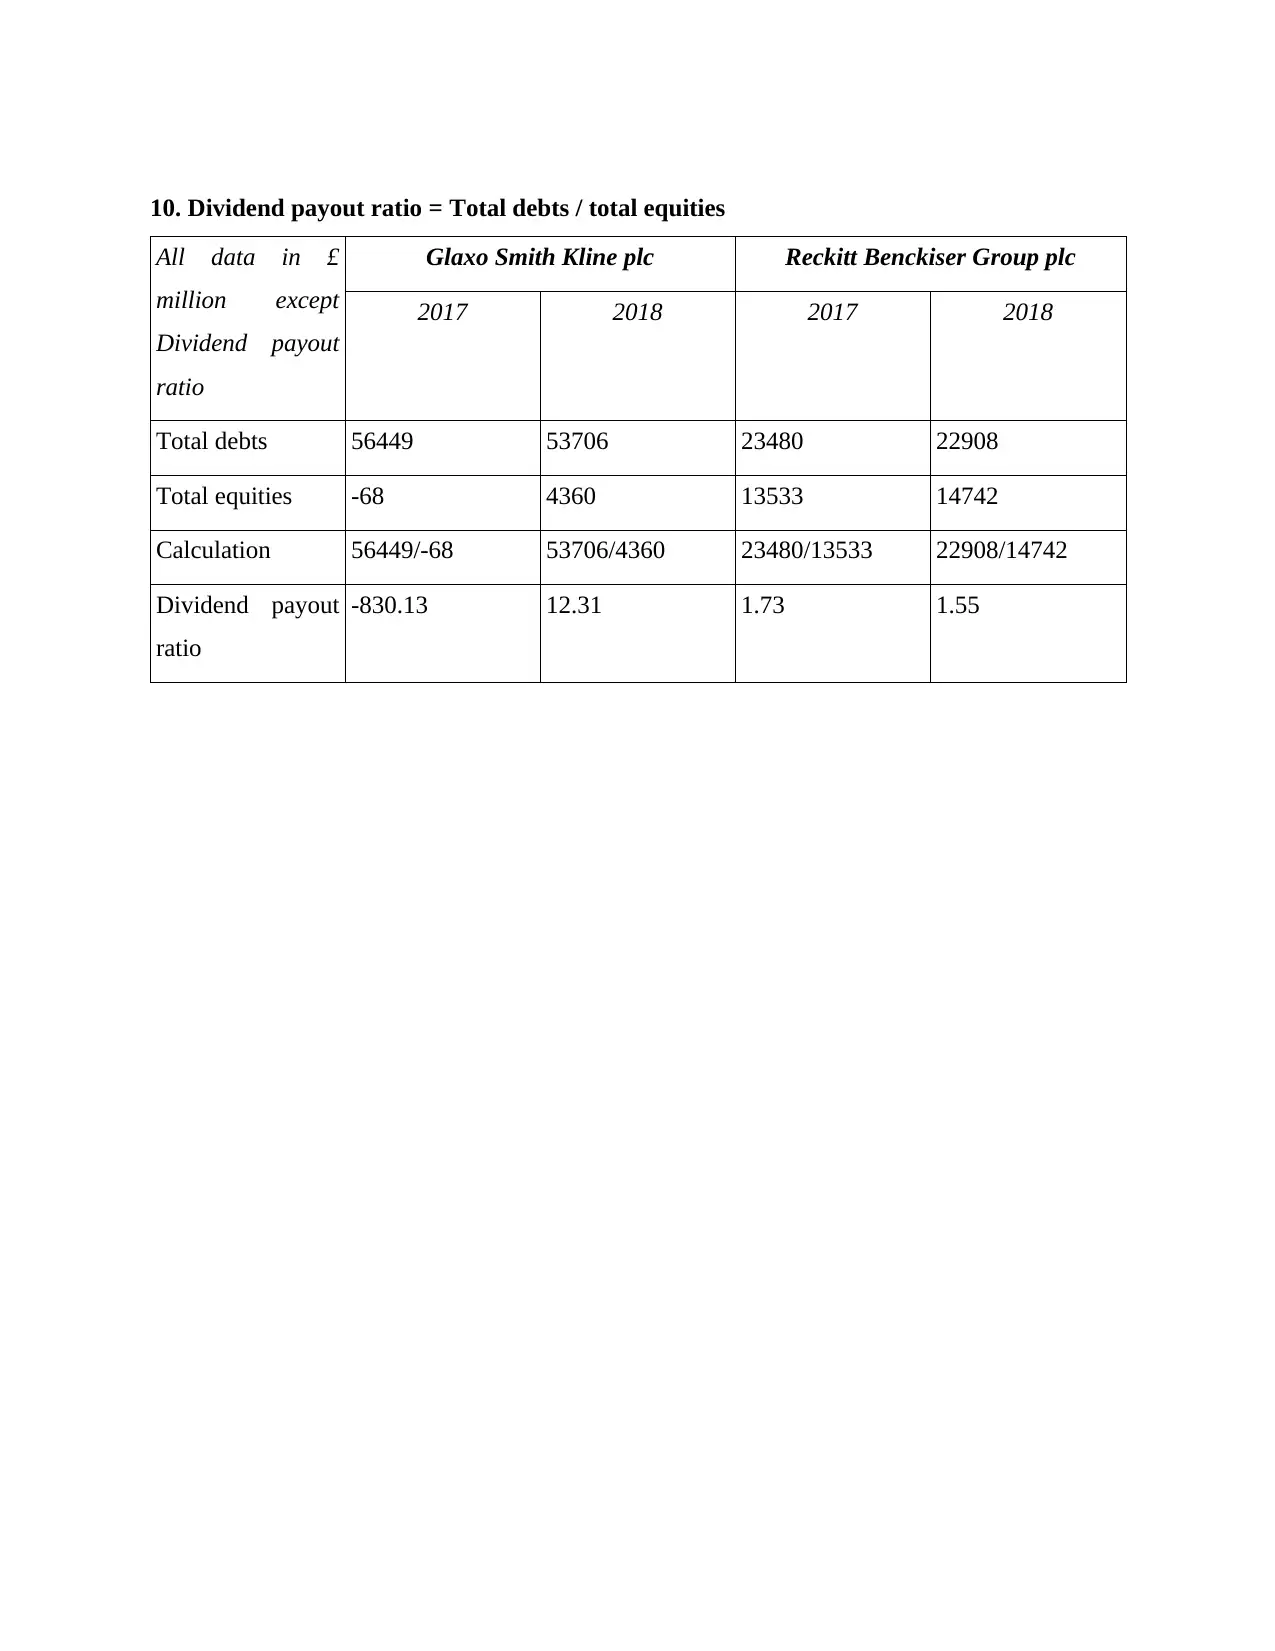
10. Dividend payout ratio = Total debts / total equities
All data in £
million except
Dividend payout
ratio
Glaxo Smith Kline plc Reckitt Benckiser Group plc
2017 2018 2017 2018
Total debts 56449 53706 23480 22908
Total equities -68 4360 13533 14742
Calculation 56449/-68 53706/4360 23480/13533 22908/14742
Dividend payout
ratio
-830.13 12.31 1.73 1.55
All data in £
million except
Dividend payout
ratio
Glaxo Smith Kline plc Reckitt Benckiser Group plc
2017 2018 2017 2018
Total debts 56449 53706 23480 22908
Total equities -68 4360 13533 14742
Calculation 56449/-68 53706/4360 23480/13533 22908/14742
Dividend payout
ratio
-830.13 12.31 1.73 1.55
Paraphrase This Document
Need a fresh take? Get an instant paraphrase of this document with our AI Paraphraser
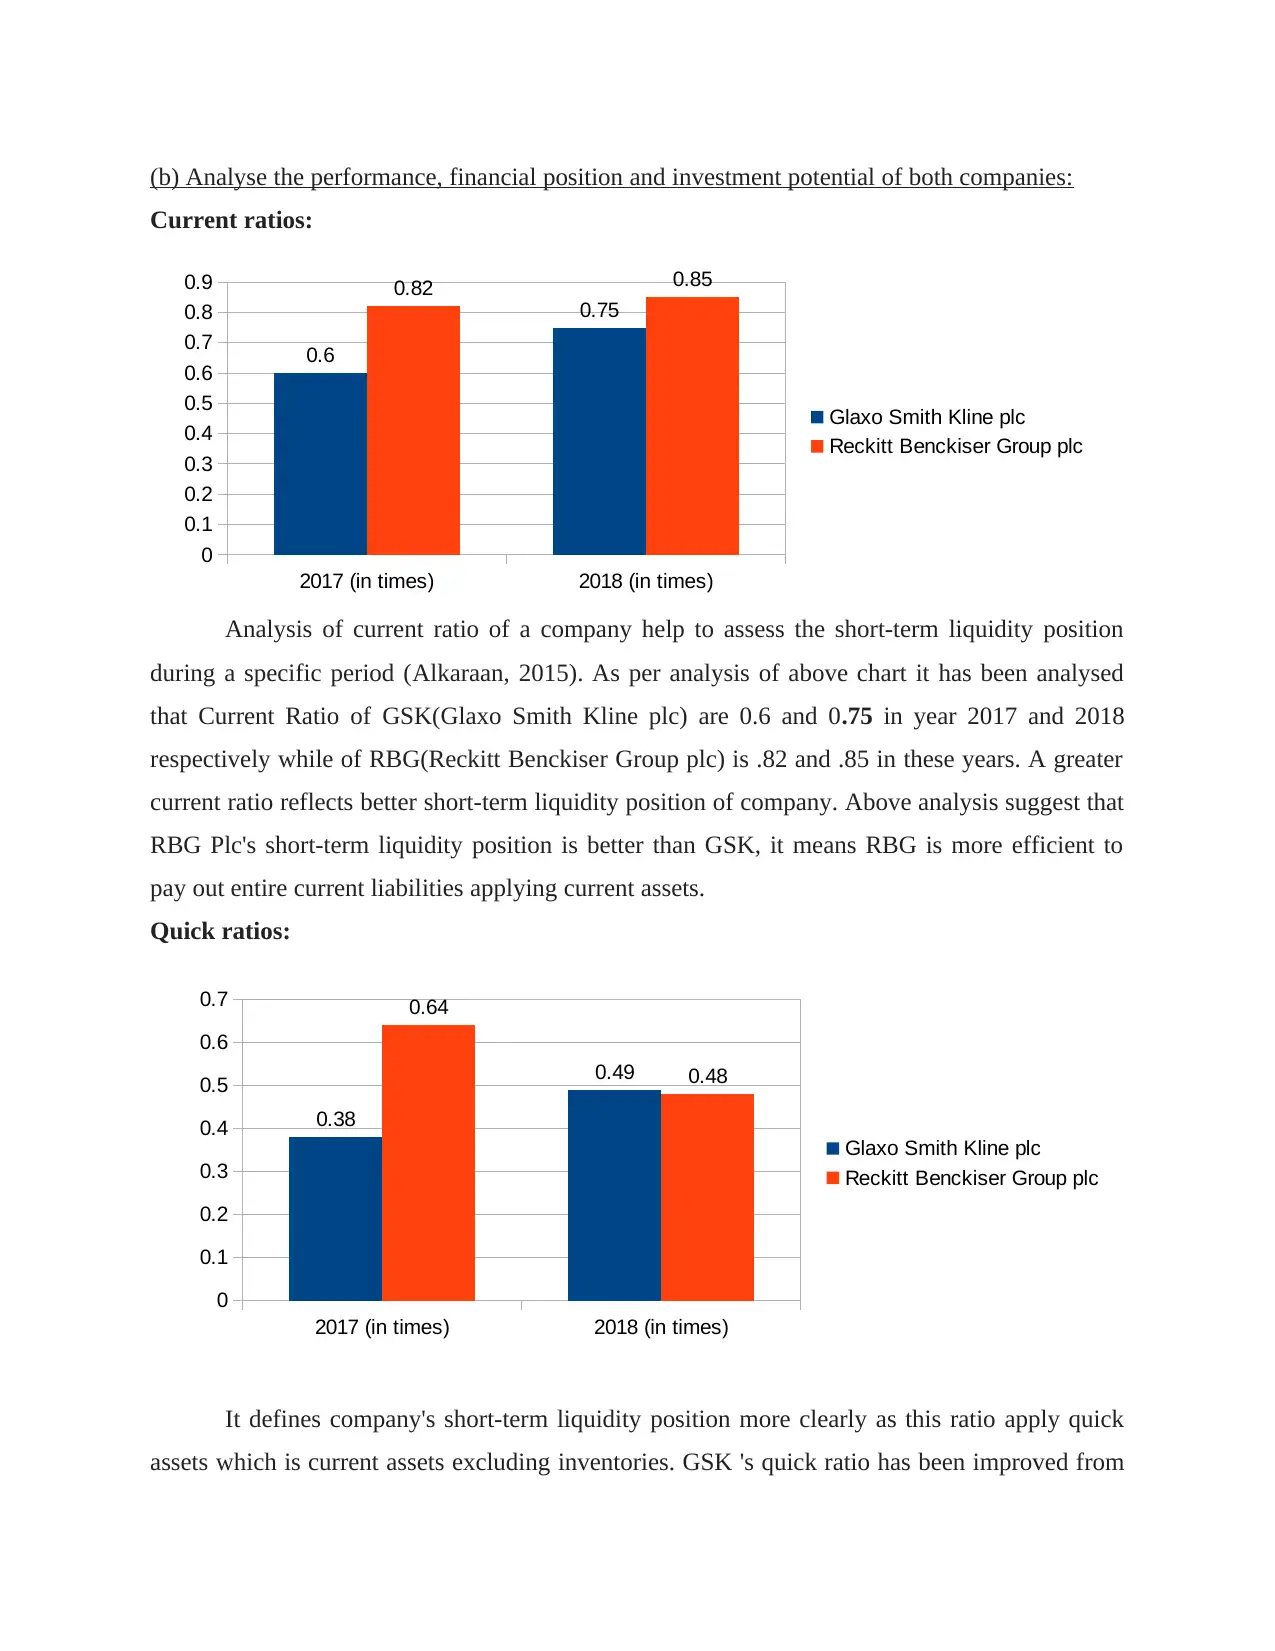
(b) Analyse the performance, financial position and investment potential of both companies:
Current ratios:
Analysis of current ratio of a company help to assess the short-term liquidity position
during a specific period (Alkaraan, 2015). As per analysis of above chart it has been analysed
that Current Ratio of GSK(Glaxo Smith Kline plc) are 0.6 and 0.75 in year 2017 and 2018
respectively while of RBG(Reckitt Benckiser Group plc) is .82 and .85 in these years. A greater
current ratio reflects better short-term liquidity position of company. Above analysis suggest that
RBG Plc's short-term liquidity position is better than GSK, it means RBG is more efficient to
pay out entire current liabilities applying current assets.
Quick ratios:
It defines company's short-term liquidity position more clearly as this ratio apply quick
assets which is current assets excluding inventories. GSK 's quick ratio has been improved from
2017 (in times) 2018 (in times)
0
0.1
0.2
0.3
0.4
0.5
0.6
0.7
0.8
0.9
0.6
0.75
0.82 0.85
Glaxo Smith Kline plc
Reckitt Benckiser Group plc
2017 (in times) 2018 (in times)
0
0.1
0.2
0.3
0.4
0.5
0.6
0.7
0.38
0.49
0.64
0.48
Glaxo Smith Kline plc
Reckitt Benckiser Group plc
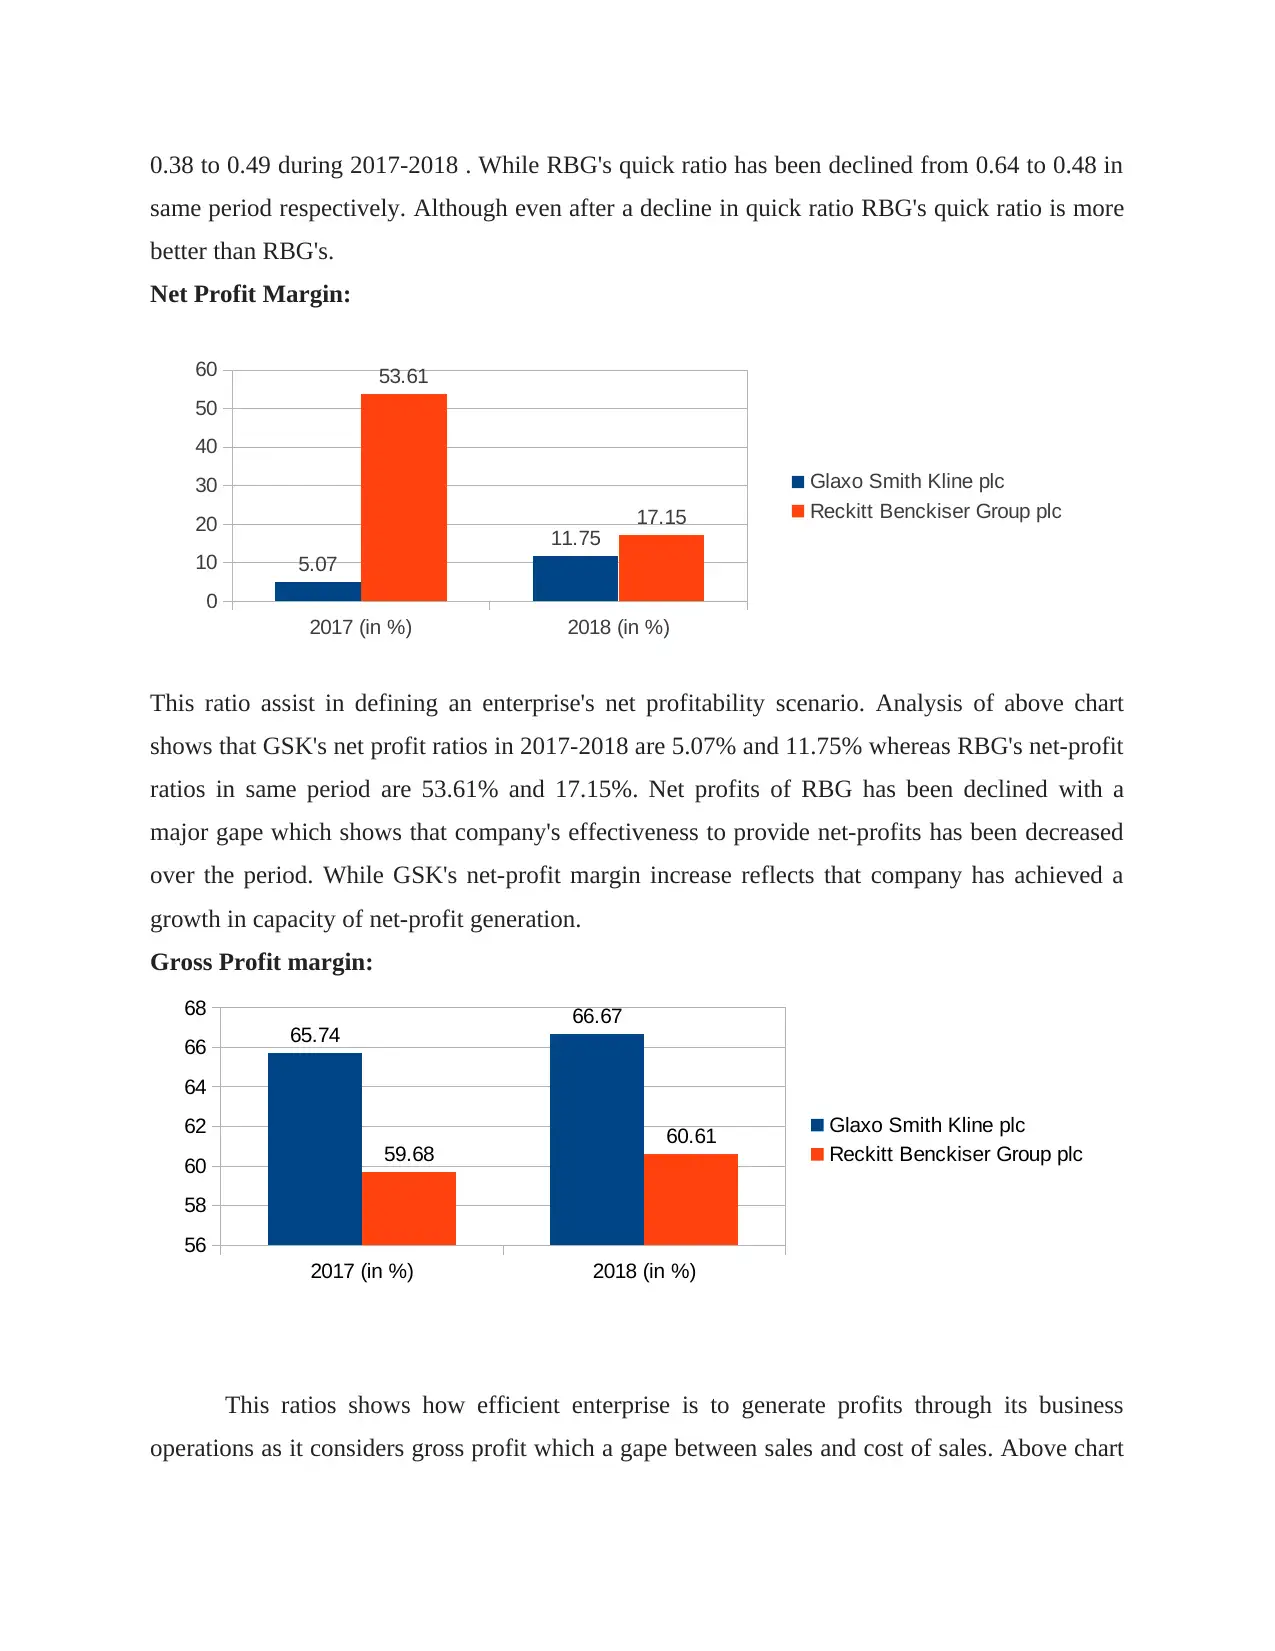
0.38 to 0.49 during 2017-2018 . While RBG's quick ratio has been declined from 0.64 to 0.48 in
same period respectively. Although even after a decline in quick ratio RBG's quick ratio is more
better than RBG's.
Net Profit Margin:
2017 (in %) 2018 (in %)
0
10
20
30
40
50
60
5.07
11.75
53.61
17.15
Glaxo Smith Kline plc
Reckitt Benckiser Group plc
This ratio assist in defining an enterprise's net profitability scenario. Analysis of above chart
shows that GSK's net profit ratios in 2017-2018 are 5.07% and 11.75% whereas RBG's net-profit
ratios in same period are 53.61% and 17.15%. Net profits of RBG has been declined with a
major gape which shows that company's effectiveness to provide net-profits has been decreased
over the period. While GSK's net-profit margin increase reflects that company has achieved a
growth in capacity of net-profit generation.
Gross Profit margin:
This ratios shows how efficient enterprise is to generate profits through its business
operations as it considers gross profit which a gape between sales and cost of sales. Above chart
2017 (in %) 2018 (in %)
56
58
60
62
64
66
68
65.74 66.67
59.68 60.61 Glaxo Smith Kline plc
Reckitt Benckiser Group plc
⊘ This is a preview!⊘
Do you want full access?
Subscribe today to unlock all pages.
Trusted by 1+ million students worldwide
shows that GSK's gross profit margin level is much better than RBG. Gross margin of GSK in
2017-2018 are 65.74% and 66.67% (increase) while of RBG are 59.68% and 60.61% (Increase)
respectively. So in terms of Gross margin generation capacity company GSK is more efficient as
compare to RBG.
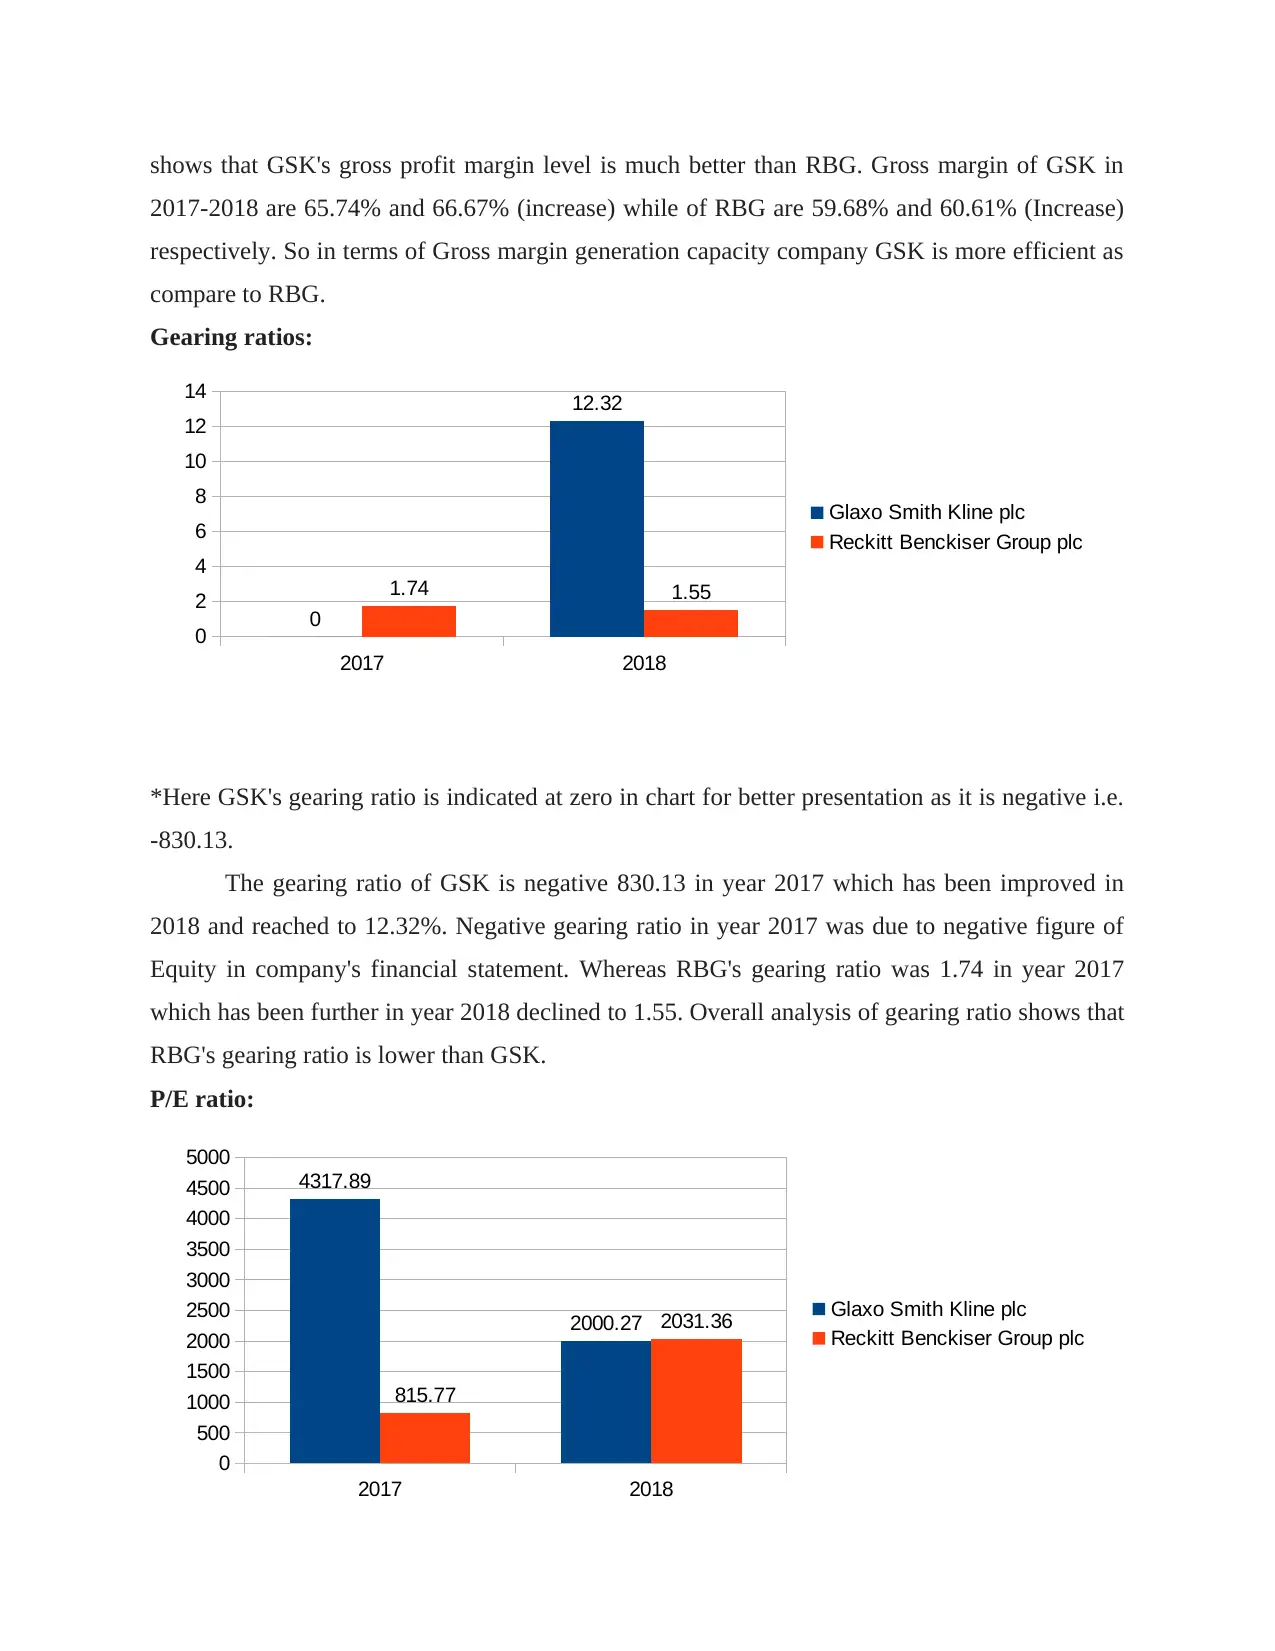
Gearing ratios:
*Here GSK's gearing ratio is indicated at zero in chart for better presentation as it is negative i.e.
-830.13.
The gearing ratio of GSK is negative 830.13 in year 2017 which has been improved in
2018 and reached to 12.32%. Negative gearing ratio in year 2017 was due to negative figure of
Equity in company's financial statement. Whereas RBG's gearing ratio was 1.74 in year 2017
which has been further in year 2018 declined to 1.55. Overall analysis of gearing ratio shows that
RBG's gearing ratio is lower than GSK.
P/E ratio:
2017 2018
0
2
4
6
8
10
12
14
0
12.32
1.74 1.55
Glaxo Smith Kline plc
Reckitt Benckiser Group plc
2017 2018
0
500
1000
1500
2000
2500
3000
3500
4000
4500
5000
4317.89
2000.27
815.77
2031.36 Glaxo Smith Kline plc
Reckitt Benckiser Group plc
2017-2018 are 65.74% and 66.67% (increase) while of RBG are 59.68% and 60.61% (Increase)
respectively. So in terms of Gross margin generation capacity company GSK is more efficient as
compare to RBG.
Gearing ratios:
*Here GSK's gearing ratio is indicated at zero in chart for better presentation as it is negative i.e.
-830.13.
The gearing ratio of GSK is negative 830.13 in year 2017 which has been improved in
2018 and reached to 12.32%. Negative gearing ratio in year 2017 was due to negative figure of
Equity in company's financial statement. Whereas RBG's gearing ratio was 1.74 in year 2017
which has been further in year 2018 declined to 1.55. Overall analysis of gearing ratio shows that
RBG's gearing ratio is lower than GSK.
P/E ratio:
2017 2018
0
2
4
6
8
10
12
14
0
12.32
1.74 1.55
Glaxo Smith Kline plc
Reckitt Benckiser Group plc
2017 2018
0
500
1000
1500
2000
2500
3000
3500
4000
4500
5000
4317.89
2000.27
815.77
2031.36 Glaxo Smith Kline plc
Reckitt Benckiser Group plc
Paraphrase This Document
Need a fresh take? Get an instant paraphrase of this document with our AI Paraphraser
A high P / E indicate that the price of a stock is high compared to incomes and may be
overvalued. There is major decline in GSK's PE ratio from 4317.89 to 2000.27 in period 2017 to
2018. While RBG's PE ratio has been improved from 815.77 to 2031.36 during 2017 and 2018
respectively. Comparatively RBG's performance in terms of Gearing Ratio is much better than
GSK as of increase in PE indicates the enhancement of trust of shareholders in company.
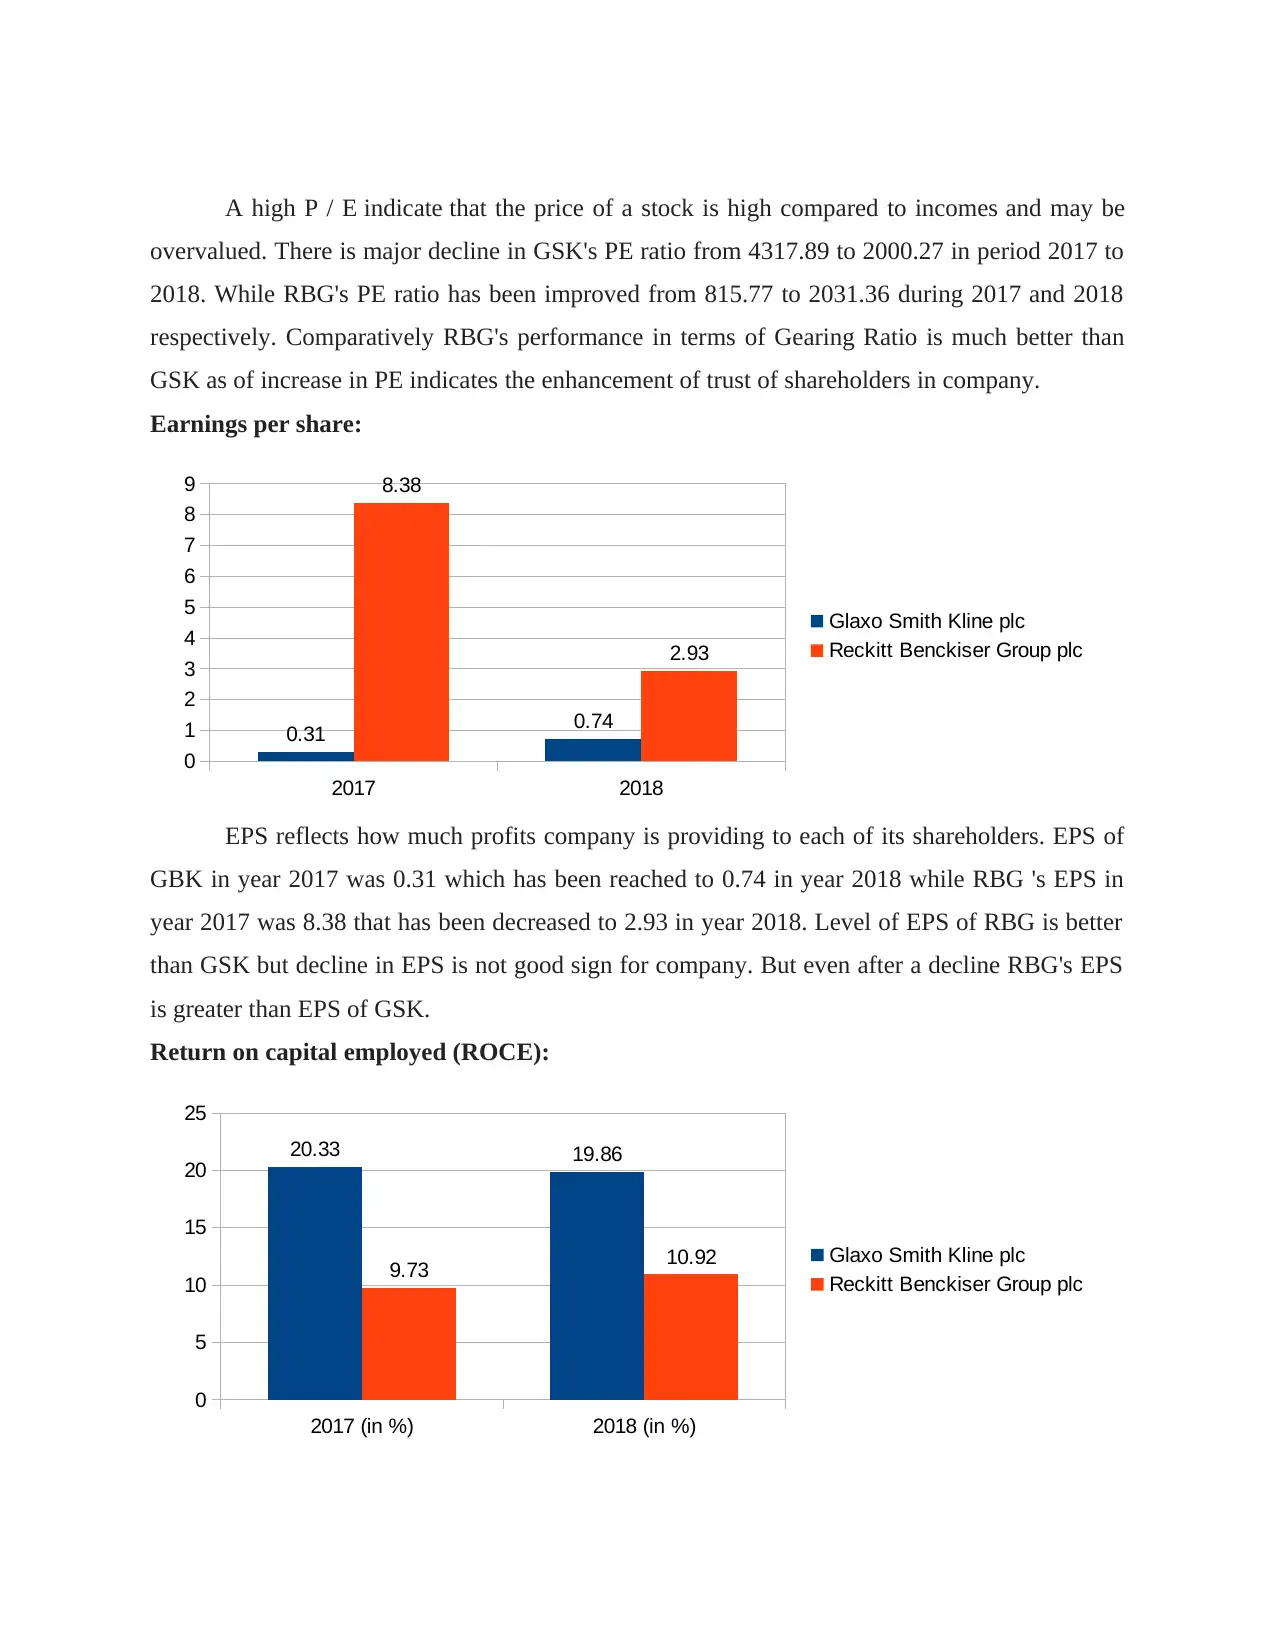
Earnings per share:
EPS reflects how much profits company is providing to each of its shareholders. EPS of
GBK in year 2017 was 0.31 which has been reached to 0.74 in year 2018 while RBG 's EPS in
year 2017 was 8.38 that has been decreased to 2.93 in year 2018. Level of EPS of RBG is better
than GSK but decline in EPS is not good sign for company. But even after a decline RBG's EPS
is greater than EPS of GSK.
Return on capital employed (ROCE):
2017 2018
0
1
2
3
4
5
6
7
8
9
0.31 0.74
8.38
2.93
Glaxo Smith Kline plc
Reckitt Benckiser Group plc
2017 (in %) 2018 (in %)
0
5
10
15
20
25
20.33 19.86
9.73 10.92 Glaxo Smith Kline plc
Reckitt Benckiser Group plc
overvalued. There is major decline in GSK's PE ratio from 4317.89 to 2000.27 in period 2017 to
2018. While RBG's PE ratio has been improved from 815.77 to 2031.36 during 2017 and 2018
respectively. Comparatively RBG's performance in terms of Gearing Ratio is much better than
GSK as of increase in PE indicates the enhancement of trust of shareholders in company.
Earnings per share:
EPS reflects how much profits company is providing to each of its shareholders. EPS of
GBK in year 2017 was 0.31 which has been reached to 0.74 in year 2018 while RBG 's EPS in
year 2017 was 8.38 that has been decreased to 2.93 in year 2018. Level of EPS of RBG is better
than GSK but decline in EPS is not good sign for company. But even after a decline RBG's EPS
is greater than EPS of GSK.
Return on capital employed (ROCE):
2017 2018
0
1
2
3
4
5
6
7
8
9
0.31 0.74
8.38
2.93
Glaxo Smith Kline plc
Reckitt Benckiser Group plc
2017 (in %) 2018 (in %)
0
5
10
15
20
25
20.33 19.86
9.73 10.92 Glaxo Smith Kline plc
Reckitt Benckiser Group plc
This ratio shows an enterprise's efficiency to utilise employed capital in order to provide
effective return on employed-capital (Harris, 2017). ROCE of GSK plc are 20.33 % and 19.86 %
in year 2017 and 2018 respectively while of RBG are 9.73 % and 10.92 % in during same period.
There is a decline in GSK's ROCE but overall level of ROCE is greater than RBG.
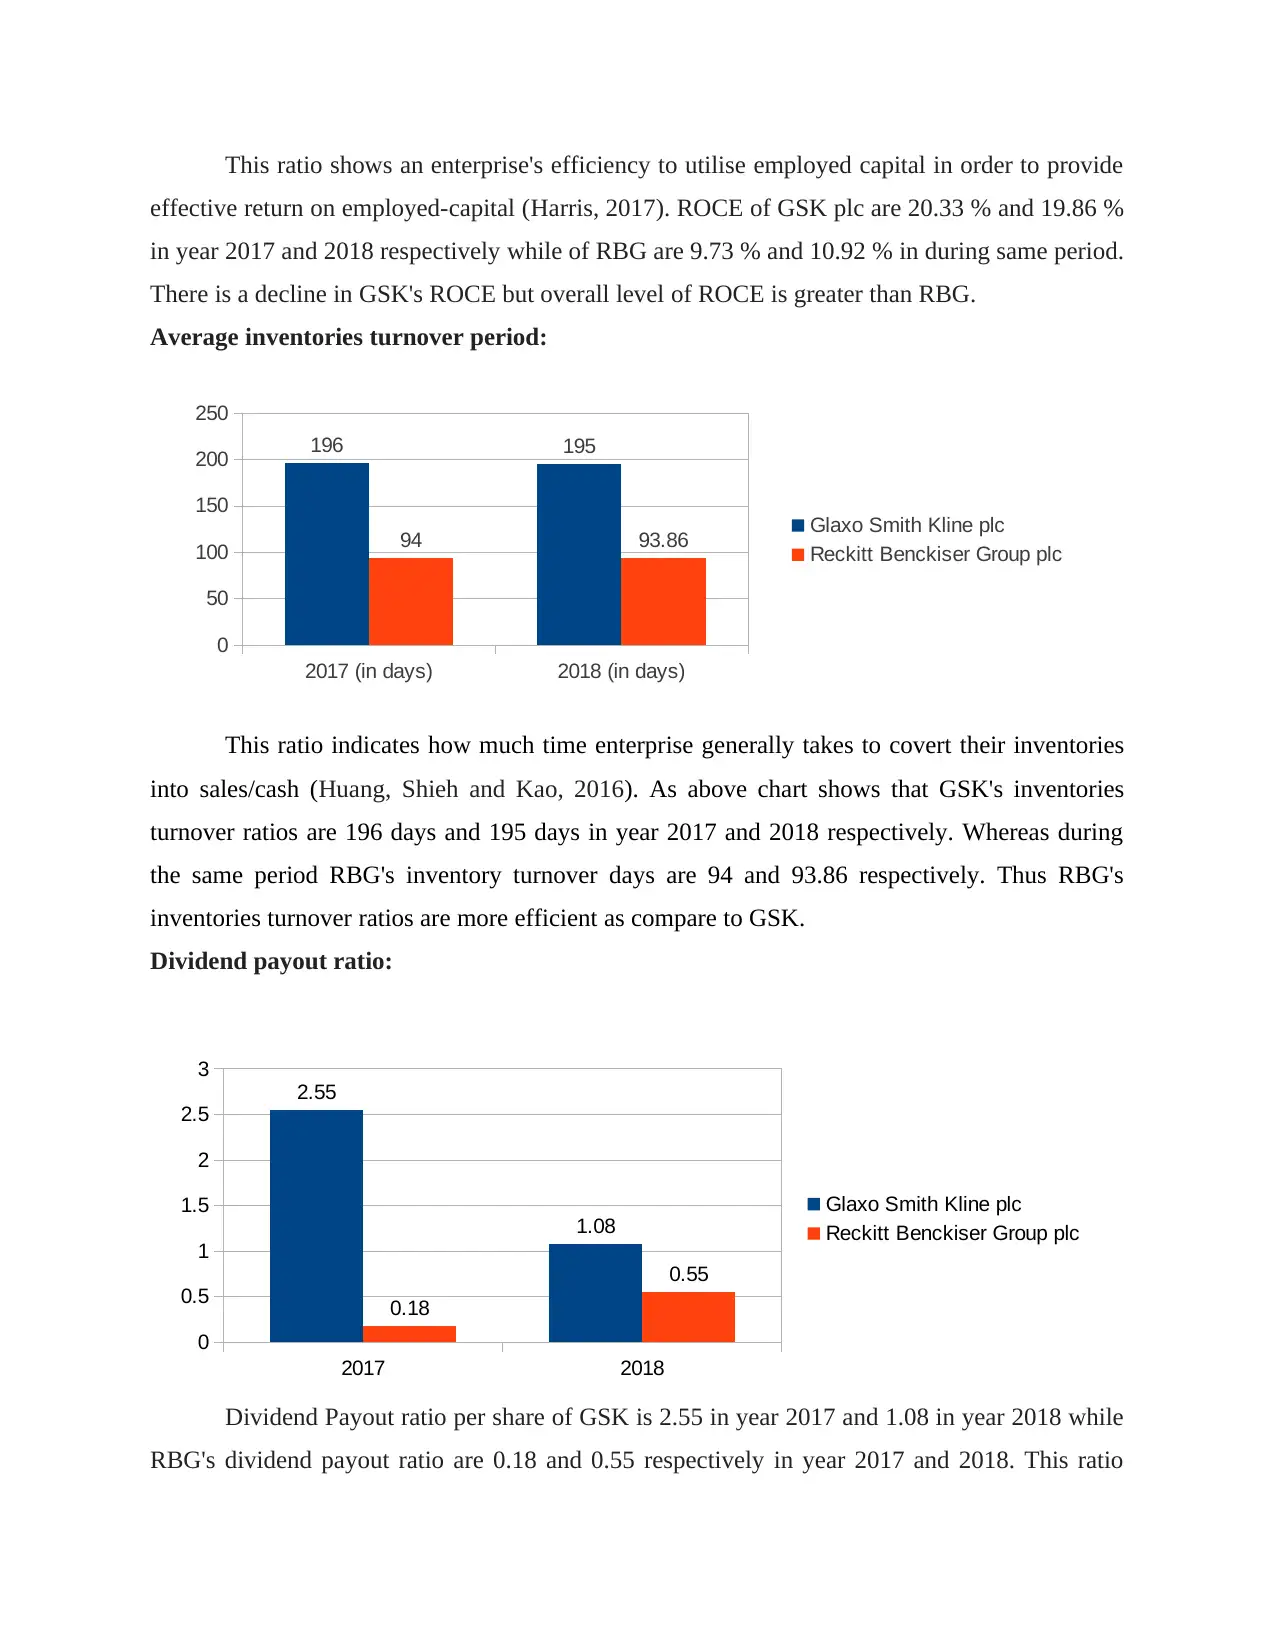
Average inventories turnover period:
2017 (in days) 2018 (in days)
0
50
100
150
200
250
196 195
94 93.86 Glaxo Smith Kline plc
Reckitt Benckiser Group plc
This ratio indicates how much time enterprise generally takes to covert their inventories
into sales/cash (Huang, Shieh and Kao, 2016). As above chart shows that GSK's inventories
turnover ratios are 196 days and 195 days in year 2017 and 2018 respectively. Whereas during
the same period RBG's inventory turnover days are 94 and 93.86 respectively. Thus RBG's
inventories turnover ratios are more efficient as compare to GSK.
Dividend payout ratio:
Dividend Payout ratio per share of GSK is 2.55 in year 2017 and 1.08 in year 2018 while
RBG's dividend payout ratio are 0.18 and 0.55 respectively in year 2017 and 2018. This ratio
2017 2018
0
0.5
1
1.5
2
2.5
3
2.55
1.08
0.18
0.55
Glaxo Smith Kline plc
Reckitt Benckiser Group plc
effective return on employed-capital (Harris, 2017). ROCE of GSK plc are 20.33 % and 19.86 %
in year 2017 and 2018 respectively while of RBG are 9.73 % and 10.92 % in during same period.
There is a decline in GSK's ROCE but overall level of ROCE is greater than RBG.
Average inventories turnover period:
2017 (in days) 2018 (in days)
0
50
100
150
200
250
196 195
94 93.86 Glaxo Smith Kline plc
Reckitt Benckiser Group plc
This ratio indicates how much time enterprise generally takes to covert their inventories
into sales/cash (Huang, Shieh and Kao, 2016). As above chart shows that GSK's inventories
turnover ratios are 196 days and 195 days in year 2017 and 2018 respectively. Whereas during
the same period RBG's inventory turnover days are 94 and 93.86 respectively. Thus RBG's
inventories turnover ratios are more efficient as compare to GSK.
Dividend payout ratio:
Dividend Payout ratio per share of GSK is 2.55 in year 2017 and 1.08 in year 2018 while
RBG's dividend payout ratio are 0.18 and 0.55 respectively in year 2017 and 2018. This ratio
2017 2018
0
0.5
1
1.5
2
2.5
3
2.55
1.08
0.18
0.55
Glaxo Smith Kline plc
Reckitt Benckiser Group plc
⊘ This is a preview!⊘
Do you want full access?
Subscribe today to unlock all pages.
Trusted by 1+ million students worldwide
1 out of 20
Related Documents


Your All-in-One AI-Powered Toolkit for Academic Success.
+13062052269
info@desklib.com
Available 24*7 on WhatsApp / Email
![[object Object]](/_next/static/media/star-bottom.7253800d.svg)
Unlock your academic potential
Copyright © 2020–2026 A2Z Services. All Rights Reserved. Developed and managed by ZUCOL.