Financial Analysis: Harrison Plc Performance (2012-2016)
VerifiedAdded on 2020/06/06
|7
|1652
|62
Report
AI Summary
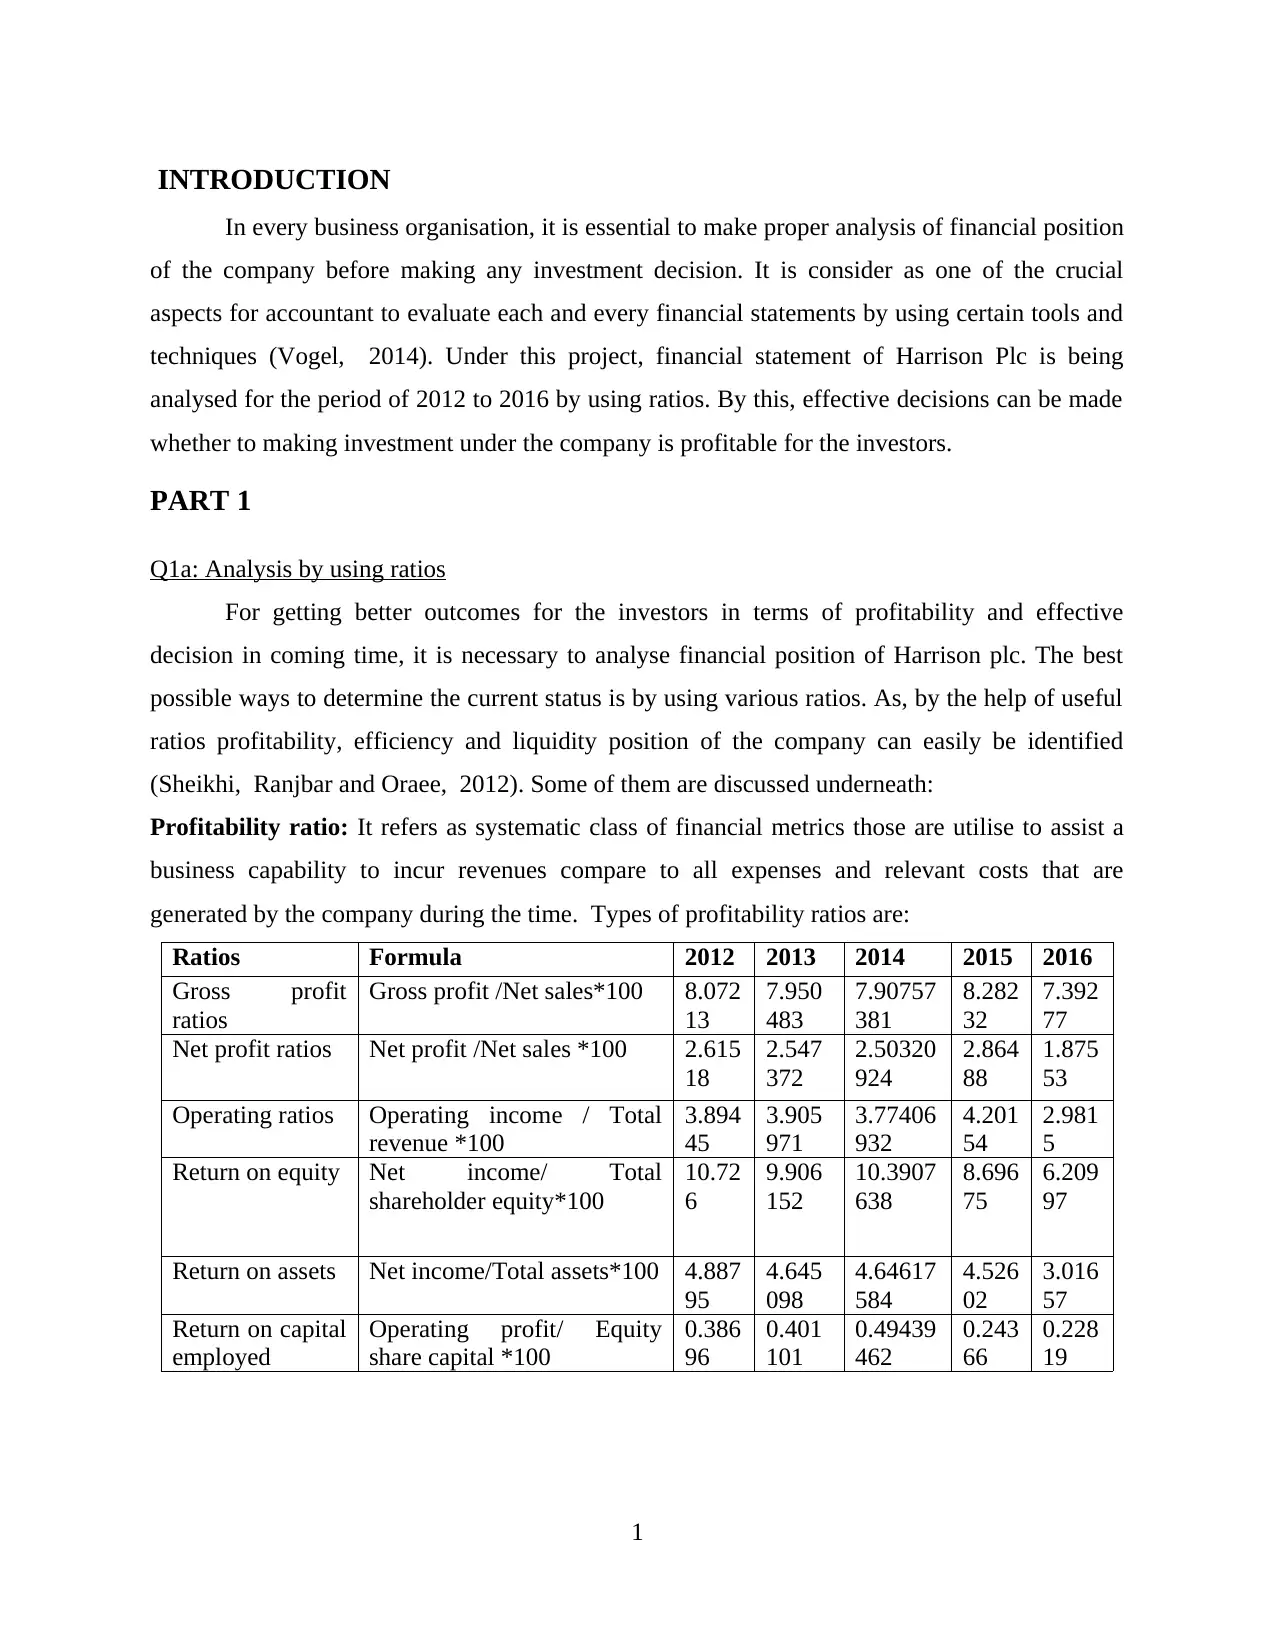
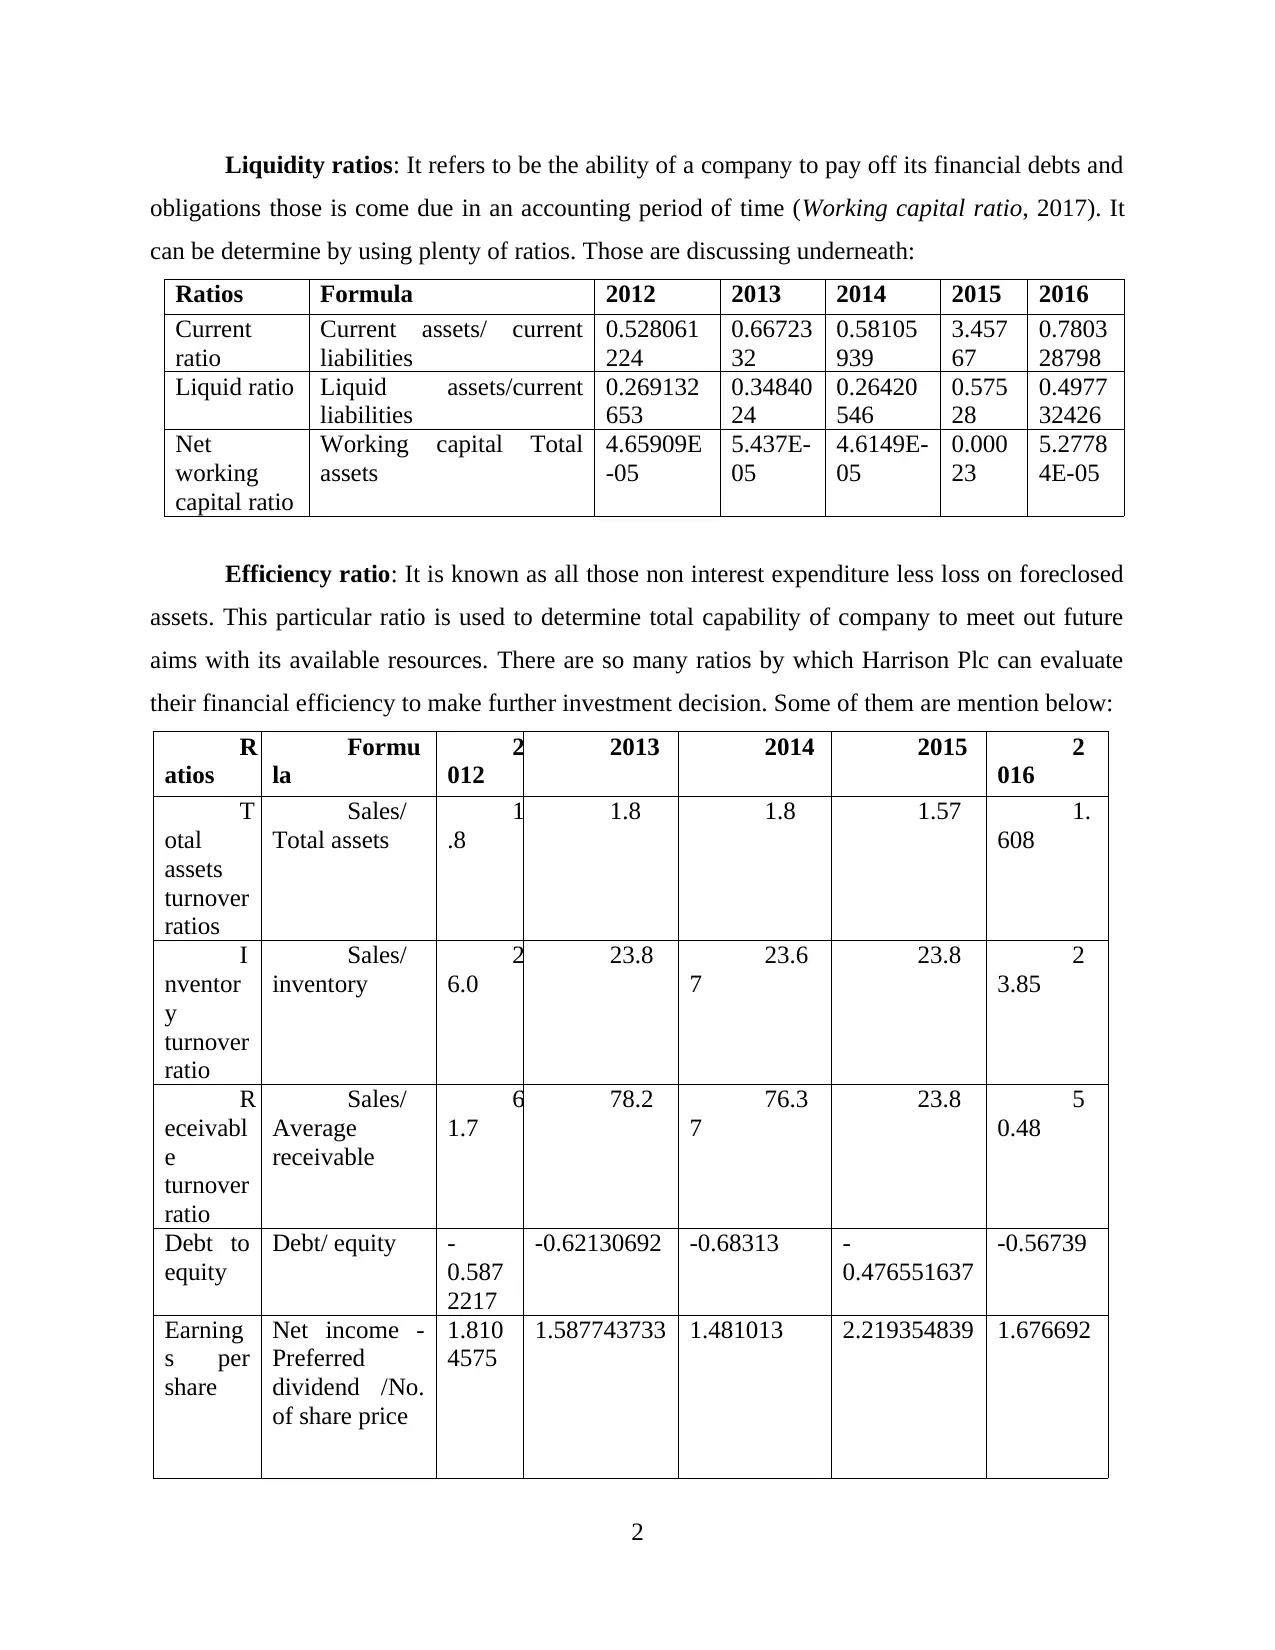
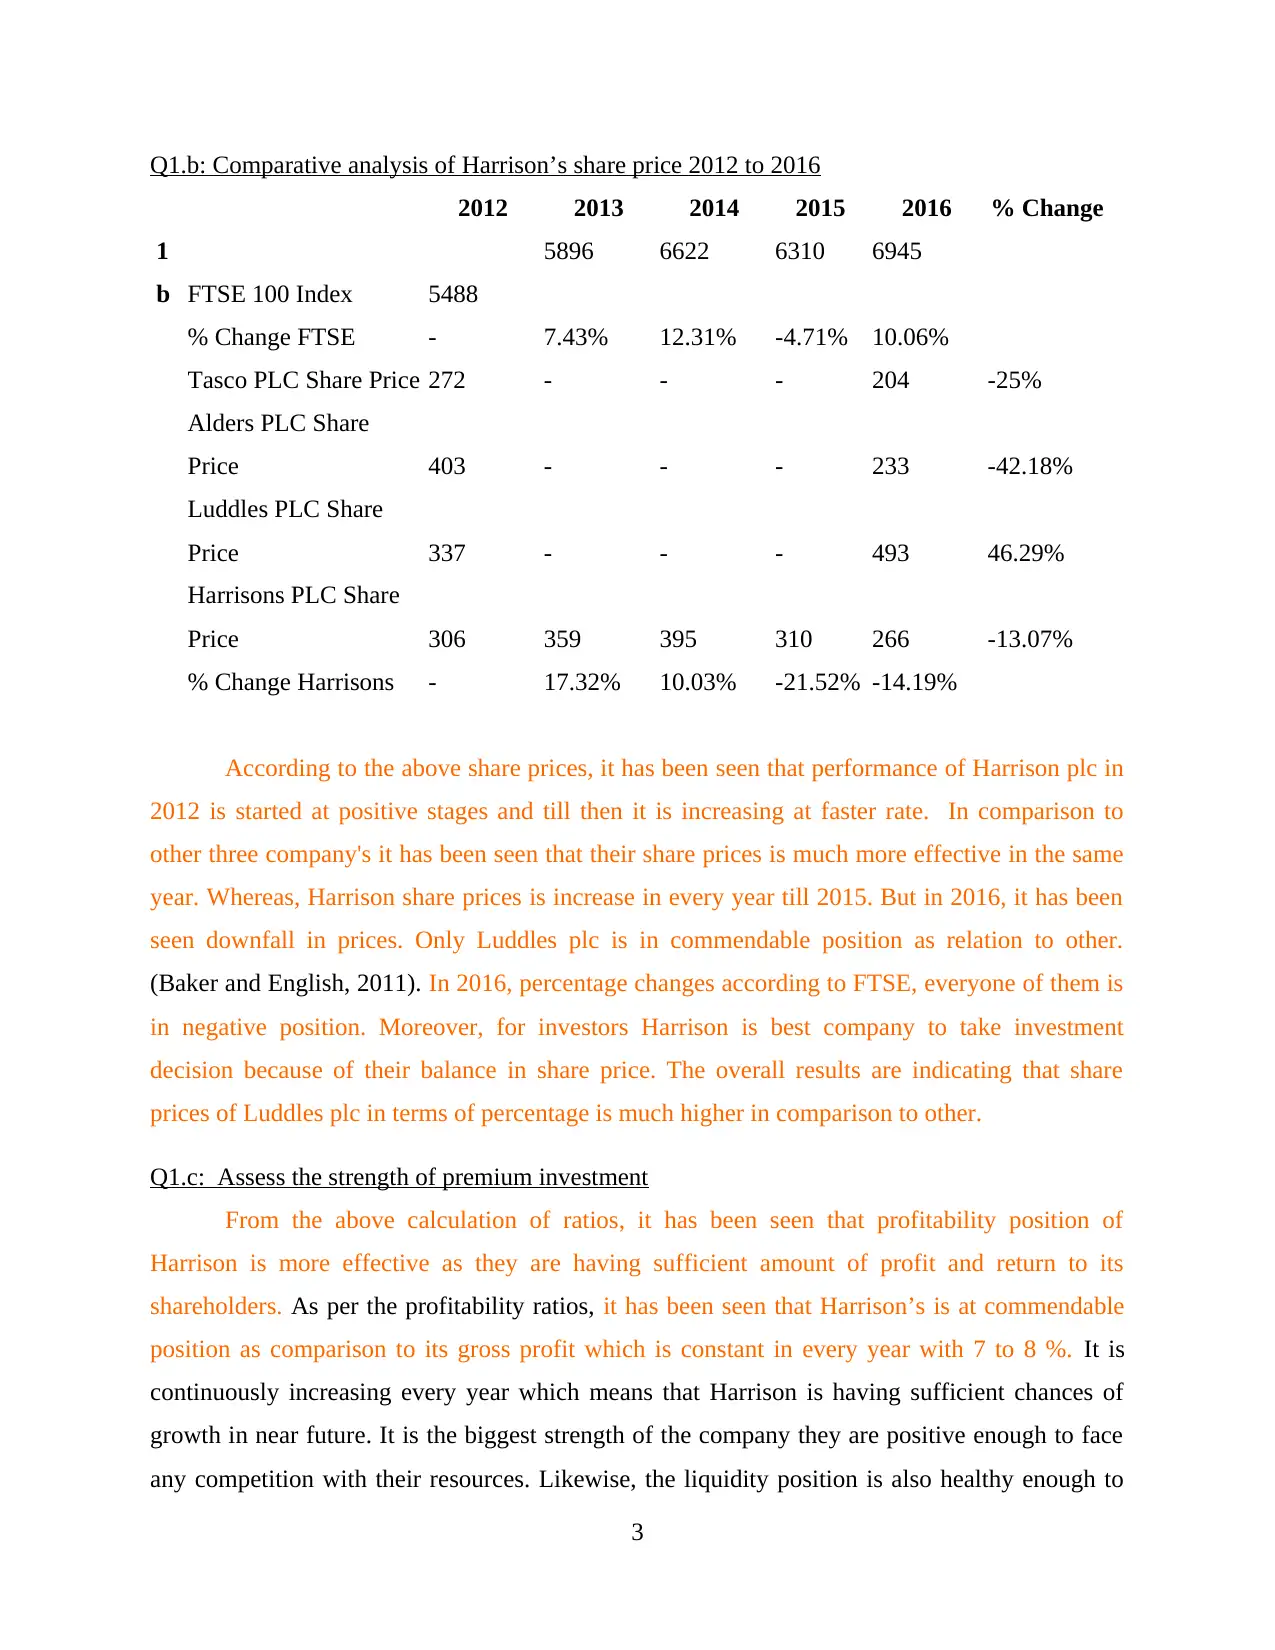
This report presents a detailed financial analysis of Harrison Plc from 2012 to 2016. It begins with an introduction emphasizing the importance of financial analysis for investment decisions and then proceeds to analyze the company's financial statements using various ratios. The analysis includes profitability ratios (gross profit, net profit, operating ratios, return on equity, return on assets, and return on capital employed), liquidity ratios (current ratio, liquid ratio, and net working capital ratio), and efficiency ratios (total assets turnover, inventory turnover, receivable turnover, and debt to equity). The report also includes a comparative analysis of Harrison's share price against competitors and the FTSE 100 index, assessing performance from 2012 to 2016. Finally, the report assesses the strength of premium investment in Harrison Plc based on the calculated ratios and share price performance, concluding that Harrison Plc presents a good investment opportunity. The report uses data, calculations, and comparisons to support its findings and conclusions, citing relevant sources. This analysis is crucial for making informed investment decisions.

1 out of 7
Related Documents


Your All-in-One AI-Powered Toolkit for Academic Success.
+13062052269
info@desklib.com
Available 24*7 on WhatsApp / Email
![[object Object]](/_next/static/media/star-bottom.7253800d.svg)
Copyright © 2020–2026 A2Z Services. All Rights Reserved. Developed and managed by ZUCOL.