Financial Analysis Report: Farsons and Heiniken's Performance
VerifiedAdded on 2023/01/18
|34
|7331
|63
Report
AI Summary
This report presents a comprehensive financial analysis of Farsons and Heiniken, two companies in the beer and beverage industry. The analysis employs various methods, including vertical and horizontal analysis of income statements and balance sheets to assess their financial performance and position. Ratio analysis is utilized to evaluate profitability, liquidity, and solvency. The report also includes an evaluation of working capital and cash flow positions. The study compares the financial health of both companies, highlighting trends in gross profit, net profit, and key financial ratios over a period of time. Overall, the report provides a detailed assessment of the financial strengths and weaknesses of Farsons and Heiniken, offering insights into their operational efficiency and financial stability.
Financial Analysis
Management Enterprise
Management Enterprise
Paraphrase This Document
Need a fresh take? Get an instant paraphrase of this document with our AI Paraphraser
Table of Contents
INTRODUCTION...........................................................................................................................3
TASK...............................................................................................................................................3
Evaluation of the financial performance and financial position of Farsons and Heiniken:.. .4
Evaluation of the Working Capital:........................................................................................9
Evaluation of the Cash Flow:...............................................................................................10
CONCLUSION..............................................................................................................................11
REFERENCES..............................................................................................................................12
APPENDIX....................................................................................................................................13
.......................................................................................................................................................24
INTRODUCTION
Financial analysis implies to review of fiscal data in order to achieve efficient decision
making in business. Generally, this analysis requires a review of both historical as well as
forecasted profit margins, cash-flows and fiscal risks. This may lead to resource allocation into
or out of a particular company or internal process. Financial analysis also relates to company
assessment in order to assess its performance, obligations, assets and possible future income
(Blum and Dacorogna, 2014). A wide range of practices can be used to determine the financial
feasibility of a corporation including horizontal & vertical analysis and ratio analysis methods.
This study involves comprehensive analysis of financial statements along with ratio
analysis of companies selected: Heiniken and Farsons. Both these corporation are engaged in
production of beer and beverages. Further study also covers the detailed evaluation of cash-flows
position and working capital condition to provide conclusion on different aspects.
TASK
Overview of Companies:
Heiniken:
Heineken is a Dutch brewing corporation located in Amsterdam. Company is world's
second-largest beer maker. Comapny has a global range of more than 170 beer products,
including Heineken, Tiger Beer, Zagorka, Dos Equis, Amstel and Strongbow. Company is
famous for it's premium quality beer and soft-drinks, and now an established brand in industry.
Company is currently operating in around more than 70 countries. It is also selling cider brands
and other innovative product range in beverages. Sustainability is ingrained in business by
"Brewing a Better World" and provides value to all its stakeholders (About Heiniken. 2019).
Farsons:
Simonds Farsons Cisk plc which is normally called or recognised as Farsons is Malta
based company well known for providing quality beer, food and other beverages. Company sis
engaged in brewing, producing, selling of different beers brands and soft drinks. Company also
importing, wholesaling and retailing foods and beverages, and operating franchised retail. In
Malta and other near countries company is leading beer manufacturer and also company is
rapidly moving towards international market. Blue-Label Beer, Kinnie line of soft-drinks, Cisk
Lager, San Michel table water, Hopleaf Pale Ale etc. are the corporation's popular breweries and
⊘ This is a preview!⊘
Do you want full access?
Subscribe today to unlock all pages.
Trusted by 1+ million students worldwide
liquor labels. Company is the very first non-bank private corporation listed on the Malta's Stock
Exchange, wherein the shares of the organization are known for trade purposes as SFC (About
Farsons, 2019).
Evaluation of the financial performance and financial position of Farsons and Heiniken:
Vertical analysis: Vertical analysis refers to form of examination of financial information where
each material item is described in report as a proportion of base figures. So, line items stated in
statement of income could be specified as a certain percentage of gross revenues, whereas line
items stated in balance sheet could be specified as a certain percentage of aggregate value of
assets or liabilities. In specific columns, financial statements which include vertical analysis
specifically display line items a percentages (Bragg, 2012).
Heiniken:
Income Statement:
From vertical analysis of Profit and Loss or Income Statement of company Heiniken it
has been evaluated that corporation's aggregate gross profits as in percentage of total revenue
has been decreased during 2018 to 51.29% after reporting a sustaining improvement form year
2015 to year 2017. During 2015 to 2017 gross profit proportion was 52.57%, 53.39% and
53.77% respectively. Whereas net profits in proportion of total revenue was 4.67% in year 2015
has been decreased to 3.75% in year 2016 which was increased to 4.46% and 4.28% in year 2017
and year 2018. Above trends shows that after 2017 company's profitability level in proportion of
its sales has been declined (Annual Report of Heiniken. 2019).
Statement of financial position:
Vertical Balance sheet's analysis of corporation exhibits that entire non-current assets has
covered 78.38%, 79.90%, 79.31% and 84.32% part of company's total stated assets during 2018,
2017, 2016 and 2015 respectively, which points out towards decreasing trend during such period.
Whereas cash/cash-equivalents' proportion has been increased during year2018 i.e. 6.92% in that
year while it was 2.23% during year2015, 7.72% (in 2016) and 5.95% (in 2017). Corporation's
total current assets occupied 15.68%, 20.69%, 20.10% and 21.62%, 20.10%, 20.69% and
15.68% in year 2018, 2017, 2016 and 2015 respectively.
In company shareholder equity covered 17.06% portion of entire assets in 2018 which
was 16.16%, 16.78% and 17.90% in year 2017, 2016 and 2015 respectively. Current liabilities'
Paraphrase This Document
Need a fresh take? Get an instant paraphrase of this document with our AI Paraphraser
level has been declined from 26.44% to 24.91% during period of year2016 to 2018. Moreover,
non-current liabilities' level has been declined from 59.52% to 58.03% from year2015 to 2018.
Farsons:
Income Statement:
Vertical income statement as attached in appendix of Farsons shows that corporation's
gross profits percentage relative to total revenues was 37.97% in 2015 which increased in 2016
and reached at 38.82%. Also further it was 38.95% and 38.64% during 2018 and 2017
respectively. Whereas net income occupied 14.74% of aggregate revenues in 2018 which was
10.13%, 12.94% and 13.64%, 12.94% and 10.13% in year 2017, 2016 and 2015 respectively.
Above increasing trend in gross-profit and net-profit shows that company's profit generation
capabilities has been increased over the period (Annual Report of Farsons. 2019).
Statement of Financial Position:
Balance sheet (Vertical) analysis of corporation Farsons indicates that total equity
occupied 67.11% of aggregate value of assets in 2015 which reached at 59.88%, 67.21% and
66.87% during year 2018,2017 and 2016 respectively. On other side total liabilities were 20.37%
in 2018 and this percentage were 32.89%, 32.52% and 32.79% during year 2017, 2016 and 2015
(Annual Report of Farsons. 2019).
Corporation's non-current or fixed assets proportion has been reduced to 77.16% in
year2018 which was 78.52% in 2015, 79.14% in 2016 and 81.42% in 2017. Whereas
corporation's aggregate current asset level has been reached 18.58% to 22.22% (2017 to 2018)
that was 20.25% and 21.48% in year 2016 and 2015 respectively.
Horizontal Analysis:
Horizontal analysis simply relates to analysis of previous period's fiscal data/figures by
taking recent previous year as baseline. This is simple comparative financial statement along
with columns of variance/change in figures. Horizontal analysis clearly states the growth either
positive or negative in figures reported. It provides more clear comparative analysis of financial
figures. This analysis is significant assess exact variance in different line items reported in
financial statements (Cucchiella, D’Adamo and Gastaldi, 2015).
Heiniken:
Income Statement:
Horizontal income-statement's analysis of company Heiniken's it has been evaluated that
growth in sales in year2017 was highest of 5.27% which was around 2.66% in 2018.
Corporation's gross-profits have been reduced in 2018 by around 2.08% while in 2017 it
reflected maximal increase of 6.04%. Net profits has also been declined by 1.64% in 2018 from
2017. While 2017's profits raised by around25.42% after decrements of 18.60% in 2016. This
declining growth rate in net profits points outs that company's efficiency to provide net-profits
has been reduced over the period.
Statement of financial position:
Analyzing horizontal balance sheet of company shows that there was growth of 7.91% in
company's shareholder's equity during 2018. Such percentage has been changed to 0.53% and -
2.25% in year 2017 and 2016. Corporation's non-current liabilities or long term debts has been
raised only by around 1.69% during 2018 while previously it has been raised by around 7.24% in
2017. Corporation's current liabilities decreased by around -0.08% in 2018 in which growth of
22.09% and 0.59% has been reported in year 2016 and 2017.
Balance of Cash/cash equivalents in company was increased by around 268.33% in 2016
that was shown decrements of 19.54% in year 2017, however in 2018 this figures grown by
18.88%. Balance of current assets was increased by 9.97%, 1.36% and 37.59% during period
2018, 2017 and 2016. Whereas non-current or fixed assets are only shown a growth of 0.31% in
2018, these growth in 2017 was around 5.14%. While in 2016 fixed assets balance was dropped
by approx 1.94%.
Farsons:
Income Statement:
In 2018, the revenues of the Farsons corporation improved by 7.95%, that enhanced by
3.53% and 7.59% in 2017 and 2018. The gross margin statistics of the company expanded by
8.82% in year 2018, although increase were 3.03% and 10% respectively in 2016 and 2017. Net
earnings of the organization showed an increase of 16.67 percent in year 2018, that was 37.50
percent in year2016 and 9.09 percent in 2017.
Statement of financial Position:
According to Farsons figures reported, horizontal analysis shows that funds of company's
shareholder decreased by 21.14 percent in 2018, while there was a 9percent and 12.84percent
addition in 2016 and 2017. The cumulative non-current liabilities of the organization expanded
⊘ This is a preview!⊘
Do you want full access?
Subscribe today to unlock all pages.
Trusted by 1+ million students worldwide
by 11.67% in year 2018, by around 13.21% in year 2017 and by around 8.16% in year 2016. In
2018, the overall level of current liabilities expanded by 33.33%. Corporation's entire assets
value dropped down by around 11.48% in 2018 but has been increased by 9.40 percent and 12.27
percent respectively in year 2017 and 2016. During 2018, non-current assets were dropped by
around 16.11% that was expanded by 10.26 percent in 2016 and 15.50 percent in year2017.
While in business current assets balance has been grown by 3.13 percent, 5.88 percent and 3.03
percent respectively in year 2016, 2017 and 2018.
Ratio Analysis: Ratio analysis known as a standardized calculation-based comparison between
various key financial statistics or data reported over one or more years in the company's annual
financial statements. This is used mainly by managers and economists to analyze various areas/
components of business performance such as efficiency, liquidity, solvency and profitability (El
Kasmioui and Ceulemans, 2012).
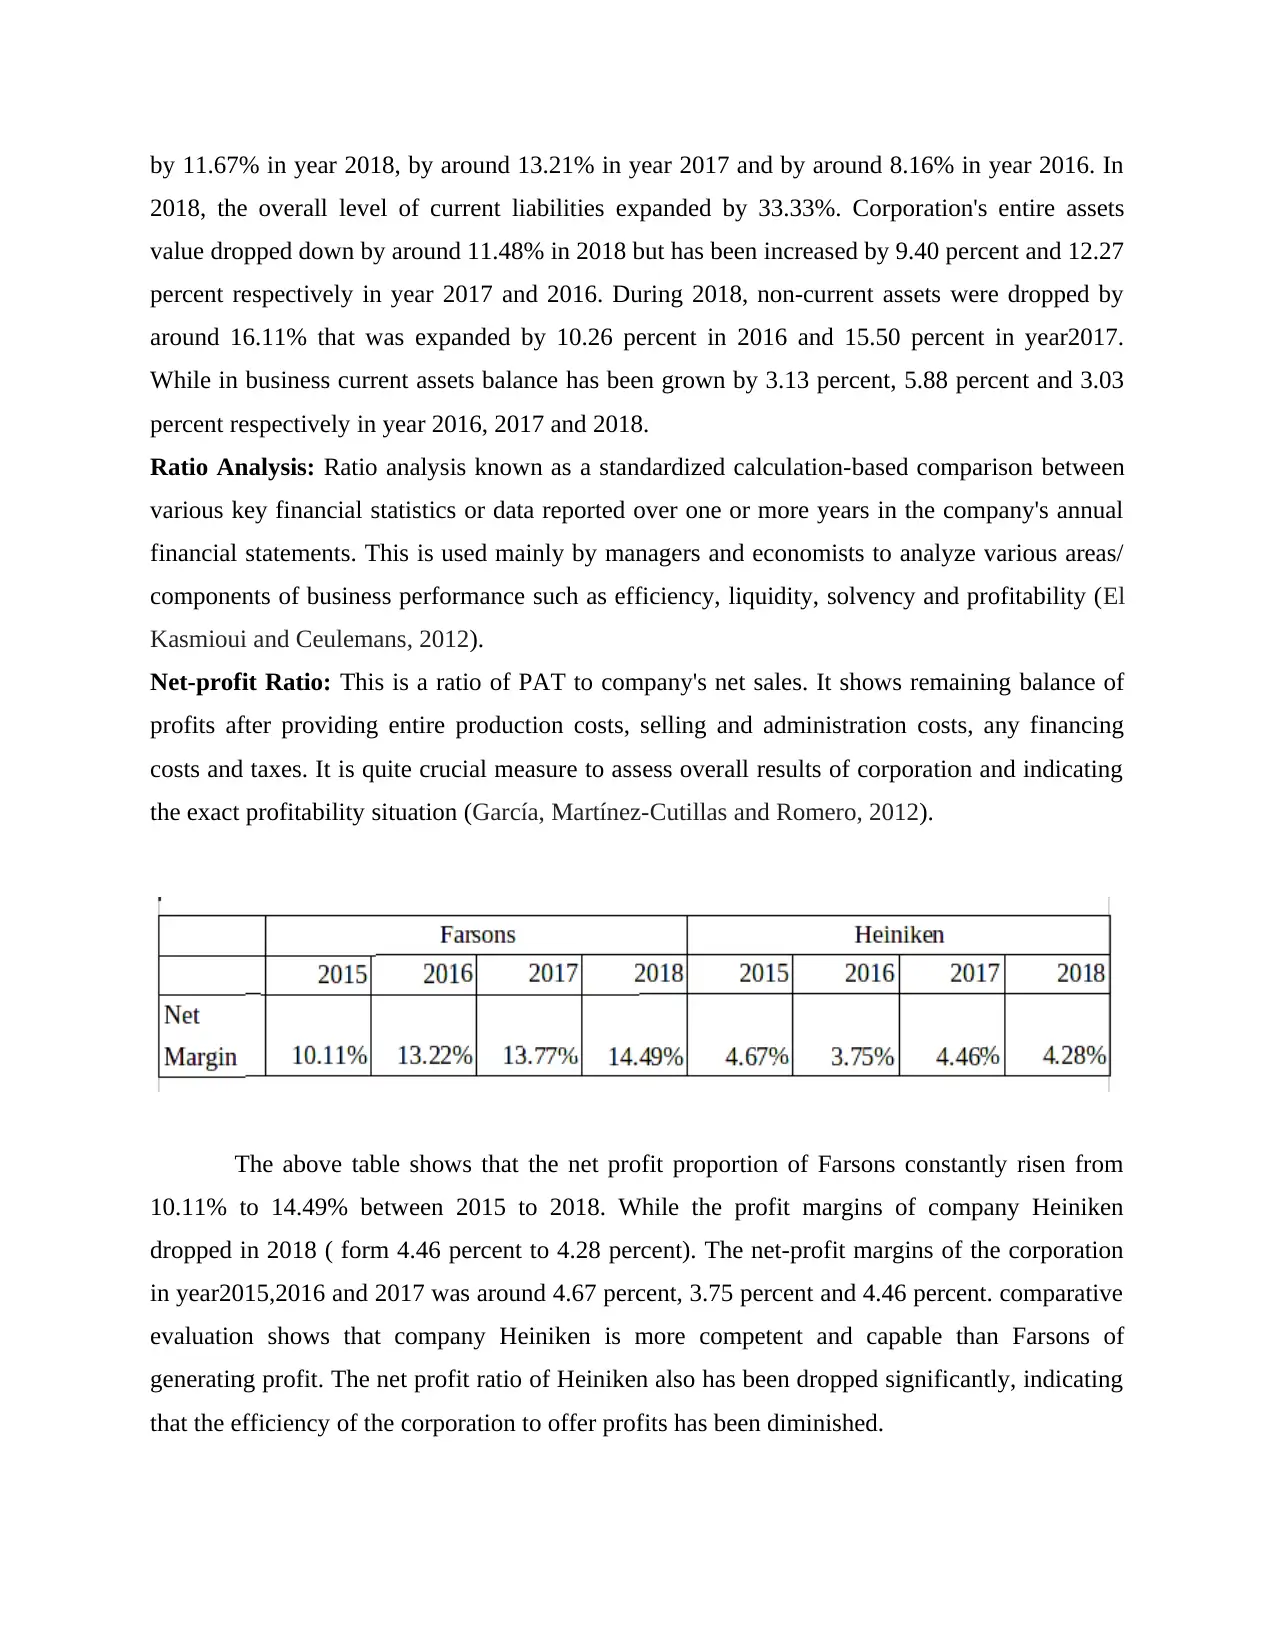
Net-profit Ratio: This is a ratio of PAT to company's net sales. It shows remaining balance of
profits after providing entire production costs, selling and administration costs, any financing
costs and taxes. It is quite crucial measure to assess overall results of corporation and indicating
the exact profitability situation (García, Martínez-Cutillas and Romero, 2012).
The above table shows that the net profit proportion of Farsons constantly risen from
10.11% to 14.49% between 2015 to 2018. While the profit margins of company Heiniken
dropped in 2018 ( form 4.46 percent to 4.28 percent). The net-profit margins of the corporation
in year2015,2016 and 2017 was around 4.67 percent, 3.75 percent and 4.46 percent. comparative
evaluation shows that company Heiniken is more competent and capable than Farsons of
generating profit. The net profit ratio of Heiniken also has been dropped significantly, indicating
that the efficiency of the corporation to offer profits has been diminished.
2018, the overall level of current liabilities expanded by 33.33%. Corporation's entire assets
value dropped down by around 11.48% in 2018 but has been increased by 9.40 percent and 12.27
percent respectively in year 2017 and 2016. During 2018, non-current assets were dropped by
around 16.11% that was expanded by 10.26 percent in 2016 and 15.50 percent in year2017.
While in business current assets balance has been grown by 3.13 percent, 5.88 percent and 3.03
percent respectively in year 2016, 2017 and 2018.
Ratio Analysis: Ratio analysis known as a standardized calculation-based comparison between
various key financial statistics or data reported over one or more years in the company's annual
financial statements. This is used mainly by managers and economists to analyze various areas/
components of business performance such as efficiency, liquidity, solvency and profitability (El
Kasmioui and Ceulemans, 2012).
Net-profit Ratio: This is a ratio of PAT to company's net sales. It shows remaining balance of
profits after providing entire production costs, selling and administration costs, any financing
costs and taxes. It is quite crucial measure to assess overall results of corporation and indicating
the exact profitability situation (García, Martínez-Cutillas and Romero, 2012).
The above table shows that the net profit proportion of Farsons constantly risen from
10.11% to 14.49% between 2015 to 2018. While the profit margins of company Heiniken
dropped in 2018 ( form 4.46 percent to 4.28 percent). The net-profit margins of the corporation
in year2015,2016 and 2017 was around 4.67 percent, 3.75 percent and 4.46 percent. comparative
evaluation shows that company Heiniken is more competent and capable than Farsons of
generating profit. The net profit ratio of Heiniken also has been dropped significantly, indicating
that the efficiency of the corporation to offer profits has been diminished.
Paraphrase This Document
Need a fresh take? Get an instant paraphrase of this document with our AI Paraphraser
Gross Profit: GP ratio shows relationship among gross margin and net total product sales. It is a
convenient tool for evaluating the company's operational efficiency. Through dividing gross
profit figures through net revenue, the ratio is determined (Isberg and Pitta, 2013). Below table
contains gross-profit margin(%) of both corporations, as shown:
Evaluation of the above presented table shows that the gross-margin of company Farsons
was enhanced to 38.95 percent in year2017 with a slight decline. While the gross profit rate of
Heiniken dropped from 53.77 percent in year 2017 to 51.29 percent in 2018, suggesting a drop in
the efficiency of the group in providing return from key business activities. Overall contrast
reveals even a fall in Heiniken's gross-profits are much more than Farson's, which pointed out
that Heiniken's key business operations are more capable of generating profits.
Current Ratio: It is applied by management and analysts to determine an organization's short-
term liquidity position by using current assets and liabilities. In simple words, it represents the
capacity of a corporation to produce sufficient cash to payout all of its liabilities once it is due. It
is used worldwide as a means of measuring a company's total short-run credit worthiness. 2:1 is
regarded as most appropriate current ratio (Palepu and Healy, 2013). Following are current ratio
of selected organizations, as follows:
The table reveals that the current ratio of Farsons has fallen from 1.72 in year 2015 to
1.12 in year 2018. On other side, during same time-span, Heiniken's current ratios are 0.69, 0.78,
0.79, and 0.87. There is a downturn in both businesses in 2018, but liquidity status of Farsons is
much more appropriate.
Return on Equity: It is an efficiency ratio which indicates how effectively company is
generating return on funds employed by shareholders and capital. In this relationship between
ratio company's net-profits and shareholder's equity is evaluated to determine company's
financial viability (Post and Byron, 2015). Here are the ratios companies during different, as
follows:
The ROE ratio of company Farsons has fallen from 10.70 percent in 2017 to 8.19 percent
in 2018. This proportion was 12.52 percent and 10.43 percent in 2015 and year 2016. The
Heiniken's ROE was down from 14.77 percent in 2017 to 13.94 percent in 2018 on other hand.
In year2015 and year2016, ROE were 14.87 percent and 11.67 percent. Collective comparison
indicates that Heiniken company with around 13.94 percent of ROE is much more efficient in
generating returns on employed business equity.
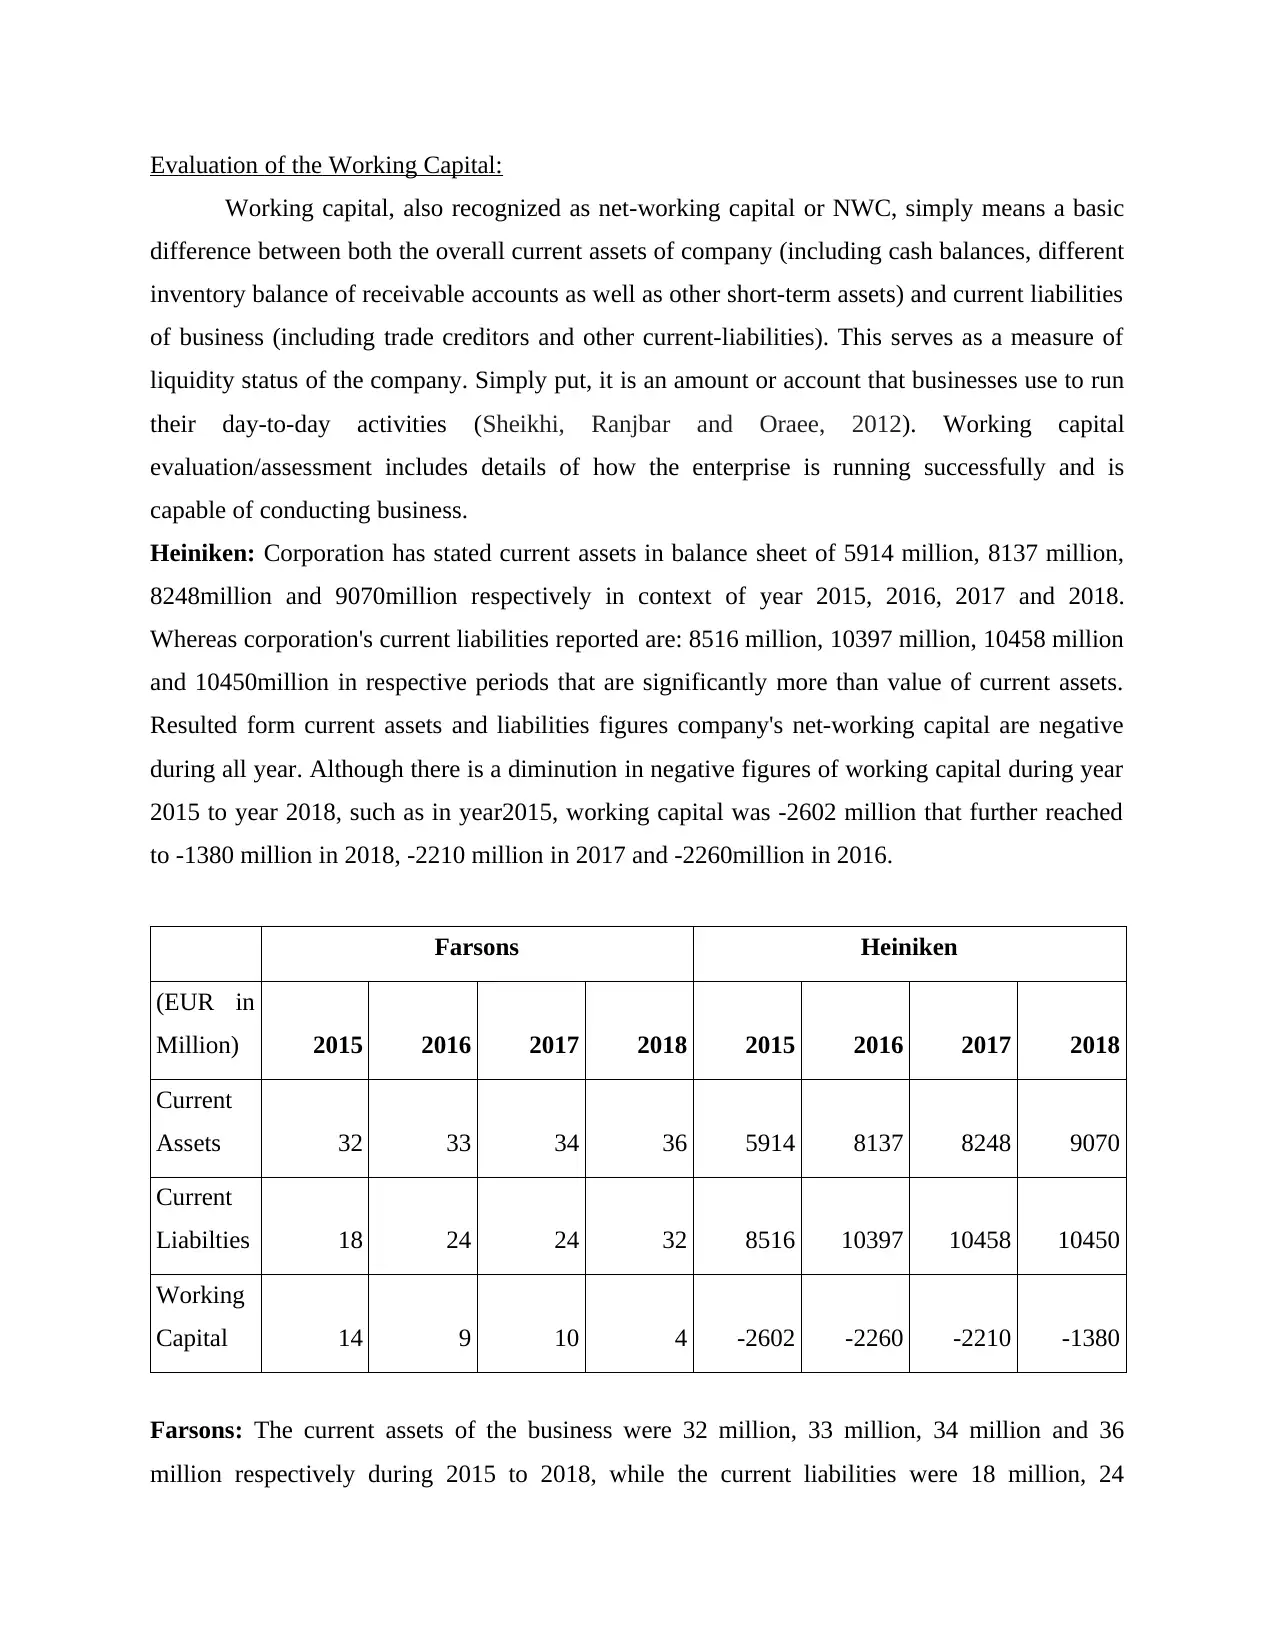
Evaluation of the Working Capital:
Working capital, also recognized as net-working capital or NWC, simply means a basic
difference between both the overall current assets of company (including cash balances, different
inventory balance of receivable accounts as well as other short-term assets) and current liabilities
of business (including trade creditors and other current-liabilities). This serves as a measure of
liquidity status of the company. Simply put, it is an amount or account that businesses use to run
their day-to-day activities (Sheikhi, Ranjbar and Oraee, 2012). Working capital
evaluation/assessment includes details of how the enterprise is running successfully and is
capable of conducting business.
Heiniken: Corporation has stated current assets in balance sheet of 5914 million, 8137 million,
8248million and 9070million respectively in context of year 2015, 2016, 2017 and 2018.
Whereas corporation's current liabilities reported are: 8516 million, 10397 million, 10458 million
and 10450million in respective periods that are significantly more than value of current assets.
Resulted form current assets and liabilities figures company's net-working capital are negative
during all year. Although there is a diminution in negative figures of working capital during year
2015 to year 2018, such as in year2015, working capital was -2602 million that further reached
to -1380 million in 2018, -2210 million in 2017 and -2260million in 2016.
Farsons Heiniken
(EUR in
Million) 2015 2016 2017 2018 2015 2016 2017 2018
Current
Assets 32 33 34 36 5914 8137 8248 9070
Current
Liabilties 18 24 24 32 8516 10397 10458 10450
Working
Capital 14 9 10 4 -2602 -2260 -2210 -1380
Farsons: The current assets of the business were 32 million, 33 million, 34 million and 36
million respectively during 2015 to 2018, while the current liabilities were 18 million, 24
⊘ This is a preview!⊘
Do you want full access?
Subscribe today to unlock all pages.
Trusted by 1+ million students worldwide
million, 24 million and 32 million over the same time-span. From such figures, company's
working capital are 14 million, 9 million, 10 million and 4 million in year 2015,2016,2017 and
2018 respectively. Business has good working capital, but the working capital of the business has
been growing.
It was founded from the analysis that Farsons is much more effective to finance its
trade/business activities and to spend in potential business operations. Although sustaining
positive WC for Heiniken is preferable as persistent negative WC indicates that the liquidity
status of the organization is not nice or might go into insolvency (Vogel, 2014).
Evaluation of the Cash Flow:
The assertion of cash flow demonstrates how well company spends money (cash
outflows) and through where a company receives the money (cash outflows). Cash-flow
statement combines all cash in flows achieved by the firm through its continued trading activities
and external sources of investment, and that all cash expenditures paid across a prescribed time-
frame for the activities of the company (Williams and Dobelman, 2017). The following is the
analysis of cash-flows as annexed to the appendix:
Heiniken: Corporation Heiniken has reported 3489million, 3718million, 3882million and
4388million of cash flows obtained through operating activities respectively, during year 2015,
2016, 2017 and 2018. Company's net out-flows though investment operations are 2064million,
2007million, 2965million and 2355million respectively in same periods. Whereas net outflows
though different financing activities during year2015,2016,2017 and 2018 are 1173million,
672million, 966million and 967million respectively. Through combining all cash flows form
these activities, company's net cash-flows are 2333million, 2049 million, 1852 million and 1759
million respectively during period 2018 to 2015. During entire period company has reported
positive net-cash flow which reflects that corporation is financially stable and sound, also able to
meet all its obligations and liabilities.
Farsons: In 2015, 2016, 2017 and 2018, the corporation reported net-cash flows through its
different operating activities of 16 million, 16 million, 13 million and 21 million respectively,
indicating that the company operates efficiently. While net-cash outflows of the corporation via
investment operations in year2015, 2016, 2017 and 2018 are 7million, 18million, 20million and
21million respectively. Net-Cash inflows/outflows are -4million, -2million, 4million and -
Paraphrase This Document
Need a fresh take? Get an instant paraphrase of this document with our AI Paraphraser
1million respectively in year2015,2016, 2017 and 2018 from all its financing activities. The free
net-cash flows of organization were receptively 9 million, -1 million, -6 million and 7 million
over same period. This indicates that after year 2016, the organization strengthened its cash-flow
and was able to finance its main operations.
Form above presented evaluation of cash-flows of companies it has been founded that
Heiniken company is much more effective in maintaining cash-flows since during 4 years cash-
flows of corporation are positive while Farsons's net cash-flows comprises negative figures in
year 2017 and 2016.
Overall analysis:
It was stated from above various evaluations that company Heininken is more effective in
producing capital returns but also has a gross margin higher than Farsons' ratio. However with a
favorable and positive cash flow, the organization still struggled with unfavorable working
capital. Whereas Farsons has more favorable net-profit margin with positive net-working capital.
Corporation's current ratios throughout all year are also more acceptable as compared to
Heininken. Company Farsons is trading at small scale as in comparison with Heininken, but
financially looks more efficient.
CONCLUSION
From the study mentioned above, it was evaluated that term Financial Analysis is a
broader and critical concept as its aid in evaluating a company's financial robustness and true
financial efficiency. Which also concerns financial statements assessment, cash flows and review
of ratios. All these provides concise view of the business's multiple financial factors.
REFERENCES
Books and Journals:
Blum, P. and Dacorogna, M., 2014. DFA‐Dynamic Financial Analysis. Wiley StatsRef: Statistics
Reference Online.
Bragg, S.M., 2012. Financial Analysis.: A Controller's Guide. John Wiley & Sons.
Cucchiella, F., D’Adamo, I. and Gastaldi, M., 2015. Financial analysis for investment and policy
decisions in the renewable energy sector. Clean Technologies and Environmental
Policy, 17(4), pp.887-904.
El Kasmioui, O. and Ceulemans, R., 2012. Financial analysis of the cultivation of poplar and
willow for bioenergy. Biomass and bioenergy, 43, pp.52-64.
García, J.G., Martínez-Cutillas, A. and Romero, P., 2012. Financial analysis of wine grape
production using regulated deficit irrigation and partial-root zone drying
strategies. Irrigation Science, 30(3), pp.179-188.
Isberg, S. and Pitta, D., 2013. Using financial analysis to assess brand equity. Journal of Product
& Brand Management, 22(1), pp.65-78.
Palepu, K.G. and Healy, P.M., 2013. Business analysis and valuation: Using financial
statements, text and cases.
Post, C. and Byron, K., 2015. Women on boards and firm financial performance: A meta-
analysis. Academy of Management Journal, 58(5), pp.1546-1571.
Sheikhi, A., Ranjbar, A.M. and Oraee, H., 2012. Financial analysis and optimal size and
operation for a multicarrier energy system. Energy and buildings, 48, pp.71-78.
Vogel, H.L., 2014. Entertainment industry economics: A guide for financial analysis. Cambridge
University Press.
Williams, E.E. and Dobelman, J.A., 2017. Financial statement analysis. World Scientific Book
Chapters, pp.109-169.
Online:
About Farsons, 2019. [Online]. Available through: <https://www.farsons.com/en/who-we-are>
About Heiniken, 2019. [Online]. Available through:
<https://www.theheinekencompany.com/About-Us>
Annual Report of Farsons, 2019. [Online]. Available through:
<https://www.farsons.com/en/financial-statements-archive>
Annual Report of Heiniken, 2019. [Online]. Available through:
<https://www.theheinekencompany.com/Investors/Reports-and-Presentations?
Skip=0&Take=10&SubjectFilters=A5E16FC3A19A420681BE3A925F4DADCF>
⊘ This is a preview!⊘
Do you want full access?
Subscribe today to unlock all pages.
Trusted by 1+ million students worldwide
1 out of 34
Related Documents


Your All-in-One AI-Powered Toolkit for Academic Success.
+13062052269
info@desklib.com
Available 24*7 on WhatsApp / Email
![[object Object]](/_next/static/media/star-bottom.7253800d.svg)
Unlock your academic potential
Copyright © 2020–2026 A2Z Services. All Rights Reserved. Developed and managed by ZUCOL.