Detailed Financial Analysis Report: Heiniken and Farsons Comparison

Verified

Added on  2023/01/18

|24
|3963
|33
Report
AI Summary
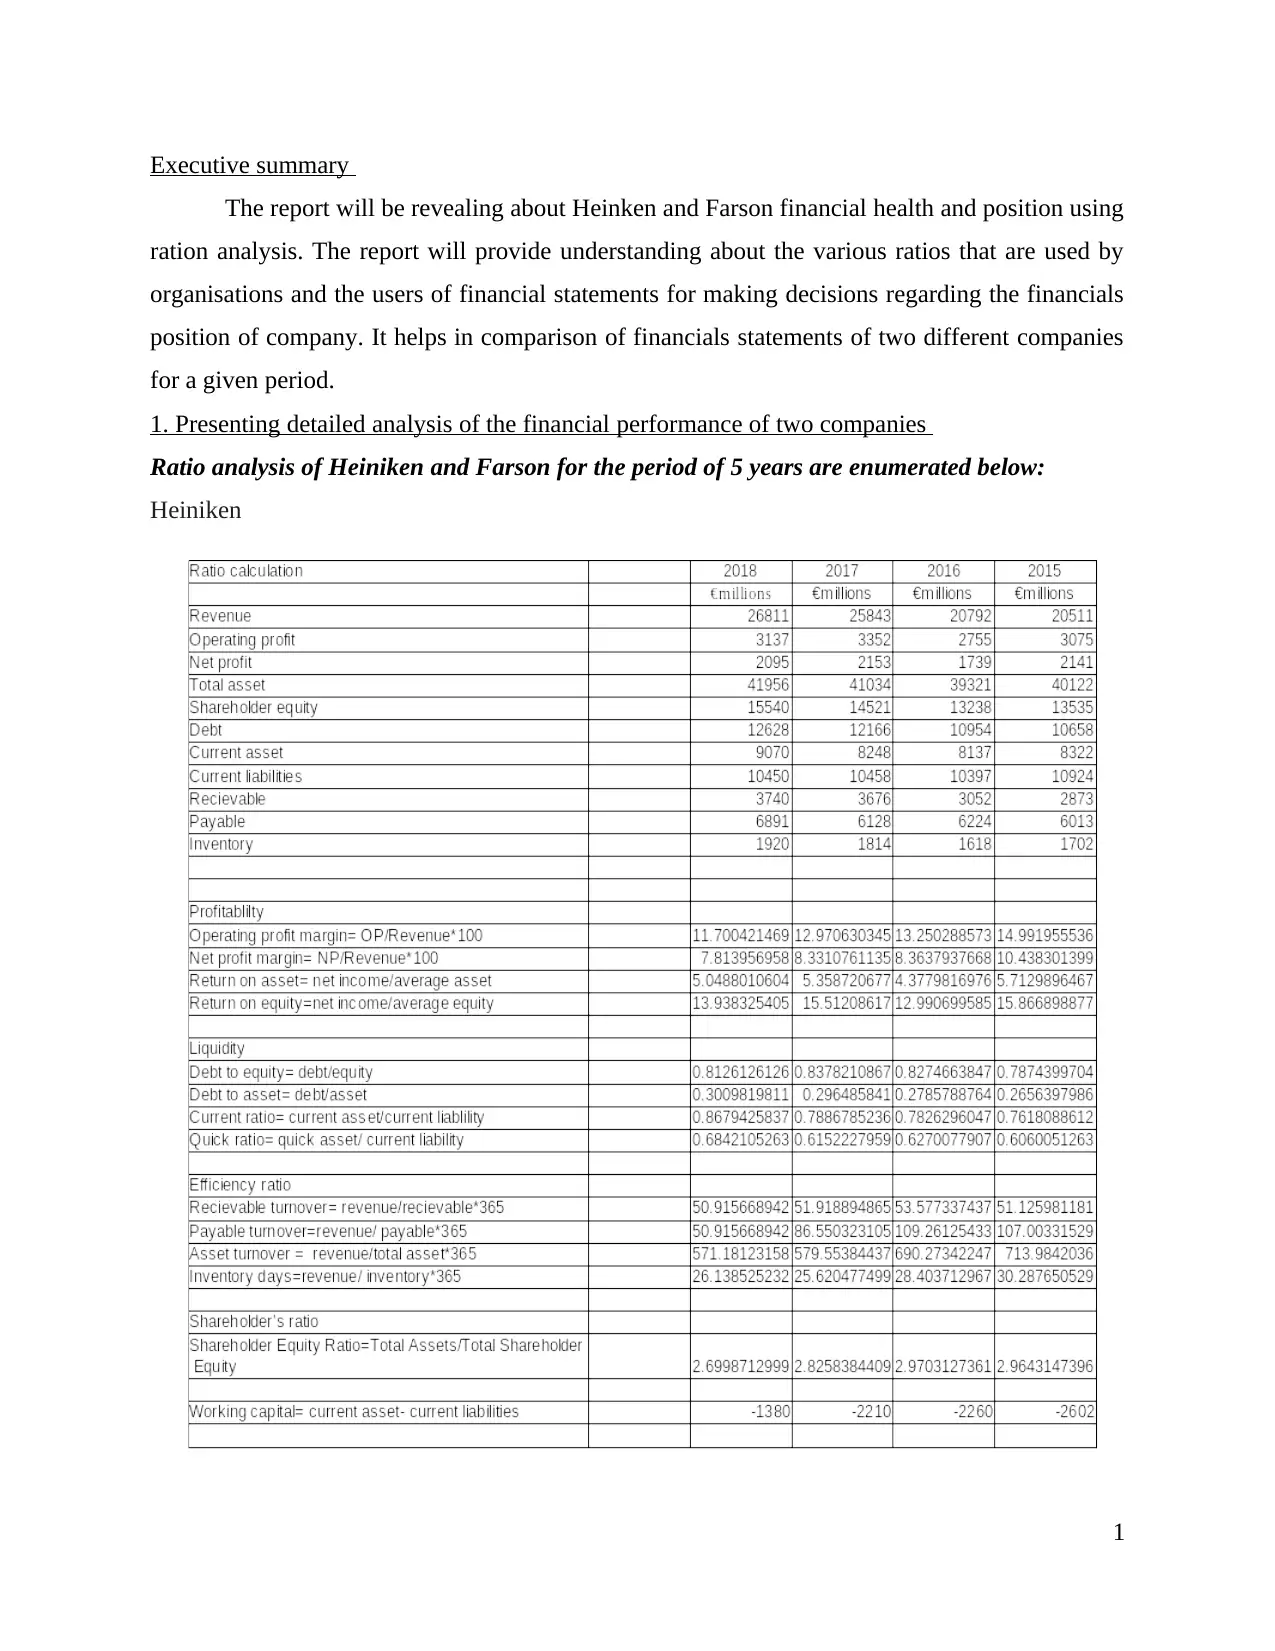
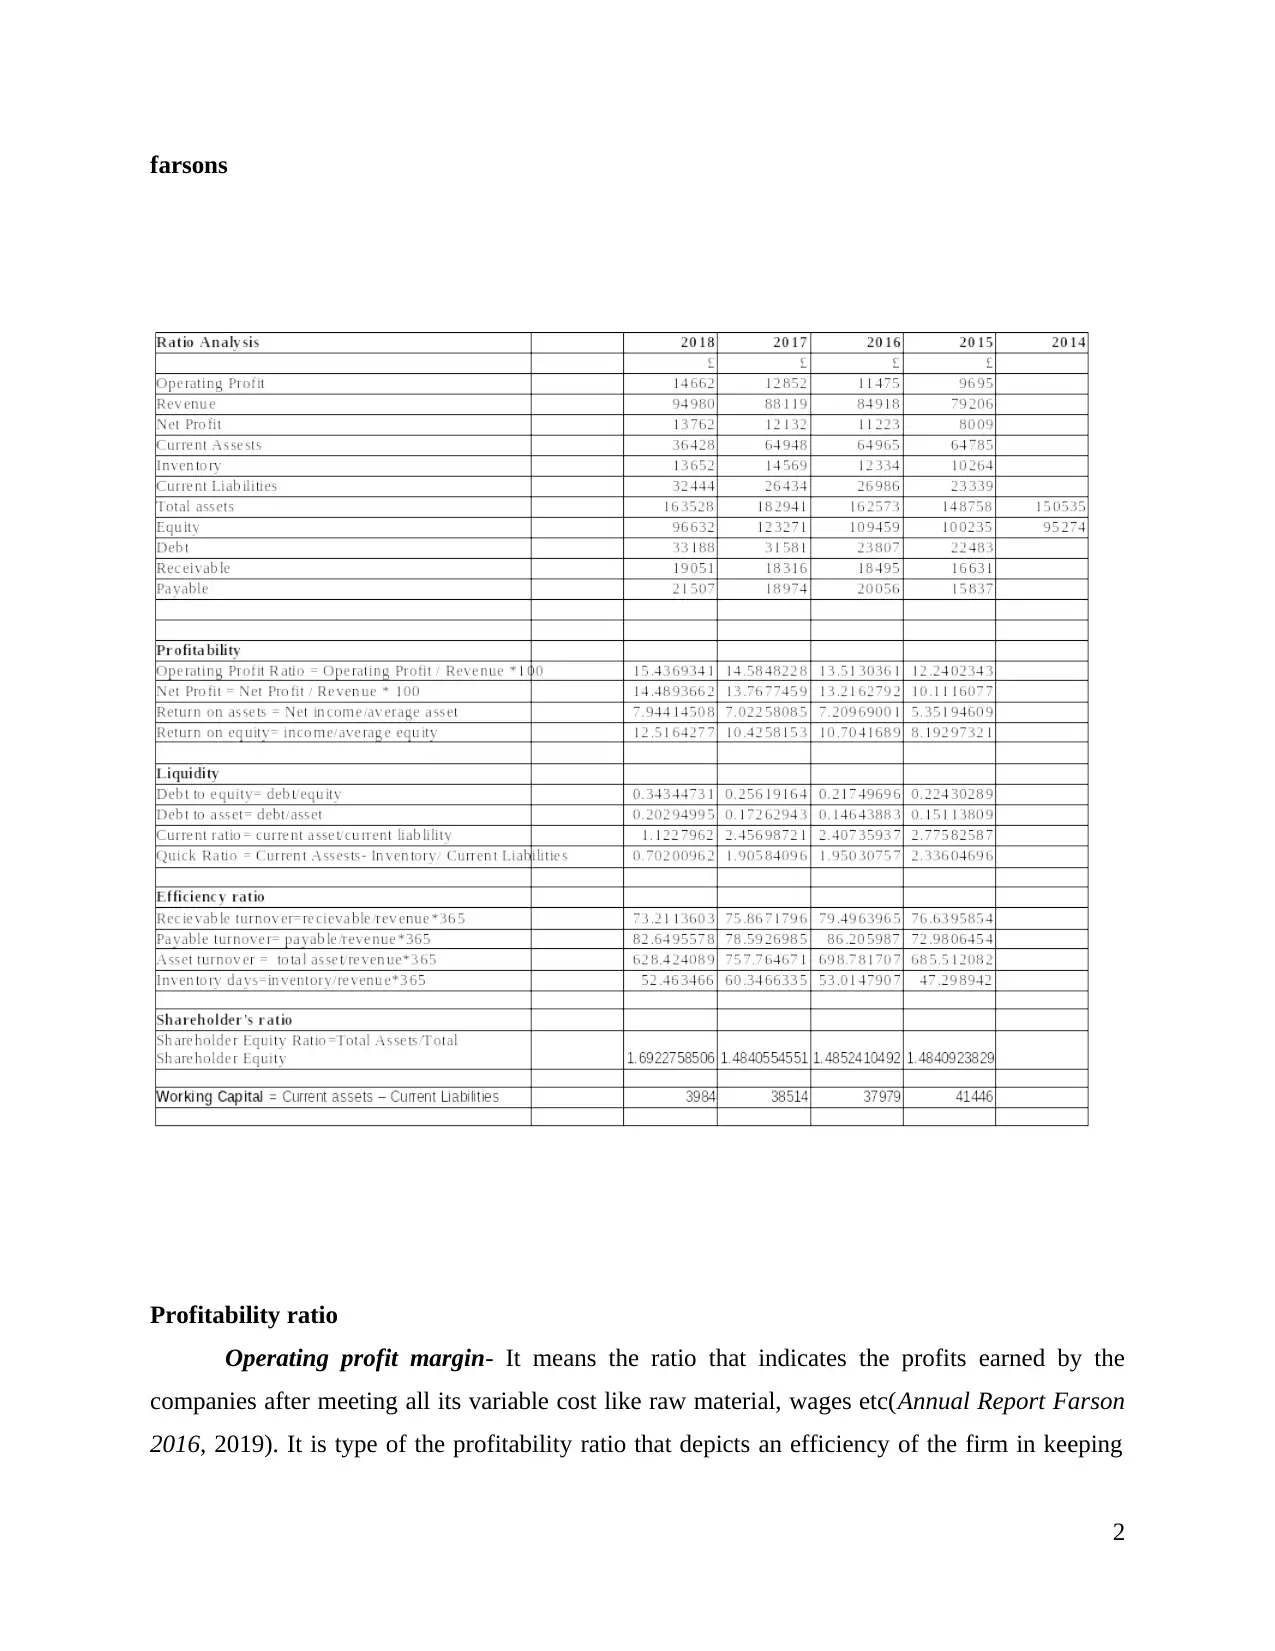
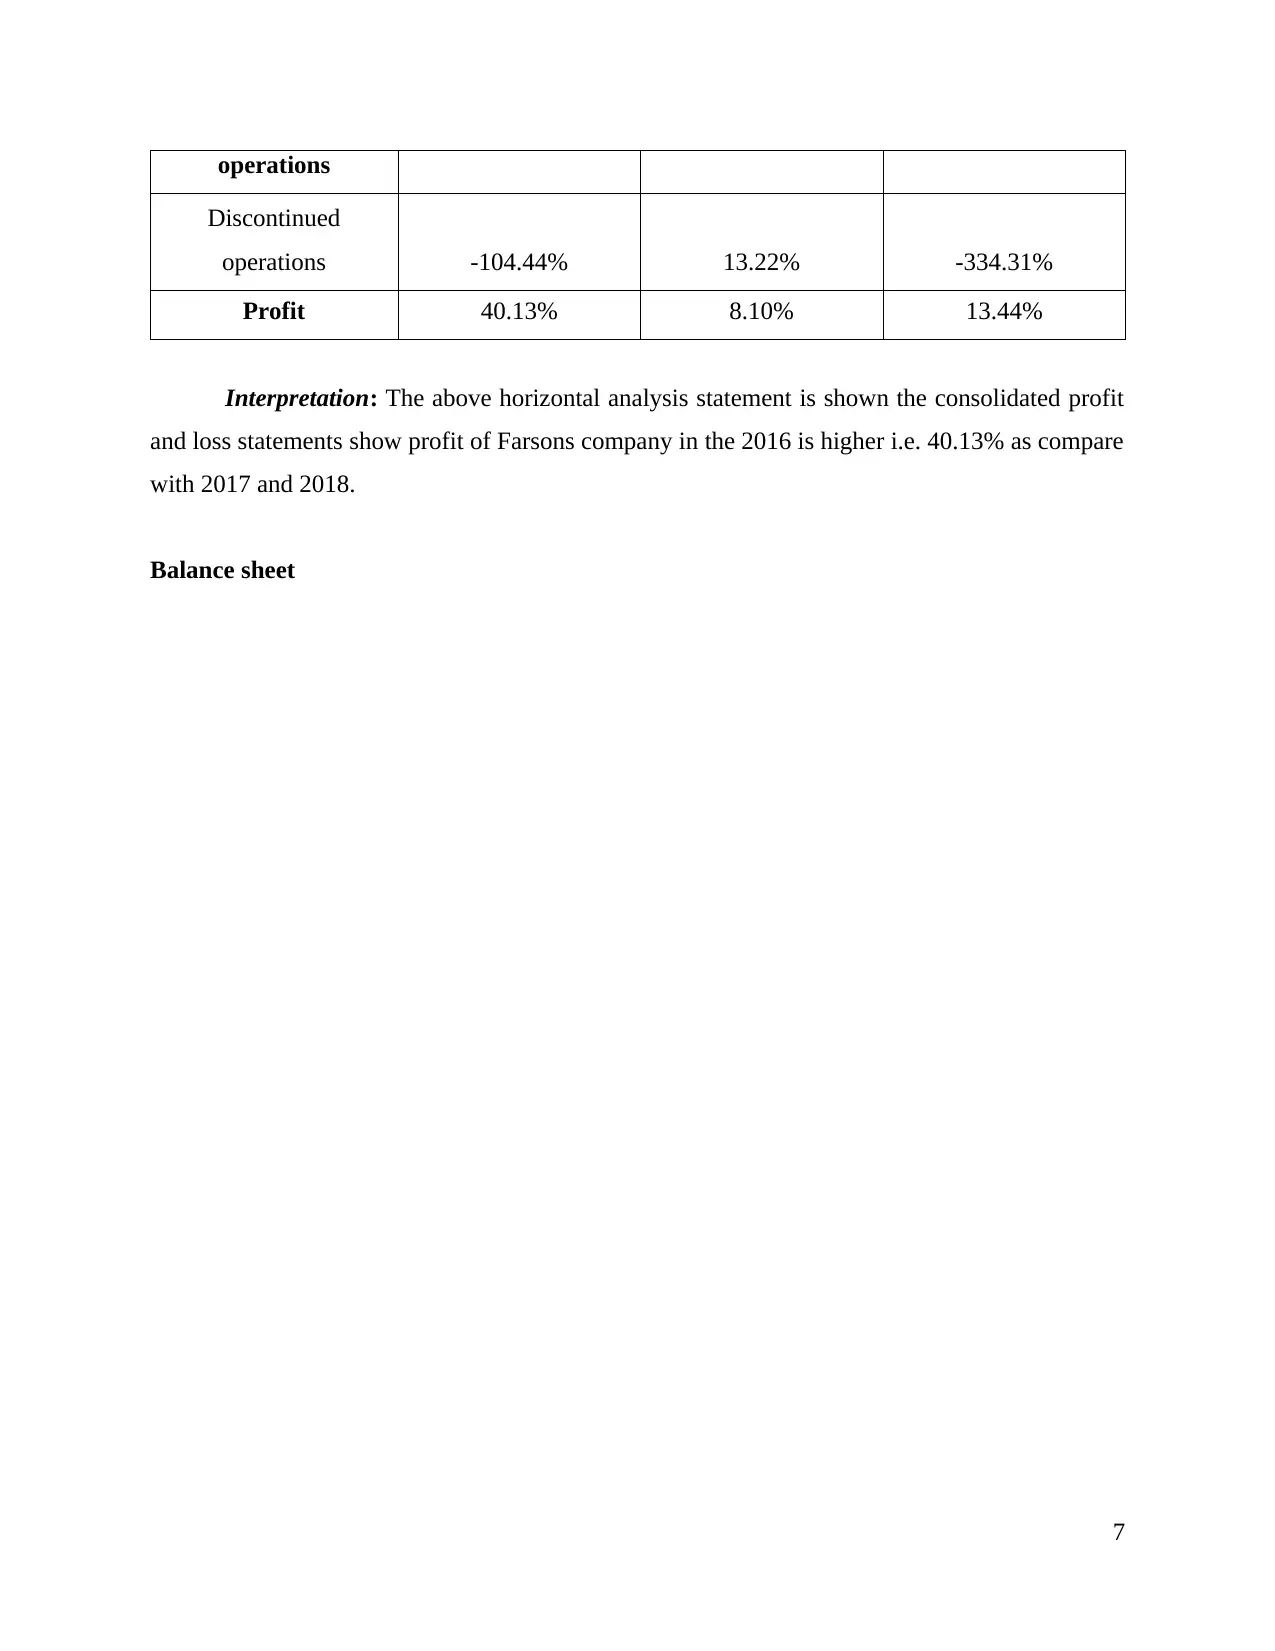
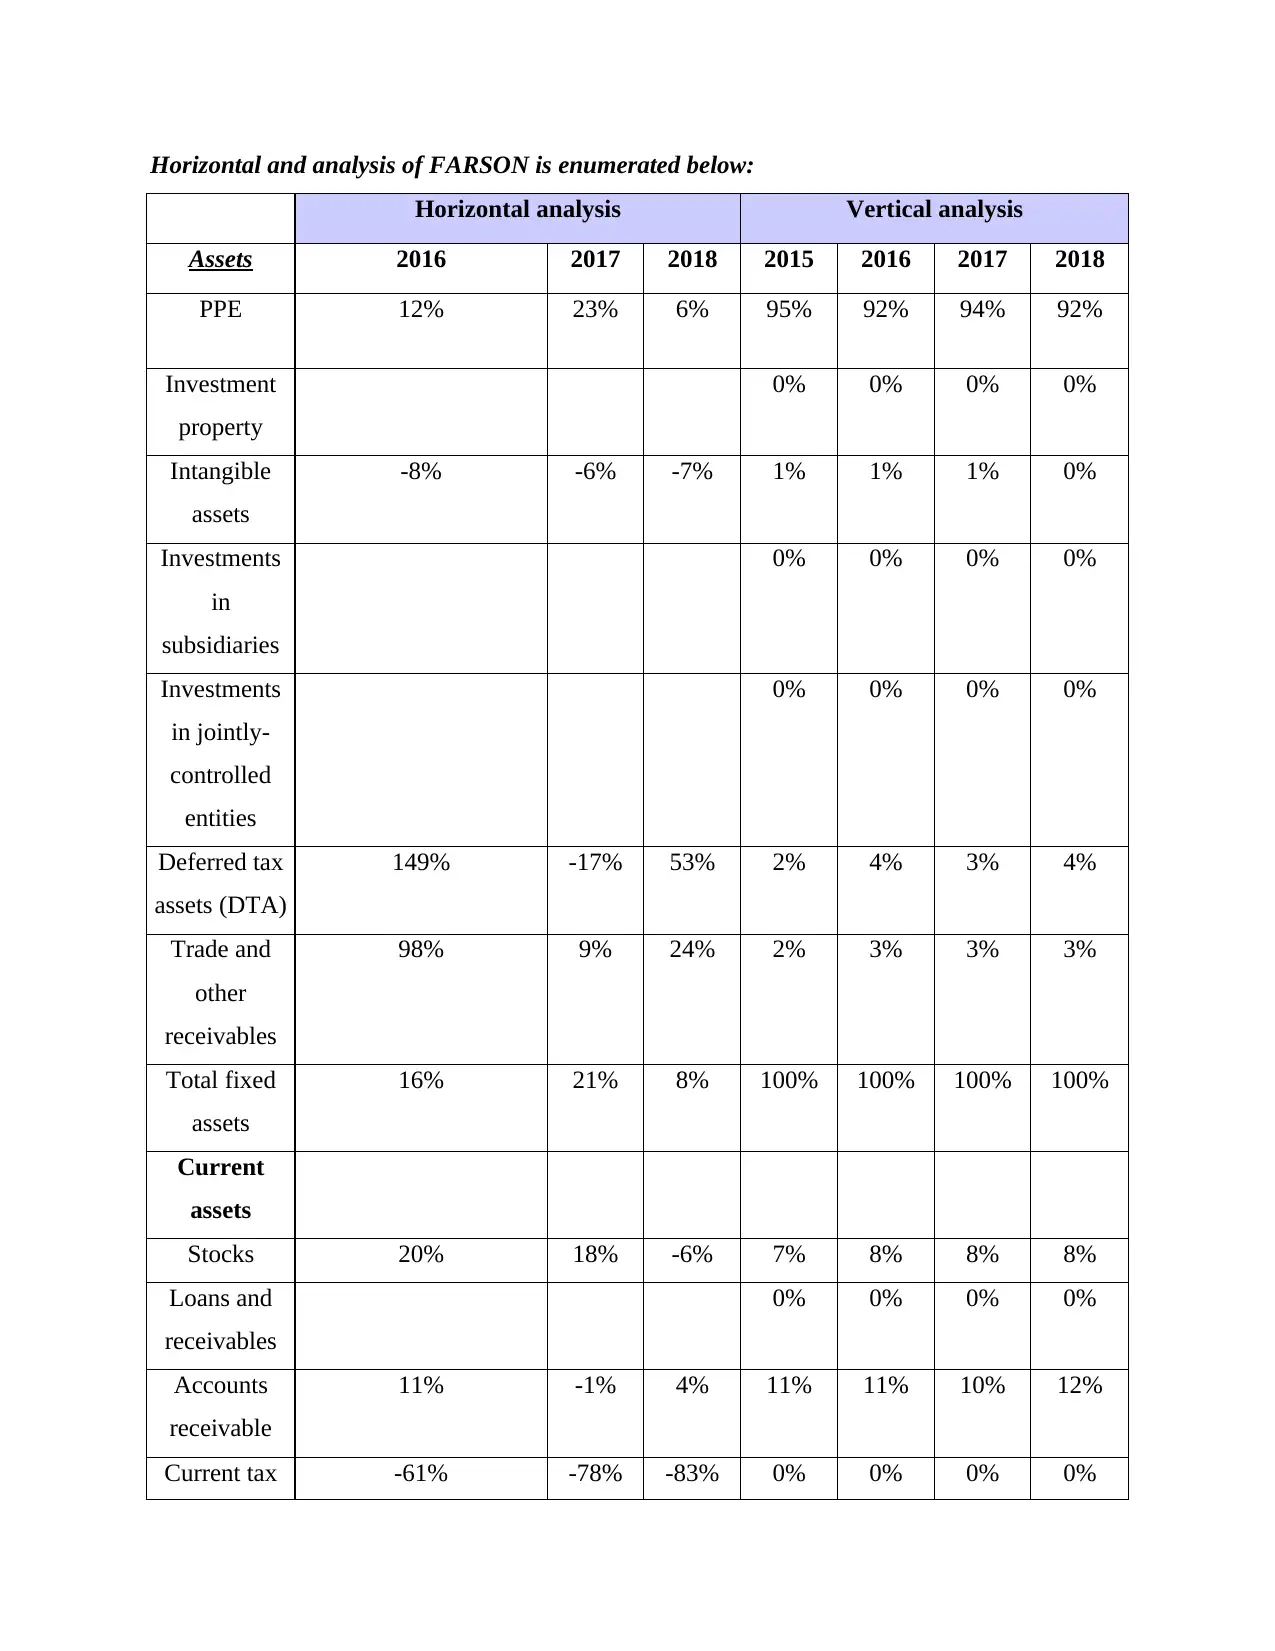
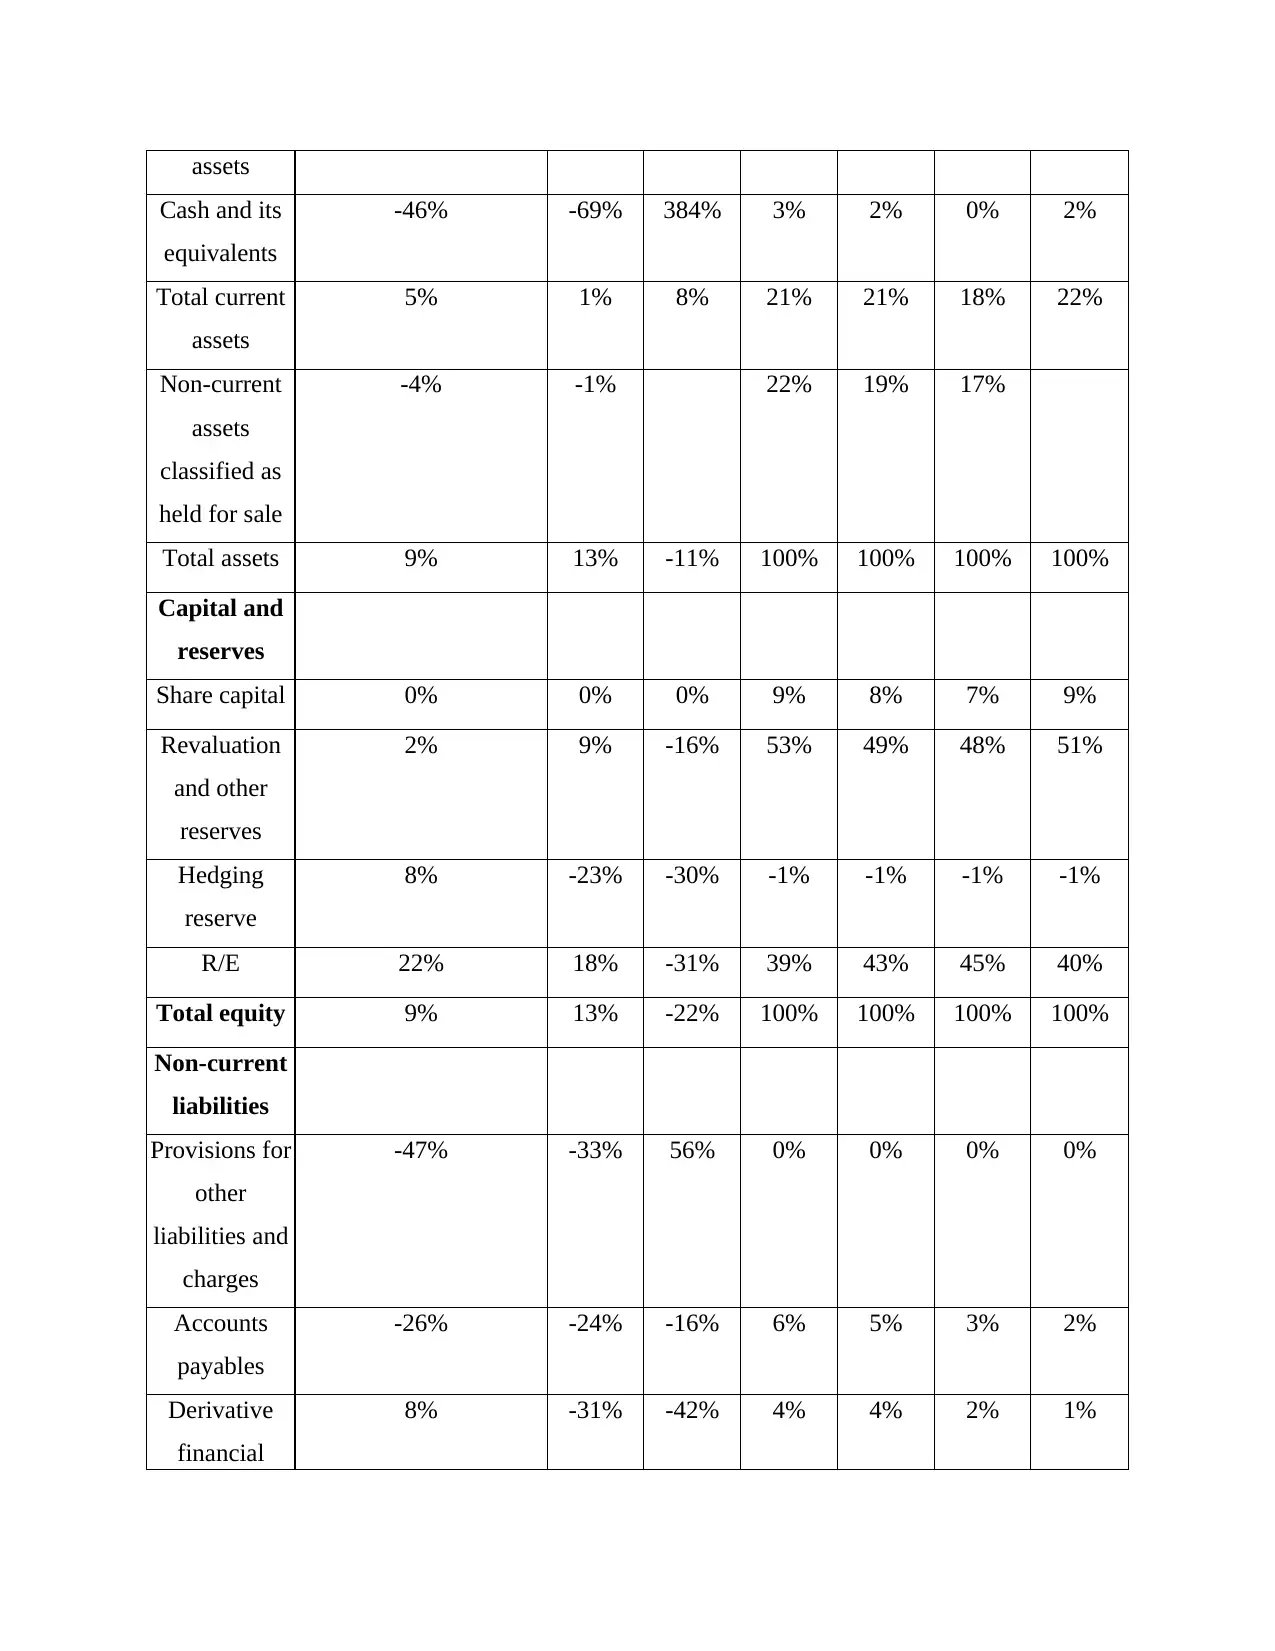
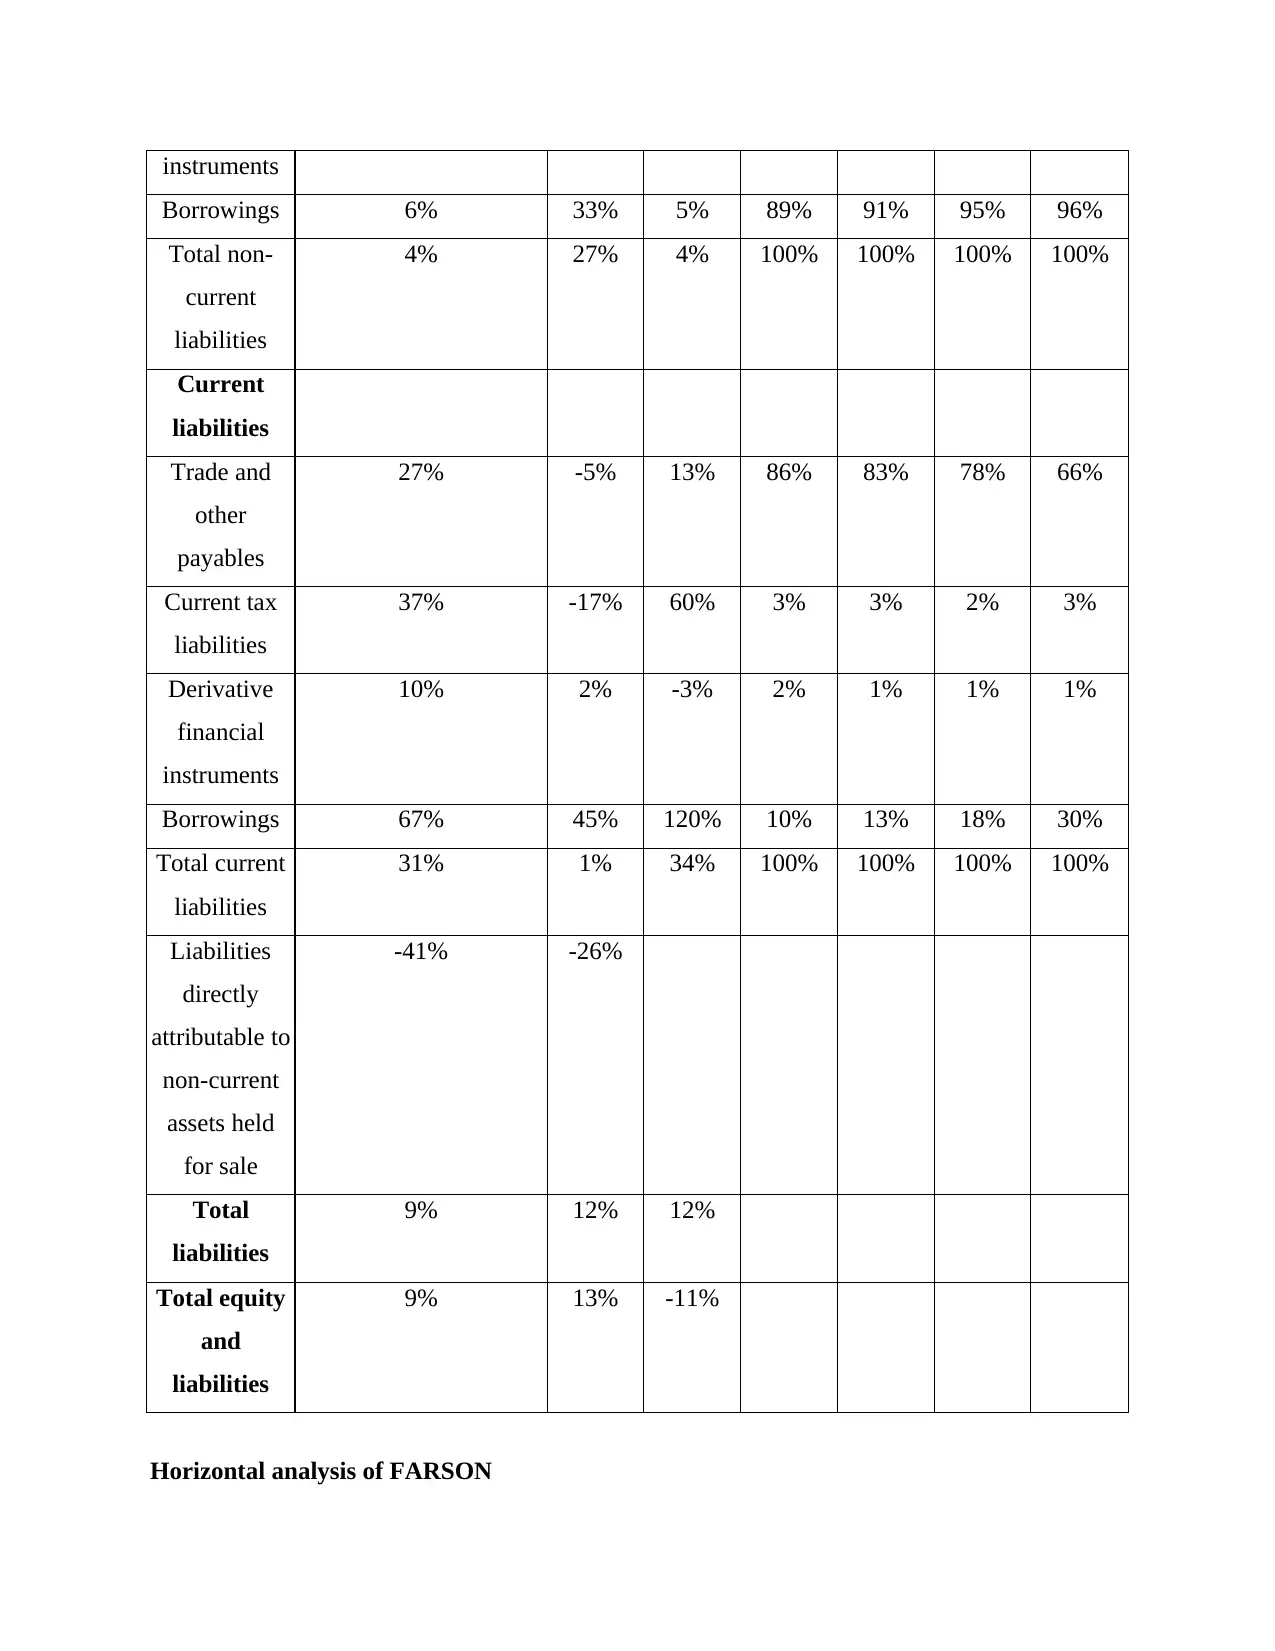
This report provides a comprehensive financial analysis of two companies, Heiniken and Farsons, using ratio analysis to assess their financial health and performance over a five-year period. The analysis includes detailed examinations of profitability ratios (operating profit margin, net profit margin, return on assets, and return on equity), leverage ratios (debt-equity ratio, debt-assets ratio), liquidity ratios (current ratio, quick ratio), efficiency ratios (receivable turnover, payable turnover, asset turnover, and inventory days), and shareholders' ratios. The report also incorporates horizontal and vertical analyses of the profit and loss statements and balance sheets of Farsons and Heiniken, providing a comparative overview of their financial positions and trends. The findings highlight the strengths and weaknesses of each company, offering insights into their operational efficiency, debt management, liquidity, and overall financial performance, concluding with recommendations based on these analyses. This report is a student contribution to Desklib, a platform offering AI-powered study tools and past assignments to help students excel in their academics.
tabler-icon-diamond-filled.svg

Contribute Materials

Your contribution can guide someone’s learning journey. Share your documents today.
Document Page
Financial Analysis
Management & Enterprise
tabler-icon-diamond-filled.svg

Secure Best Marks with AI Grader

Need help grading? Try our AI Grader for instant feedback on your assignments.
Document Page
Document Page
Executive summary
The report will be revealing about Heinken and Farson financial health and position using
ration analysis. The report will provide understanding about the various ratios that are used by
organisations and the users of financial statements for making decisions regarding the financials
position of company. It helps in comparison of financials statements of two different companies
for a given period.
1. Presenting detailed analysis of the financial performance of two companies
Ratio analysis of Heiniken and Farson for the period of 5 years are enumerated below:
Heiniken
1
Document Page
farsons
Profitability ratio
Operating profit margin- It means the ratio that indicates the profits earned by the
companies after meeting all its variable cost like raw material, wages etc(Annual Report Farson
2016, 2019). It is type of the profitability ratio that depicts an efficiency of the firm in keeping
2
tabler-icon-diamond-filled.svg

Secure Best Marks with AI Grader

Need help grading? Try our AI Grader for instant feedback on your assignments.
Document Page
effective control over the cost and the expenses attached with the business operations. Higher the
operating margin reflects better performance of an enterprise for each accounting period
(Rahman, 2017). From the analysis it has been seen that operating margin ratio of Heiniken is
declining over the years while of Farsons is showing an increasing trend which means that
Farsons could efficiently meet its operational expenses as compared Heiniken.
Net profit margin- It is the profitability ratio which indicates proportion of sales revenue
which is translated into the net profit. This ratio is been stated as key performance measure of the
firm's profitability. Higher or increasing net profit margin reflects that the company is more and
more efficient in converting its sales into the net profit. As per the results generated, it has been
analysed that net profit ratio of Heiniken is declining over the four year as the value of its
operating profit reduces and in turn shows that the company is not performing effectively and is
not making use of its sales in respect of generating profits. However, the NP ratio of Farsons is
seen increasing over the past 4 years which clearly means that after paying off all the cost and
the expenses, company is generating enough profits and reflected as the better performing
company in comparison to its rivalry that is Heiniken.
Return on assets- It referred as the ratio which measures the effectiveness of the
companies in respect to earning the return on their investment in the assets. It shows the extent
up-to which company could be able to convert its money in purchasing the assets into the net
profit. Positive value of ROA indicates high amount of profit generated with the use of assets.
The ROA of both the companies in the previous four years is been seen as stable as ratio of
Heiniken remains as 5 and of Farsons resulted as 7 which in turn means that Farons is making
more efficient use of its assets as compared to Heiniken.
Return on equity- This means as the profitability ratio which measures an ability of an
entity in generating the profits from the investment made by their shareholders within the
company (Wheeler, 2017). In accordance to the analysis made it has been seen that ROE of
Heiniken is decreasing whereas of Farsons is increasing that is rising from 8 to 12 over the 4
years. This means that Farsons is generating large amount of profits from an investment made
by their shareholder as compared to its competitor Heiniken.
Leverage ratio
Debt-equity ratio- It shows the percentage value of the company's financing which is
been attained from their investors and the creditors. Higher the debt to equity ratio reflects more
3
Document Page
of the creditor financing is been used than an investor financing. Referring to the evaluation its
has been seen that D/E ratio of both the company is increasing in the past years which is not
stated as the good sign for an entity and represents that company is not been able to make
sufficient cash in order to satisfy their debt related obligation.
Debt-assets ratio- This leverage ratio reflects the amount of the liabilities owned by the
firm over its assets. Ratio resulted equating to 1 means that an organization owns similar amount
of the assets and liabilities and this in turn shows that an entity is highly leveraged. Moreover, if
the ratio resulted greater than 1, an enterprise owns more and more liabilities than its assets.
Therefore, as per result it has been seen that the ratio of both the companies is increasing but is
less than 1 which shows better leverage position of both the firms over the years.
Liquidity ratio
Current ratio- It means the ratio that measures the liquidity position of the company by
assessing the current assets and current liabilities of the firm. Over 4 years, current ratio of
Heiniken is increasing which means that it is making an efficient use of its assets and has the
ability in meeting its short term obligation (Kajananthan and Velnampy, 2018). On the other
side, current ratio of Farsons has reached to an ideal ratio that is 2:1 and is greater than Heiniken
which means better liquidity position of the corporation.
Quick ratio- It indicates current liquid position of the firm and measures an ability of the
company in paying off its current obligation with the use of its immediate assets. The quick ratio
of both the company is seen as increasing which clearly depicts better liquidity position of an
organization within the industry.
Efficiency ratio
Receivable turnover- It means the ratio which indicates collection process of an
organization and ensures that large number of the quality customers pay-off their debts on a
quick basis. High ratio of receivable turnover reflects that the company operates more on the
cash basis rather than on credit basis. As per the outcome evaluated, the ratio of receivable
turnover of Farsons is higher than Heiniken which in turn shows better efficiency of the firm.
Payable turnover- This is the ratio which shows creditors current liquidity and
creditworthiness of an enterprise. High ratio reflects prompt payment is been made to the
suppliers for purchasing on the credit. Both the companies are having stable ratio and shows that
it makes payment on time and not take long period.
4
Document Page
Asset turnover- This ratios reflects generating sales through use of assets and higher ratio
seems as favourable as it shows more and more efficient use of the assets. Both the companies
are making better use of their assets as the ratio is rising for producing sales and meeting the
target.
Inventory days- It is the ratio that indicates the inventory that are fast moving if high
value of ratio resulted and slow moving in case of obsolete inventory. The ratio of both the
company is high which means that their stock is fast moving and the companies for not main
excess inventory (Meena and Dhar, 2016).
Shareholders ratio
Shareholders equity ratio- It shows the funding of the company's assets with its equity
shares he and represents amount of the assets on which the shareholder is having a residual
claim. The company’s shareholder ratio is stable over the years which means better financial
state of an entity.
Horizontal and vertical analysis of Farsons
Profit and loss
Vertical analysis
Particulars 2015 2016 2017 2018
Cost of Sales -62.75% -61.65% -60.92% -60.98%
Gross Profit 37.25% 38.35% 39.08% 39.02%
Selling and Dist.
Cost -12.40% -11.82% -12.16% -10.88%
Adm. Exp. -12.13% -12.88% -12.34% -12.70%
Other operational
exp. -0.47% -0.31% 0.00% 0.00%
Operating profit 12.24% 13.34% 14.58% 15.44%
Finance income 0.02% 0.02% 0.01% 0.00%
Finance costs -1.86% -1.60% -1.67% -1.27%
PBT 10.40% 11.75% 12.92% 14.17%
Tax income 6.59% 1.01% 0.53% 1.00%
5
tabler-icon-diamond-filled.svg

Paraphrase This Document

Need a fresh take? Get an instant paraphrase of this document with our AI Paraphraser
Document Page
Profit for the
year from
continuing
operations 16.99% 12.76% 13.46% 15.17%
Discontinued
operations -6.88% 0.28% 0.31% -0.68%
Profit 10.11% 13.04% 13.77% 14.49%
Interpretation: From the above vertical analysis of Farsons company, is shows the operating
profits, PBT and profits of company in end of year. As per the vertical analysis, company's profit
end of 2018 is 14.49% which is higher as compare with another previous year such as 2015,
2016 and 2018.
Horizontal analysis
Particulars 2016 2017 2018
Revenue 8.62% 2.42% 7.79%
Cost of Sales 6.71% 1.21% 7.89%
Gross Profit 11.84% 4.37% 7.62%
Selling and Dist. Cost 3.55% 5.33% -3.55%
Adm. Exp. 15.29% -1.86% 10.98%
Other operational exp. -27.93% -100.00% #DIV/0!
Operating profit 18.36% 12.00% 14.08%
Finance income 16.67% -64.29% -100.00%
Finance costs -6.45% 6.75% -17.89%
PBT 22.79% 12.61% 18.16%
Tax income -83.36% -45.80% 101.49%
Profit for the year
from continuing -18.40% 7.99% 21.47%
6
Document Page
operations
Discontinued
operations -104.44% 13.22% -334.31%
Profit 40.13% 8.10% 13.44%
Interpretation: The above horizontal analysis statement is shown the consolidated profit
and loss statements show profit of Farsons company in the 2016 is higher i.e. 40.13% as compare
with 2017 and 2018.
Balance sheet
7
Document Page
Horizontal and analysis of FARSON is enumerated below:
Horizontal analysis Vertical analysis
Assets 2016 2017 2018 2015 2016 2017 2018
PPE 12% 23% 6% 95% 92% 94% 92%
Investment
property
0% 0% 0% 0%
Intangible
assets
-8% -6% -7% 1% 1% 1% 0%
Investments
in
subsidiaries
0% 0% 0% 0%
Investments
in jointly-
controlled
entities
0% 0% 0% 0%
Deferred tax
assets (DTA)
149% -17% 53% 2% 4% 3% 4%
Trade and
other
receivables
98% 9% 24% 2% 3% 3% 3%
Total fixed
assets
16% 21% 8% 100% 100% 100% 100%
Current
assets
Stocks 20% 18% -6% 7% 8% 8% 8%
Loans and
receivables
0% 0% 0% 0%
Accounts
receivable
11% -1% 4% 11% 11% 10% 12%
Current tax -61% -78% -83% 0% 0% 0% 0%
tabler-icon-diamond-filled.svg

Secure Best Marks with AI Grader

Need help grading? Try our AI Grader for instant feedback on your assignments.
Document Page
assets
Cash and its
equivalents
-46% -69% 384% 3% 2% 0% 2%
Total current
assets
5% 1% 8% 21% 21% 18% 22%
Non-current
assets
classified as
held for sale
-4% -1% 22% 19% 17%
Total assets 9% 13% -11% 100% 100% 100% 100%
Capital and
reserves
Share capital 0% 0% 0% 9% 8% 7% 9%
Revaluation
and other
reserves
2% 9% -16% 53% 49% 48% 51%
Hedging
reserve
8% -23% -30% -1% -1% -1% -1%
R/E 22% 18% -31% 39% 43% 45% 40%
Total equity 9% 13% -22% 100% 100% 100% 100%
Non-current
liabilities
Provisions for
other
liabilities and
charges
-47% -33% 56% 0% 0% 0% 0%
Accounts
payables
-26% -24% -16% 6% 5% 3% 2%
Derivative
financial
8% -31% -42% 4% 4% 2% 1%
Document Page
instruments
Borrowings 6% 33% 5% 89% 91% 95% 96%
Total non-
current
liabilities
4% 27% 4% 100% 100% 100% 100%
Current
liabilities
Trade and
other
payables
27% -5% 13% 86% 83% 78% 66%
Current tax
liabilities
37% -17% 60% 3% 3% 2% 3%
Derivative
financial
instruments
10% 2% -3% 2% 1% 1% 1%
Borrowings 67% 45% 120% 10% 13% 18% 30%
Total current
liabilities
31% 1% 34% 100% 100% 100% 100%
Liabilities
directly
attributable to
non-current
assets held
for sale
-41% -26%
Total
liabilities
9% 12% 12%
Total equity
and
liabilities
9% 13% -11%
Horizontal analysis of FARSON
Document Page
Interpretation: The above horizontal analysis of Farsons company is shown the proper
balance sheet which reflect that the total assets in 2018 is 11% is lower as compare with another
years (Annual Report Heineken 2018, 2019).
Vertical analysis of FARSON
Interpretation: The vertical analysis of Farsons company is shown a proper balance sheet
of company which reflect that the total assets in the end of every year 2015, 2016, 2017 and 2018
are same which is 100%.
Horizontal and vertical analysis of Heiniken
Profit and loss
Interpretation- The above vertical profits and loss statement of Heiniken company
(Annual Report Heineken 2016, 2019). As per that company earn 10.44% profit in 2015 and
7.81% profit in 2018. As compared to that company faces losses in the 2018 as per vertical
analysis of income statements.
tabler-icon-diamond-filled.svg

Paraphrase This Document

Need a fresh take? Get an instant paraphrase of this document with our AI Paraphraser
Document Page
Interpretation: As per the horizontal analysis company faces higher loss in 2016 i.e. -
19% as compare to another year and have 24% profit in 2017.
Document Page
Interpretation: As per the above income statement which is balance sheet of company is
reflect the total assets and total liabilities of company. The total assets and total liabilities in the
end of each year are same which 100% is.
Document Page
tabler-icon-diamond-filled.svg

Secure Best Marks with AI Grader

Need help grading? Try our AI Grader for instant feedback on your assignments.
Document Page
Interpretation: As per the horizontal analysis, total assets and total liabilities in the end of
2016 is -2% and 2018 is 2% which is reflected that company grow in proper manner. On the
other side, total liabilities of company in the end of 2016 and 2017 are same 4% and in the end of
2018 is 2%.
Document Page
2. Importance of analysing working capital -
Working capital:
The term working capital is defined as the variance between the current assets of
company such as accounts receivable, cash etc. and current liabilities such as outstanding
expenses, accounts payable etc. It is also known as net working capital. There are different types
of working capital such as temporary and permanent, gross and net working capital etc. For
Example – the portion of debt due within one year. The working capital is the result of various
types of activities like debt management, payment to creditors etc. Further, working capital
analysis is defined as the analysis used to determine the sufficiency and liquidity of current
assets as compared with current liabilities.
Farsons -
The analysis of current assets and current liabilities is very important for the firms before
taking any decision. Before taking any type of decision Farsons should evaluate the working
capital due to various reasons. Working capital analysis helps to examine the timeline within
which current liabilities will be due for payment (Weygandt, Kimmel, and Kieso, 2019). The
information gain by company by analysing working capital helps to determine whether the
business will require extra-long term funds for performing different types of operations. It will
help Farsons to determine whether company should plan to shift additional cash into long term
investment vehicles. The analysis of working capital before taking a decision will help firm to
maximize the efficiency of the operations. It will also help to maintain smooth operations and
support the company to improve its profitability and earnings as well. It also ensures effective
management of accounts payables and management of stock (Annual Report Farson 2016,
2019).
Heniken -
To analyse working capital Heniken may use age accounts payable report that divides
accounts payable into 30 days’ time buckets. This will help company to evaluate the need of cash
for short period. Further, the timing of payment of other liabilities such as outstanding liabilities
etc can be layered on the top of the working capital analysis to offer a detailed view of exactly
when the firm is required to pay the amount of outstanding obligations. Further, working capital
analysis will also help Heniken to analyse the debtors. The analysis can be performed with the
help of aged accounts receivable report and also with the help of short term-time buckets. The
Document Page
result of this analysis will require to be revised for the clients that are having the history of
paying the amount later than due date, so that the report provides a more correct assessment of
potential incoming cash flows. The analysis of working capital will support Heniken to focus on
maintaining sufficient balance between current liabilities and current assets of the firm. Further,
effective system of working capital analysis uses major ratios such as inventory turnover ratio,
capital ratio that assist firm to determine and evaluate areas that require attention in order to
maintain profitability and liquidity. This will not only help company to meet out financial
obligations but also assist the management to improve the earnings of the business.
3. Analysis of annual cash flow of both the companies.
Farsons Heniken
Particulars Formula 2017 2018 2017 2018
Cash flow
margin ratio
Cash flow from
operations/Net sales 0.18 0.24 0.22 0.21
Cash flow
coverage ratio
Cash flow from
operations/Total debt 0.26 0.34 0.19 0.21
Current
liabilities'
coverage ratio
Cash flow from
operations/Current
liabilities
0.64 0.71 0.47 0.53
Definitions -
Cash flow margin ratio - It helps to measure the cash from operating activities as a
percentage of revenue generated from sales in a given period.
Cash flow coverage ratio - It indicates the capacity of firm to pay the amount of
principal and interest at the due date.
tabler-icon-diamond-filled.svg

Paraphrase This Document

Need a fresh take? Get an instant paraphrase of this document with our AI Paraphraser
Document Page
Current liabilities' coverage ratio - It measures the relationship between cash generated
from operations and current liabilities of the company.
Farsons :
Interpretation -
It has been interpreted that the cash flow margin ratio of the firm has improved from year
2017 to 2018. The ratio in year 2017 was 0.17 whereas, in year 2018 it was 0.24. It means that
the ability of company has improved for converting sales into cash flow.
Further, the cash flow coverage ratio of Farson has shown an improvement in year 2018
as compared to year 2017. The ratio in year 2017 was 0.25 and in year 2018 it was 0.34. It has
been analysed that the ability of company has been improved to repay the amount of liabilities.
Moreover, the current liabilities' coverage ratio of the organization has improved in year
2018 as compared with the value of ratio in year 2018. The ratio in year 2017 was 0.63 and the
ratio in year 2018 was 0.70. Further, it has been interpreted from the above calculation that the
ability of Farsons has improved and it is able to pay the amount of current liabilities on time.
Heniken:
Interpretation -
It has been analysed that cash flow margin ratio of Heniken has reduced from year 2017
to year 2018. The ratio in year 2017 is 0.22 whereas it has decreased up-to 0.20 in year 2018. It
has been concluded that the capability of the firm has reduced for converting the amount of sales
into cash inflow.
Moreover, it has been concluded that the cash flow coverage ratio of the firm has
increased from year 2017 to year 2018. In year 2017, the ratio was 0.18 as compared to year
2017 in which the cash flow coverage ratio was 0.20.
Further, current liabilities' coverage ratio of Heniken has increased in year 2018 as
compared with the value of ratio in year 2017. The ratio in year 2017 was 0.47 whereas in year
2018 the ratio has increased up-to 0.53. It has been concluded that the company has sufficient
amount of cash from operations to pay the amount of outstanding liabilities to different parties.
Document Page
REFERENCES
Books and Journals
Kajananthan, R. and Velnampy, T., 2018. Liquidity, Solvency and Profitability Analysis Using
Cash Flow Ratios and Traditional Ratios: The Telecommunication Sector in Sri
Lanka. Research Journal of Finance and Accounting. 5(23).
Meena, A.K. and Dhar, J., 2016. An empirical analysis and comparative study of liquidity ratios
and asset-liability management of banks operating in India. International Journal of
Social, Behavioral, Educational, Economic, Business and Industrial Engineering. 8(1).
pp.342-348.
Rahman, A.A.A.A., 2017. The Relationship between Solvency Ratios and Profitability Ratios:
Analytical Study in Food Industrial Companies listed in Amman Bursa. International
Journal of Economics and Financial Issues. 7(2). pp.86-93.
Weygandt, J.J., Kimmel, P.D. and Kieso, D.E., 2019. Financial accounting. Wiley.
Wheeler, D.G., 2017. Financial Ratios and Profitability-Strategy for Mid-Level Construction
Firms: Growth or Value Strategies? (Doctoral dissertation).
Williams, E.E. and Dobelman, J.A., 2017. Financial statement analysis. World Scientific Book
Chapters, pp.109-169.
Online
Annual Report Heineken 2018. 2019[Online]. Available through:
<file:///home/user/Downloads/Heineken%20Holding%20NV%202018%20Annual
%20Report.pdf>.
Annual Report Heineken 2016. 2019.[Online]. Available through:
<file:///home/user/Downloads/Heineken%20NV%202016%20Annual%20Report.pdf>.
Annual Report Farson 2016. 2019. [Online]. Available through:
<file:///home/user/Downloads/Annual%20Report%202017.pdf>.
Document Page
APPENDIX
1. Ratio analysis
Heiniken
farsons
tabler-icon-diamond-filled.svg

Secure Best Marks with AI Grader

Need help grading? Try our AI Grader for instant feedback on your assignments.
Document Page
2. Assessment of annual cash flow pertaining to Heniken and Farsons
Farsons Heniken
Particulars Formula 2017 2018 2017 2018
Cash flow from operations 15513 22933 4924 5540
Sales 88119 94980 21888 26811
Total debt 59670 66896 26513 26416
Current liabilities 24297 32444 10458 10450
Document Page
Cash flow margin ratio
Cash flow from
operations/Net sales
0.1760460
287
0.241450
8318
0.22496345
03
0.2066
316064
Cash flow coverage ratio
Cash flow from
operations/Total
debt
0.2599798
894
0.342815
7139
0.18572021
27
0.2097
21381
Current liabilities' coverage
ratio
Cash flow from
operations/Current
liabilities
0.6384738
857
0.706848
724
0.47083572
38
0.5301
435407
Werne, J., 2015. An Optimization Of The Liquidity Coverage Ratio.
chevron_up_icon
1 out of 24
circle_padding
hide_on_mobile
zoom_out_icon
logo.png

Your All-in-One AI-Powered Toolkit for Academic Success.

Available 24*7 on WhatsApp / Email

[object Object]