Financial Analysis and Decision Making for HIKMA PHARMACEUTICALS PLC
VerifiedAdded on 2020/04/13
|23
|6067
|105
Project
AI Summary
This project report presents a detailed financial analysis of HIKMA Pharmaceuticals PLC, focusing on its performance, position, and profitability. It utilizes financial ratio analysis to evaluate the company's liquidity, solvency, and efficiency over several years. The report examines profitability ratios like operating and net margins, alongside liquidity ratios such as current and quick ratios. It further investigates the company's earnings, dividend policies, and cash flow from financing activities. The analysis compares HIKMA's performance with that of its competitor, INDIVIOR PLC, highlighting trends in operating profit and earnings. The report also includes a critical reflection on the company, incorporating insights from various financial sources and news articles to assess its market position and strategic acquisitions. The conclusion summarizes the key findings, emphasizing the company's financial stability and offering recommendations for improvement based on the analysis.
Running Head: Financial Decision Making
1
Project report: Financial Decision Making
1
Project report: Financial Decision Making
Paraphrase This Document
Need a fresh take? Get an instant paraphrase of this document with our AI Paraphraser
Financial Decision Making
2
Contents
Introduction.......................................................................................................................3
Financial ratio analysis.....................................................................................................3
Profitability, earnings and dividends............................................................................4
Financial stability and liquidity....................................................................................6
A critical reflection on the company................................................................................7
Corporate governance.......................................................................................................8
Asset price and evaluation................................................................................................8
Conclusion........................................................................................................................9
References.......................................................................................................................10
Appendix.........................................................................................................................11
Financial Decision Making
3
Introduction:
This report has been prepared to analyze the financial performance, position and the
profitability state of the company, HIKMA PHARMACEUTICALS PLC. In this report, the
financial statement of the HIKMA PHARMACEUTICALS PLC has been analyzed along
with the financial statement of its competitive company, INDIVIOR PLC. Study of ratio
analysis has been performed to analyze and identify the financial performance of the
company so that a better report could be presented to the board of directors of the company.
Being a financial director, all the financial aspect of the company has been investigated and a
better financial report has been prepared accordingly.
HIKMA PHARMACEUTICALS PLC is a global pharmaceutical organization which
is based in the London market. This company manufactures non branded and branded generic
products. This company has been founded in Jordan in 1978. Currently, it is listed in the
London Stock Exchange. This company has its operations in various countries and the market
base and the share of the company is continuously enhancing. According to the reports and
the articles of the company, it has been evaluated that the company share and the revenue is
continuously enhancing (Home, 2017). The vision and the goals of the company depict that
the company is required to manage the strategic acquisition and the organic growth to
manage and develop the business and sustain the high level of responsibility and the ethics
which are quite central to the manner we administer.
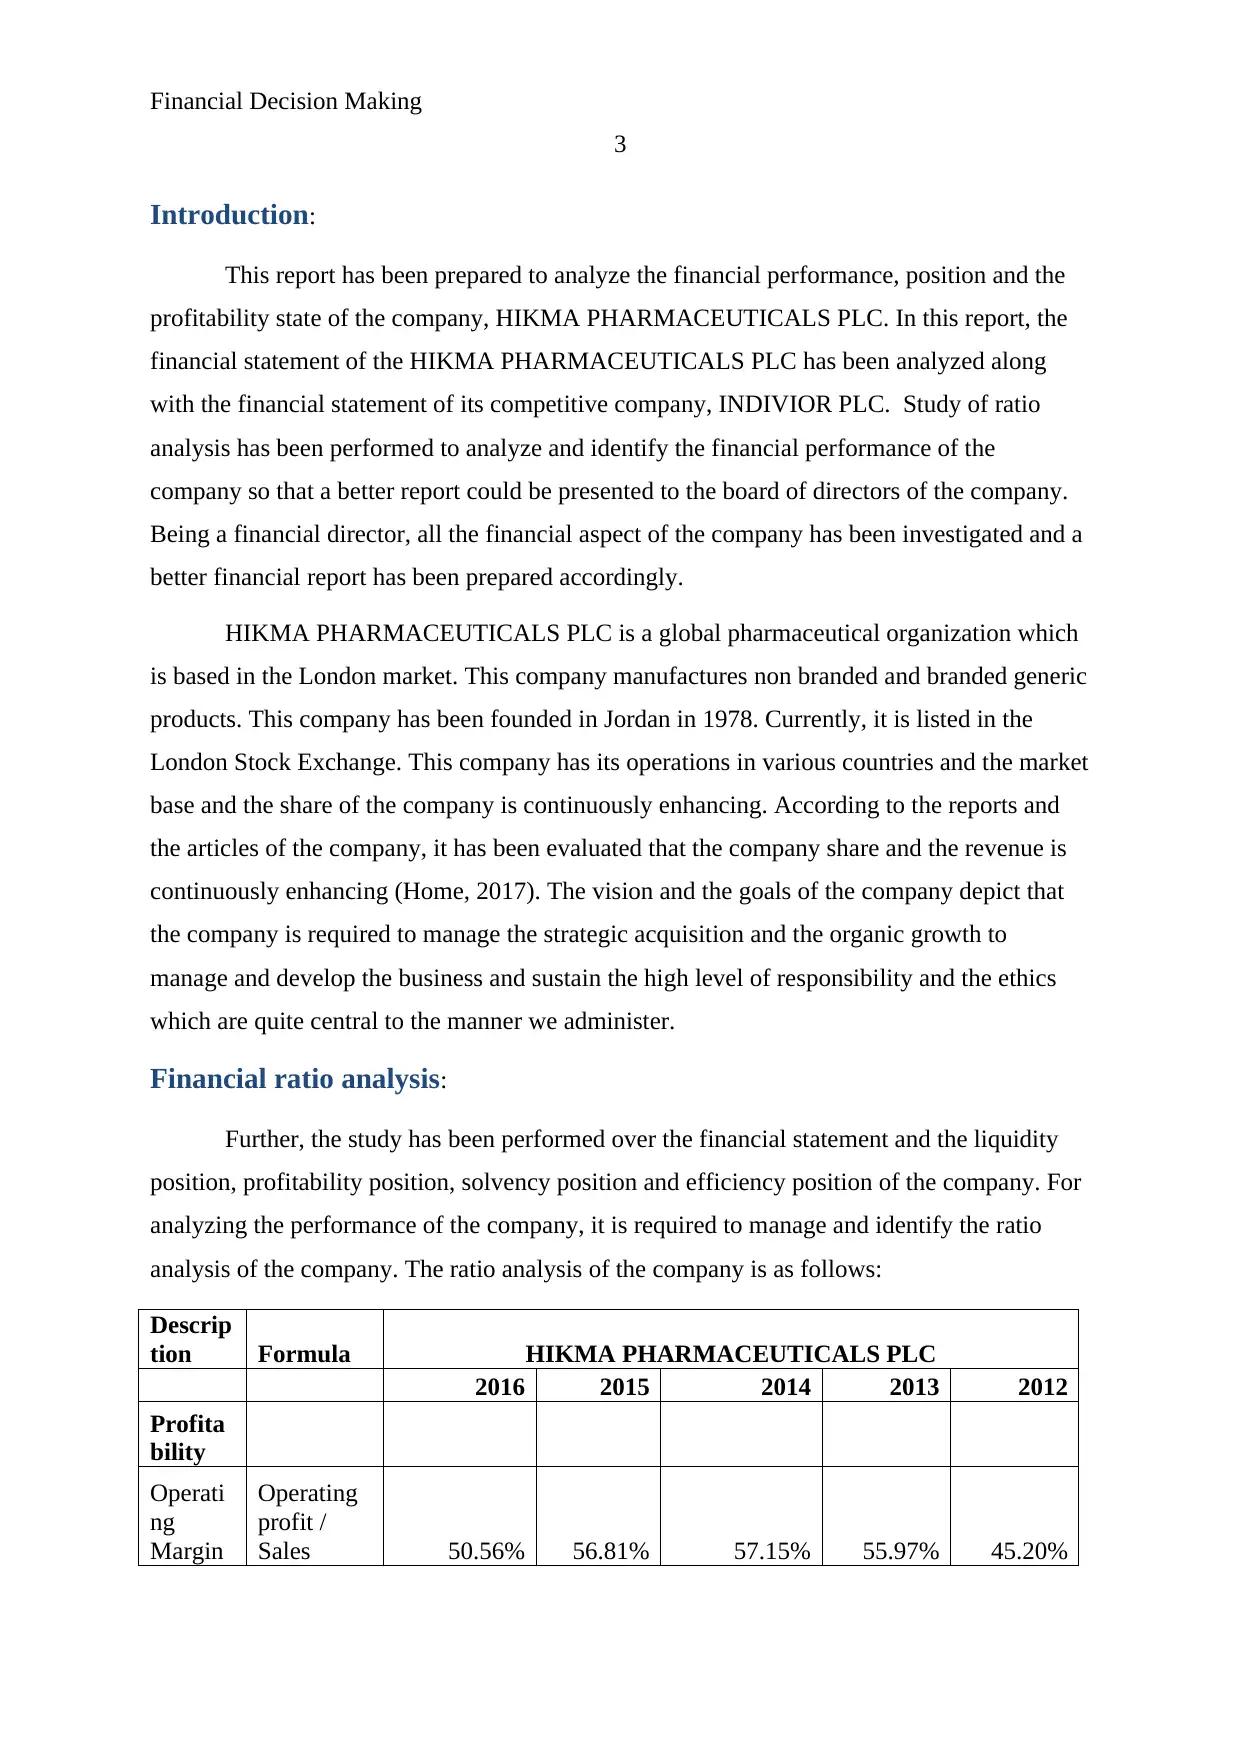
Financial ratio analysis:
Further, the study has been performed over the financial statement and the liquidity
position, profitability position, solvency position and efficiency position of the company. For
analyzing the performance of the company, it is required to manage and identify the ratio
analysis of the company. The ratio analysis of the company is as follows:
Descrip
tion Formula HIKMA PHARMACEUTICALS PLC
2016 2015 2014 2013 2012
Profita
bility
Operati
ng
Margin
Operating
profit /
Sales 50.56% 56.81% 57.15% 55.97% 45.20%
3
Introduction:
This report has been prepared to analyze the financial performance, position and the
profitability state of the company, HIKMA PHARMACEUTICALS PLC. In this report, the
financial statement of the HIKMA PHARMACEUTICALS PLC has been analyzed along
with the financial statement of its competitive company, INDIVIOR PLC. Study of ratio
analysis has been performed to analyze and identify the financial performance of the
company so that a better report could be presented to the board of directors of the company.
Being a financial director, all the financial aspect of the company has been investigated and a
better financial report has been prepared accordingly.
HIKMA PHARMACEUTICALS PLC is a global pharmaceutical organization which
is based in the London market. This company manufactures non branded and branded generic
products. This company has been founded in Jordan in 1978. Currently, it is listed in the
London Stock Exchange. This company has its operations in various countries and the market
base and the share of the company is continuously enhancing. According to the reports and
the articles of the company, it has been evaluated that the company share and the revenue is
continuously enhancing (Home, 2017). The vision and the goals of the company depict that
the company is required to manage the strategic acquisition and the organic growth to
manage and develop the business and sustain the high level of responsibility and the ethics
which are quite central to the manner we administer.
Financial ratio analysis:
Further, the study has been performed over the financial statement and the liquidity
position, profitability position, solvency position and efficiency position of the company. For
analyzing the performance of the company, it is required to manage and identify the ratio
analysis of the company. The ratio analysis of the company is as follows:
Descrip
tion Formula HIKMA PHARMACEUTICALS PLC
2016 2015 2014 2013 2012
Profita
bility
Operati
ng
Margin
Operating
profit /
Sales 50.56% 56.81% 57.15% 55.97% 45.20%
⊘ This is a preview!⊘
Do you want full access?
Subscribe today to unlock all pages.
Trusted by 1+ million students worldwide
Financial Decision Making
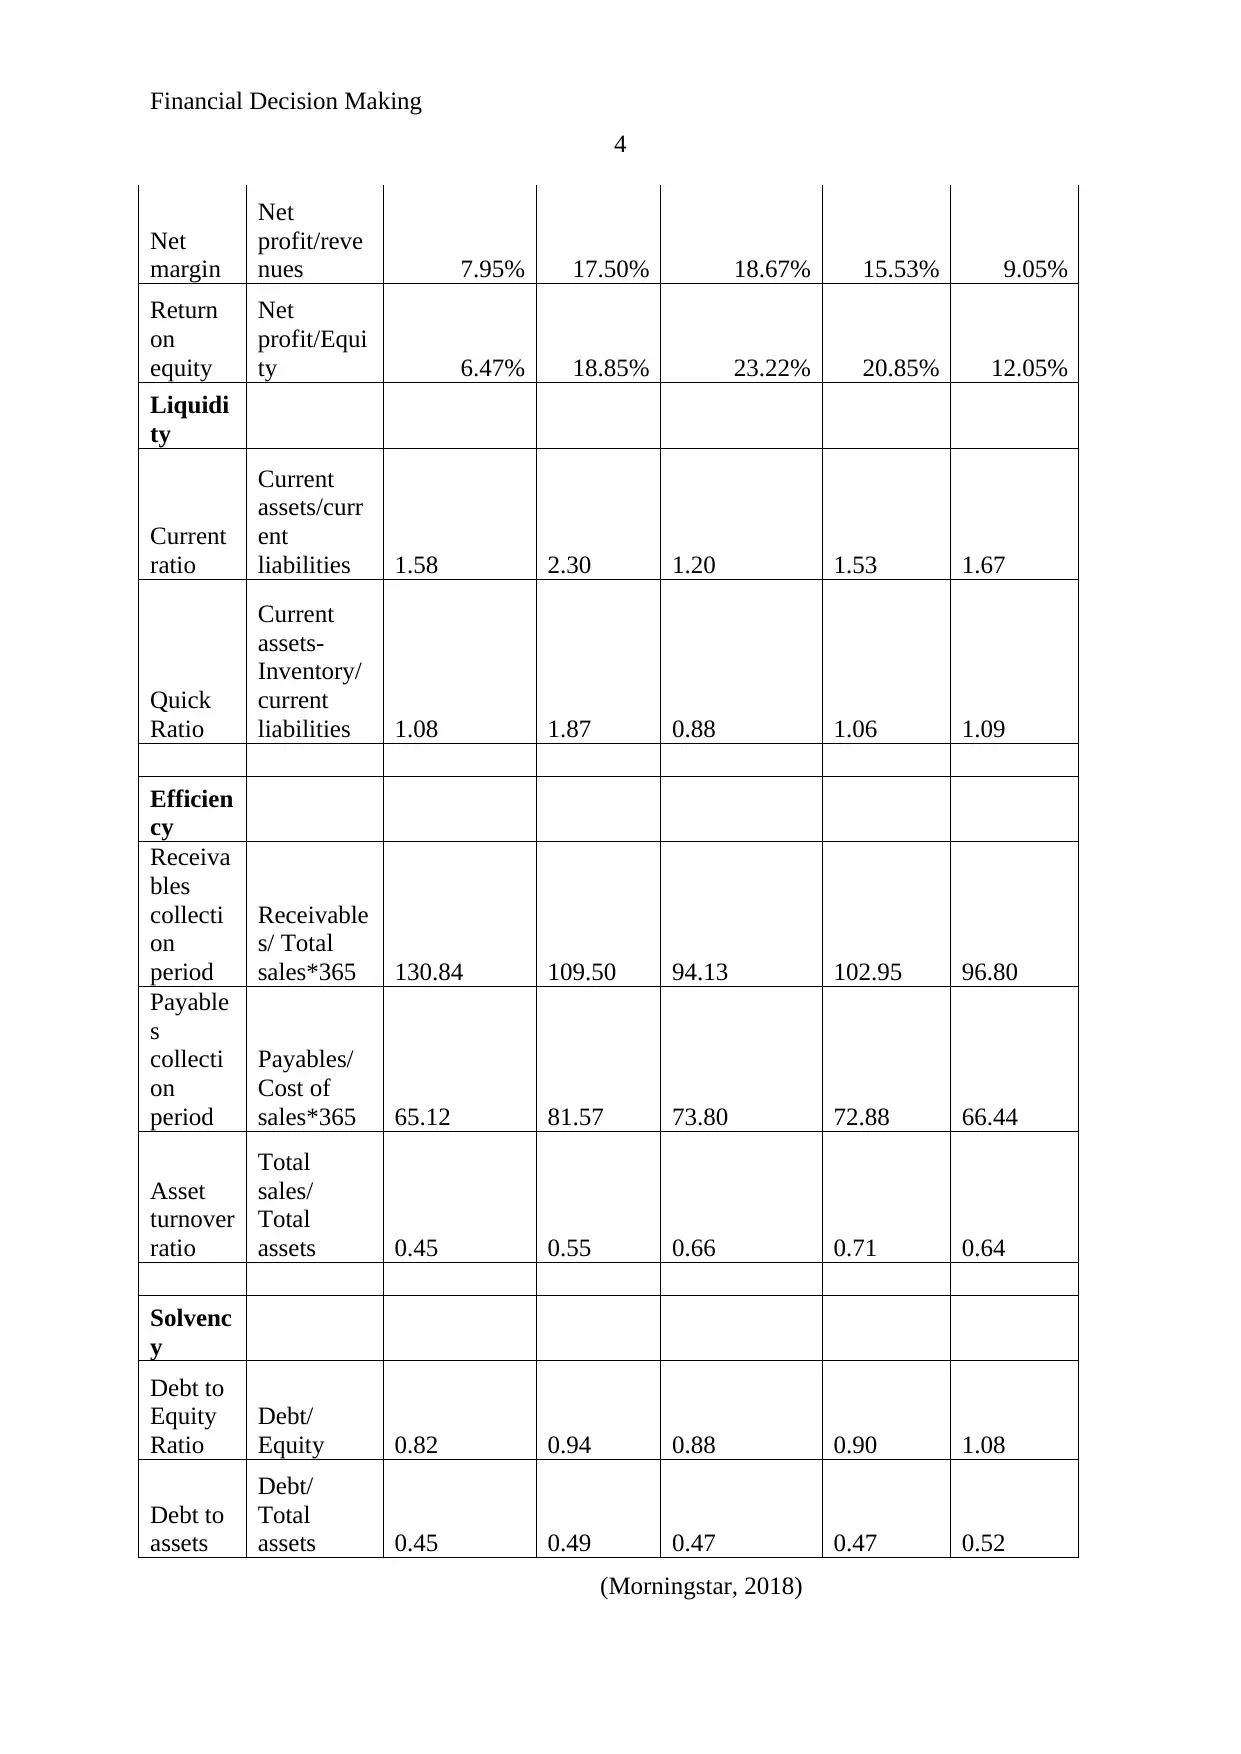
4
Net
margin
Net
profit/reve
nues 7.95% 17.50% 18.67% 15.53% 9.05%
Return
on
equity
Net
profit/Equi
ty 6.47% 18.85% 23.22% 20.85% 12.05%
Liquidi
ty
Current
ratio
Current
assets/curr
ent
liabilities 1.58 2.30 1.20 1.53 1.67
Quick
Ratio
Current
assets-
Inventory/
current
liabilities 1.08 1.87 0.88 1.06 1.09
Efficien
cy
Receiva
bles
collecti
on
period
Receivable
s/ Total
sales*365 130.84 109.50 94.13 102.95 96.80
Payable
s
collecti
on
period
Payables/
Cost of
sales*365 65.12 81.57 73.80 72.88 66.44
Asset
turnover
ratio
Total
sales/
Total
assets 0.45 0.55 0.66 0.71 0.64
Solvenc
y
Debt to
Equity
Ratio
Debt/
Equity 0.82 0.94 0.88 0.90 1.08
Debt to
assets
Debt/
Total
assets 0.45 0.49 0.47 0.47 0.52
(Morningstar, 2018)
Paraphrase This Document
Need a fresh take? Get an instant paraphrase of this document with our AI Paraphraser
Financial Decision Making
5
Through the above analysis over the key financial ratios of the company, it has been
expressed that the current financial position of the company is average. Various changes have
taken place into the performance and the position of the company. More, the position of the
company has also been changed (Morningstar, 2017). The current performance and the
position of the company express that the position of the company is bit better from last 5
years in the market.
Profitability, earnings and dividends:
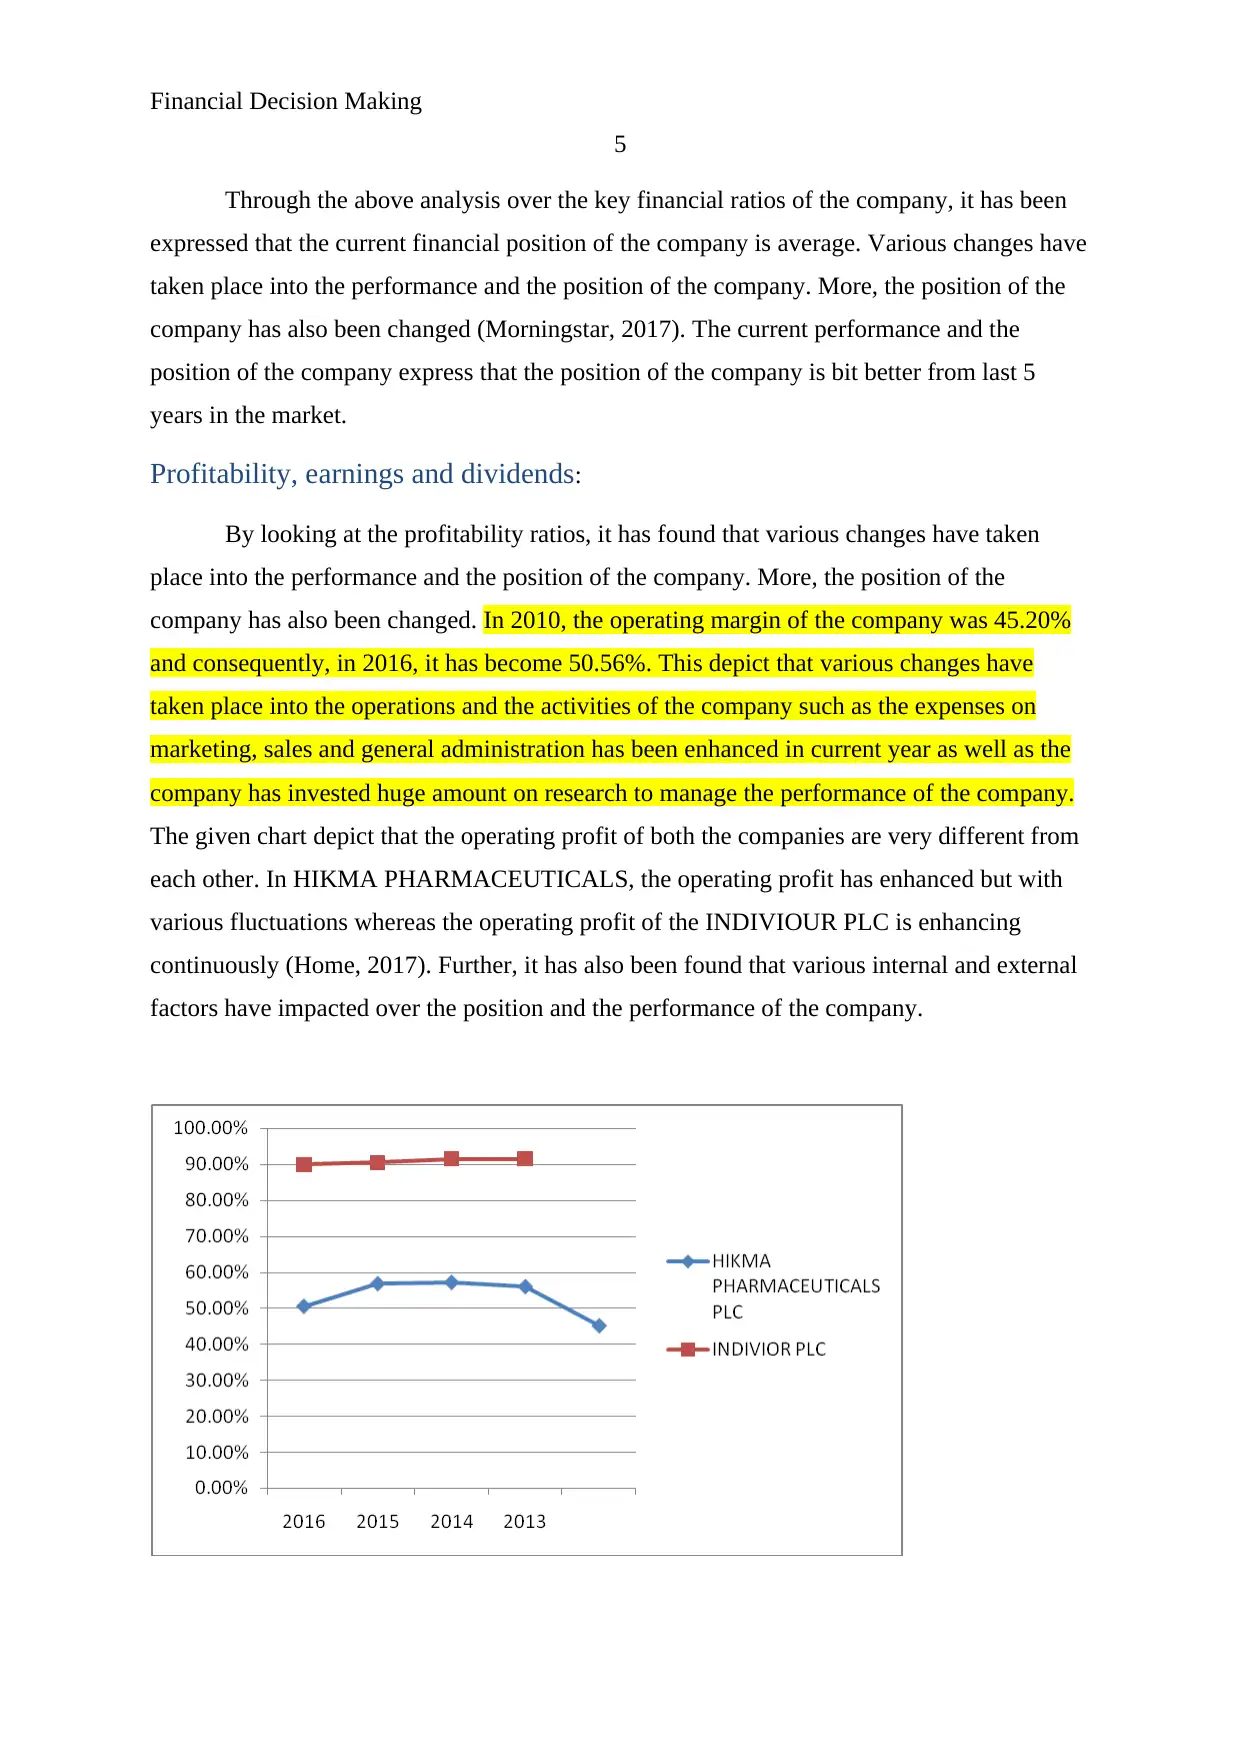
By looking at the profitability ratios, it has found that various changes have taken
place into the performance and the position of the company. More, the position of the
company has also been changed. In 2010, the operating margin of the company was 45.20%
and consequently, in 2016, it has become 50.56%. This depict that various changes have
taken place into the operations and the activities of the company such as the expenses on
marketing, sales and general administration has been enhanced in current year as well as the
company has invested huge amount on research to manage the performance of the company.
The given chart depict that the operating profit of both the companies are very different from
each other. In HIKMA PHARMACEUTICALS, the operating profit has enhanced but with
various fluctuations whereas the operating profit of the INDIVIOUR PLC is enhancing
continuously (Home, 2017). Further, it has also been found that various internal and external
factors have impacted over the position and the performance of the company.
5
Through the above analysis over the key financial ratios of the company, it has been
expressed that the current financial position of the company is average. Various changes have
taken place into the performance and the position of the company. More, the position of the
company has also been changed (Morningstar, 2017). The current performance and the
position of the company express that the position of the company is bit better from last 5
years in the market.
Profitability, earnings and dividends:
By looking at the profitability ratios, it has found that various changes have taken
place into the performance and the position of the company. More, the position of the
company has also been changed. In 2010, the operating margin of the company was 45.20%
and consequently, in 2016, it has become 50.56%. This depict that various changes have
taken place into the operations and the activities of the company such as the expenses on
marketing, sales and general administration has been enhanced in current year as well as the
company has invested huge amount on research to manage the performance of the company.
The given chart depict that the operating profit of both the companies are very different from
each other. In HIKMA PHARMACEUTICALS, the operating profit has enhanced but with
various fluctuations whereas the operating profit of the INDIVIOUR PLC is enhancing
continuously (Home, 2017). Further, it has also been found that various internal and external
factors have impacted over the position and the performance of the company.
Financial Decision Making
6
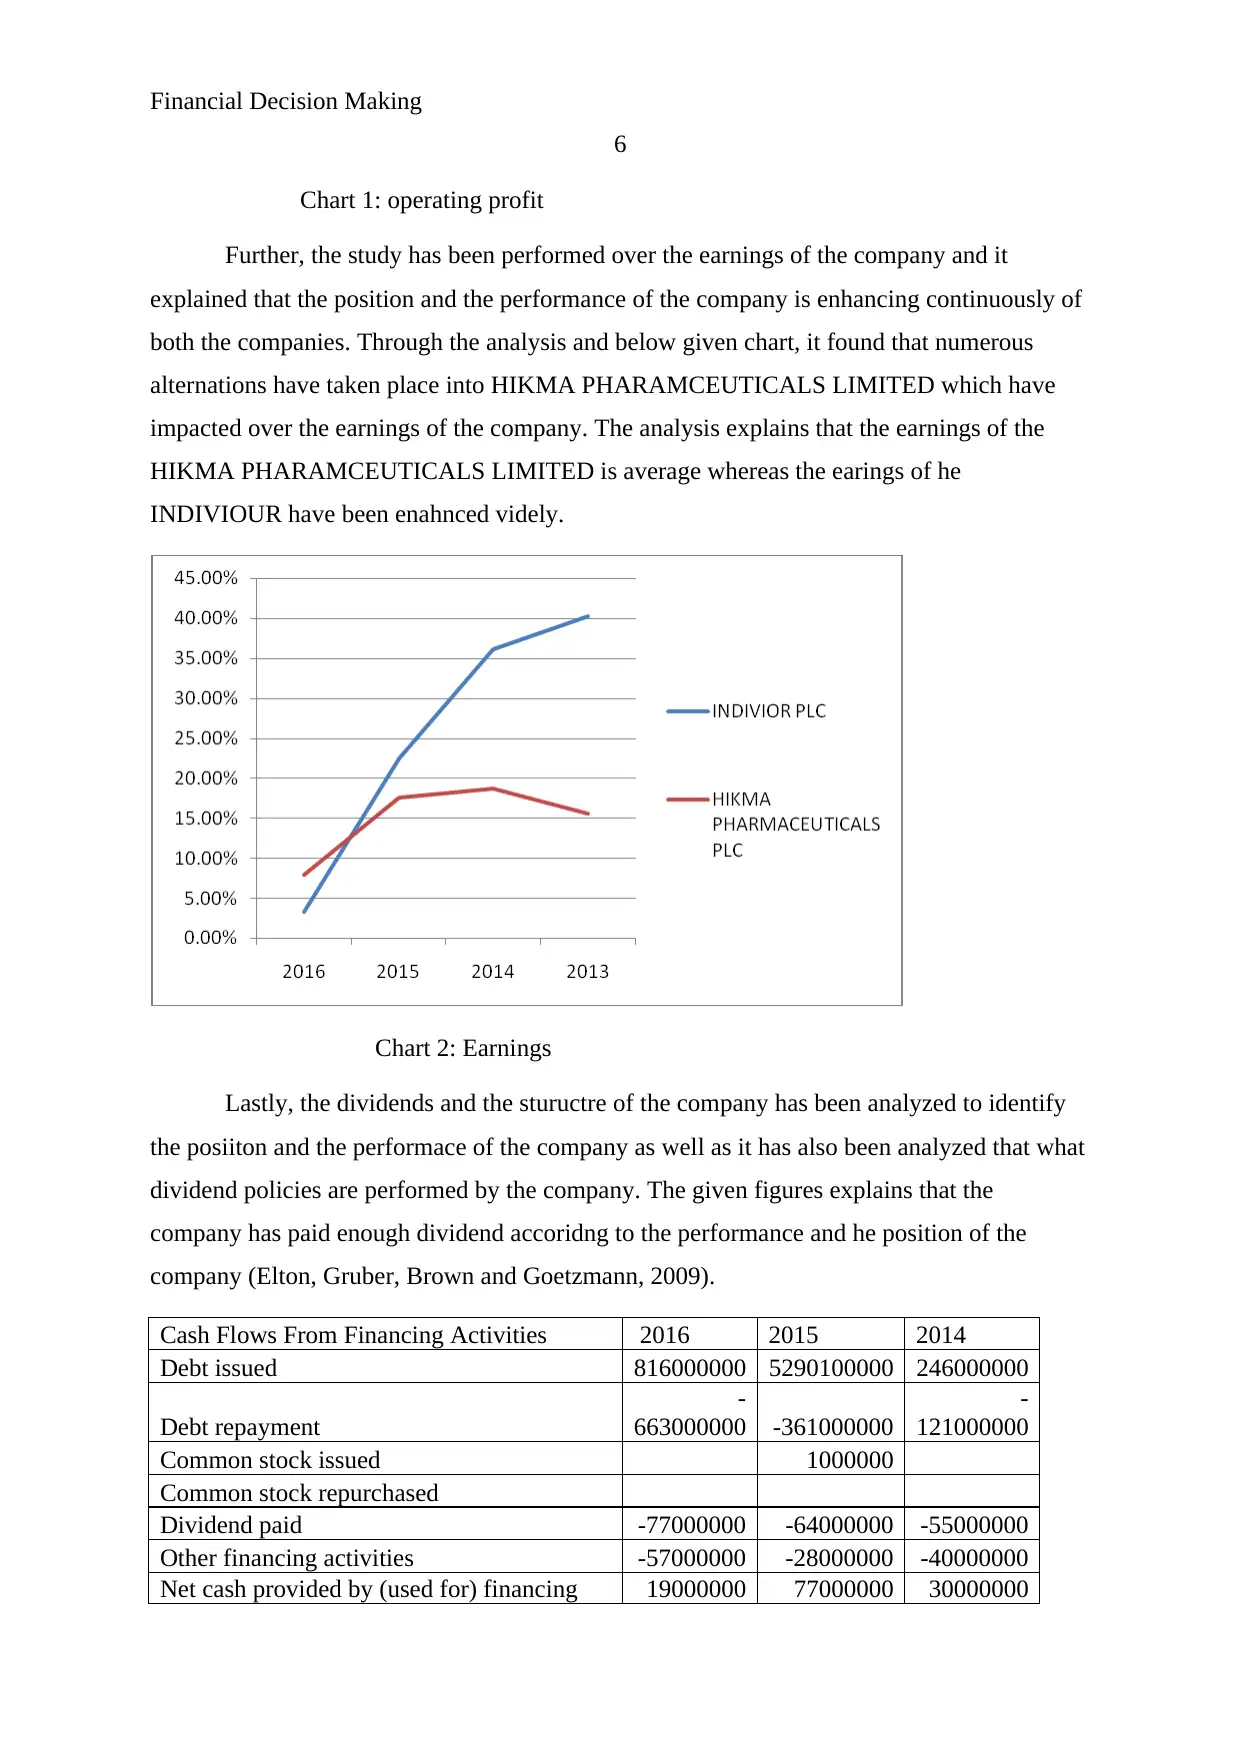
Chart 1: operating profit
Further, the study has been performed over the earnings of the company and it
explained that the position and the performance of the company is enhancing continuously of
both the companies. Through the analysis and below given chart, it found that numerous
alternations have taken place into HIKMA PHARAMCEUTICALS LIMITED which have
impacted over the earnings of the company. The analysis explains that the earnings of the
HIKMA PHARAMCEUTICALS LIMITED is average whereas the earings of he
INDIVIOUR have been enahnced videly.
Chart 2: Earnings
Lastly, the dividends and the stuructre of the company has been analyzed to identify
the posiiton and the performace of the company as well as it has also been analyzed that what
dividend policies are performed by the company. The given figures explains that the
company has paid enough dividend accoridng to the performance and he position of the
company (Elton, Gruber, Brown and Goetzmann, 2009).
Cash Flows From Financing Activities 2016 2015 2014
Debt issued 816000000 5290100000 246000000
Debt repayment
-
663000000 -361000000
-
121000000
Common stock issued 1000000
Common stock repurchased
Dividend paid -77000000 -64000000 -55000000
Other financing activities -57000000 -28000000 -40000000
Net cash provided by (used for) financing 19000000 77000000 30000000
6
Chart 1: operating profit
Further, the study has been performed over the earnings of the company and it
explained that the position and the performance of the company is enhancing continuously of
both the companies. Through the analysis and below given chart, it found that numerous
alternations have taken place into HIKMA PHARAMCEUTICALS LIMITED which have
impacted over the earnings of the company. The analysis explains that the earnings of the
HIKMA PHARAMCEUTICALS LIMITED is average whereas the earings of he
INDIVIOUR have been enahnced videly.
Chart 2: Earnings
Lastly, the dividends and the stuructre of the company has been analyzed to identify
the posiiton and the performace of the company as well as it has also been analyzed that what
dividend policies are performed by the company. The given figures explains that the
company has paid enough dividend accoridng to the performance and he position of the
company (Elton, Gruber, Brown and Goetzmann, 2009).
Cash Flows From Financing Activities 2016 2015 2014
Debt issued 816000000 5290100000 246000000
Debt repayment
-
663000000 -361000000
-
121000000
Common stock issued 1000000
Common stock repurchased
Dividend paid -77000000 -64000000 -55000000
Other financing activities -57000000 -28000000 -40000000
Net cash provided by (used for) financing 19000000 77000000 30000000
⊘ This is a preview!⊘
Do you want full access?
Subscribe today to unlock all pages.
Trusted by 1+ million students worldwide
Financial Decision Making
7
activities
According to the above evaluation and the study, it has been evaluated that the
HIKMA PHARAMCEUTICALS LIMITED is performing well in the market but the
increment rate of the company is bit lower than the other competetive comapnies. Current
report and financial data of the company explains that the cash flow position of the company
has been lower (Morningstar, 2018). Thus, it has been originated that company is required to
make various chnages such as invetsment into such opportunities where huge return could be
got and manage the cash flow in an efficienct way to become better in the market.
Financial stability and liquidity:
Further, the study has been performed over the financial data of the company of last 5
years to analyze and identify the position of the company in terms of liquidity and operations
of the company. Through the analysis and study, it has been originated that the liquid position
of the company has been changed in last 5 years. Through the analysis, it has also been found
that the current ratio position of the company has been entered and despite all the financial
crisis and fluctuations in the economy, HIKMA has managed to set a better position of the
liquidity of the company (Drury, 2013). Further, it has also been analyzed that the position of
the liquidity of the company is bit better than the position and liquidity performance of the
competitive company, currently, the current ratio of the company is 1.58 which depict that
the position is quite competitive and company is able to pay back all the debts at any time.
Paraphrase This Document
Need a fresh take? Get an instant paraphrase of this document with our AI Paraphraser
Financial Decision Making
8
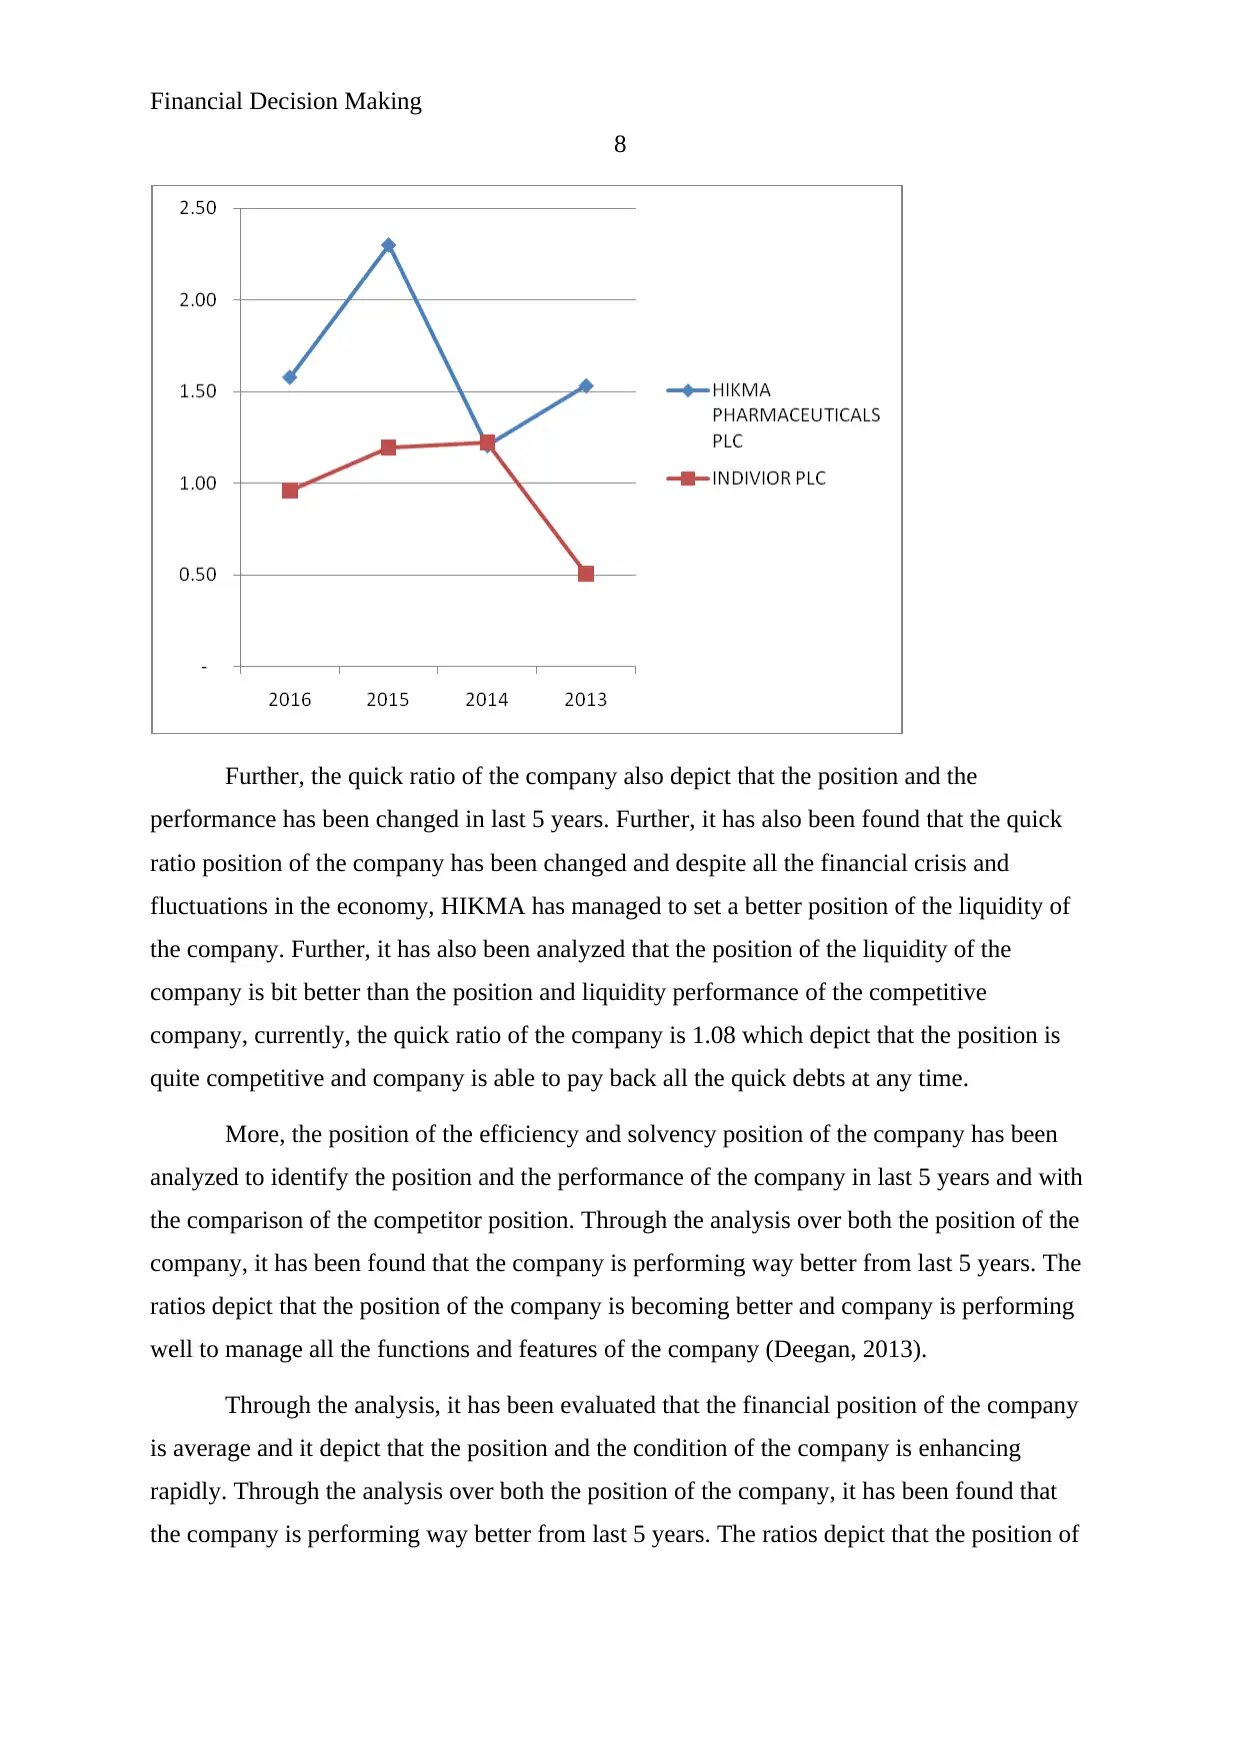
Further, the quick ratio of the company also depict that the position and the
performance has been changed in last 5 years. Further, it has also been found that the quick
ratio position of the company has been changed and despite all the financial crisis and
fluctuations in the economy, HIKMA has managed to set a better position of the liquidity of
the company. Further, it has also been analyzed that the position of the liquidity of the
company is bit better than the position and liquidity performance of the competitive
company, currently, the quick ratio of the company is 1.08 which depict that the position is
quite competitive and company is able to pay back all the quick debts at any time.
More, the position of the efficiency and solvency position of the company has been
analyzed to identify the position and the performance of the company in last 5 years and with
the comparison of the competitor position. Through the analysis over both the position of the
company, it has been found that the company is performing way better from last 5 years. The
ratios depict that the position of the company is becoming better and company is performing
well to manage all the functions and features of the company (Deegan, 2013).
Through the analysis, it has been evaluated that the financial position of the company
is average and it depict that the position and the condition of the company is enhancing
rapidly. Through the analysis over both the position of the company, it has been found that
the company is performing way better from last 5 years. The ratios depict that the position of
8
Further, the quick ratio of the company also depict that the position and the
performance has been changed in last 5 years. Further, it has also been found that the quick
ratio position of the company has been changed and despite all the financial crisis and
fluctuations in the economy, HIKMA has managed to set a better position of the liquidity of
the company. Further, it has also been analyzed that the position of the liquidity of the
company is bit better than the position and liquidity performance of the competitive
company, currently, the quick ratio of the company is 1.08 which depict that the position is
quite competitive and company is able to pay back all the quick debts at any time.
More, the position of the efficiency and solvency position of the company has been
analyzed to identify the position and the performance of the company in last 5 years and with
the comparison of the competitor position. Through the analysis over both the position of the
company, it has been found that the company is performing way better from last 5 years. The
ratios depict that the position of the company is becoming better and company is performing
well to manage all the functions and features of the company (Deegan, 2013).
Through the analysis, it has been evaluated that the financial position of the company
is average and it depict that the position and the condition of the company is enhancing
rapidly. Through the analysis over both the position of the company, it has been found that
the company is performing way better from last 5 years. The ratios depict that the position of
Financial Decision Making
9
the company is becoming better and company is performing well to manage all the functions
and features of the company.
A critical reflection on the company:
Further, the articles and news about the company has also been analyzed to identify
the position of the company in the market and various financial changes of the company.
According to the Morningstar (2017), this company is performing very well and in recent
years, various positive changes have taken place into the performance of the company.
Further, it has also been identified that the London stock exchange (2017) depict that the
company is depicting various good positions despite of the entire financial crisis situation and
the worst economic situation. According to the study of Deegan (2013), dividend payout
policies of the company are quite attractive and it attracts more investors to invest into the
market and enhance the position and the performance of the company.
More, Home (2017) depict that this company is performing its business into various
other countries as well t enhance the market share as well as the profitability position of the
company. The vision and the goals of the company depict that the company is required to
manage the strategic acquisition and the organic growth to manage and develop the business
and sustain the high level of responsibility and the ethics which are quite central to the
manner we administer (Morningstar, 2017). According to the financial statement of the
company, the position and the sales revenue of the company is enhancing rapidly and depicts
that the position of the company would be better in near future (Damodaran, 2011).
Corporate governance:
Further, the study has been done over the corporate governance policies of the
HIKMA PHARAMCEUTICALS LIMITED to analyze the psoition of the company in the
society as well as in the market. Through the report, it has been evaluated that the company is
having a great knowldgge and the strategies about the ethics, code of cnduct, quality services,
betteremnt of the society etc to manage the position of the company in the market. The vision
and the goals of the company depict that the company is required to manage the strategic
acquisition and the organic growth to manage and develop the business and sustain the high
level of responsibility and the ethics which are quite central to the manner we administer
(Damodaran, 2011).
⊘ This is a preview!⊘
Do you want full access?
Subscribe today to unlock all pages.
Trusted by 1+ million students worldwide
Financial Decision Making
10
According to the evaluation over the company, the comapny has never involved in
any such case in which the rights of the pubic or society get destroyed. The services and the
products of the company are very competitive and offer good health to the people. This
company take care the society in a good manner and follow all the rules and regulations of
the government to make a better society.
Asset price and evaluation:
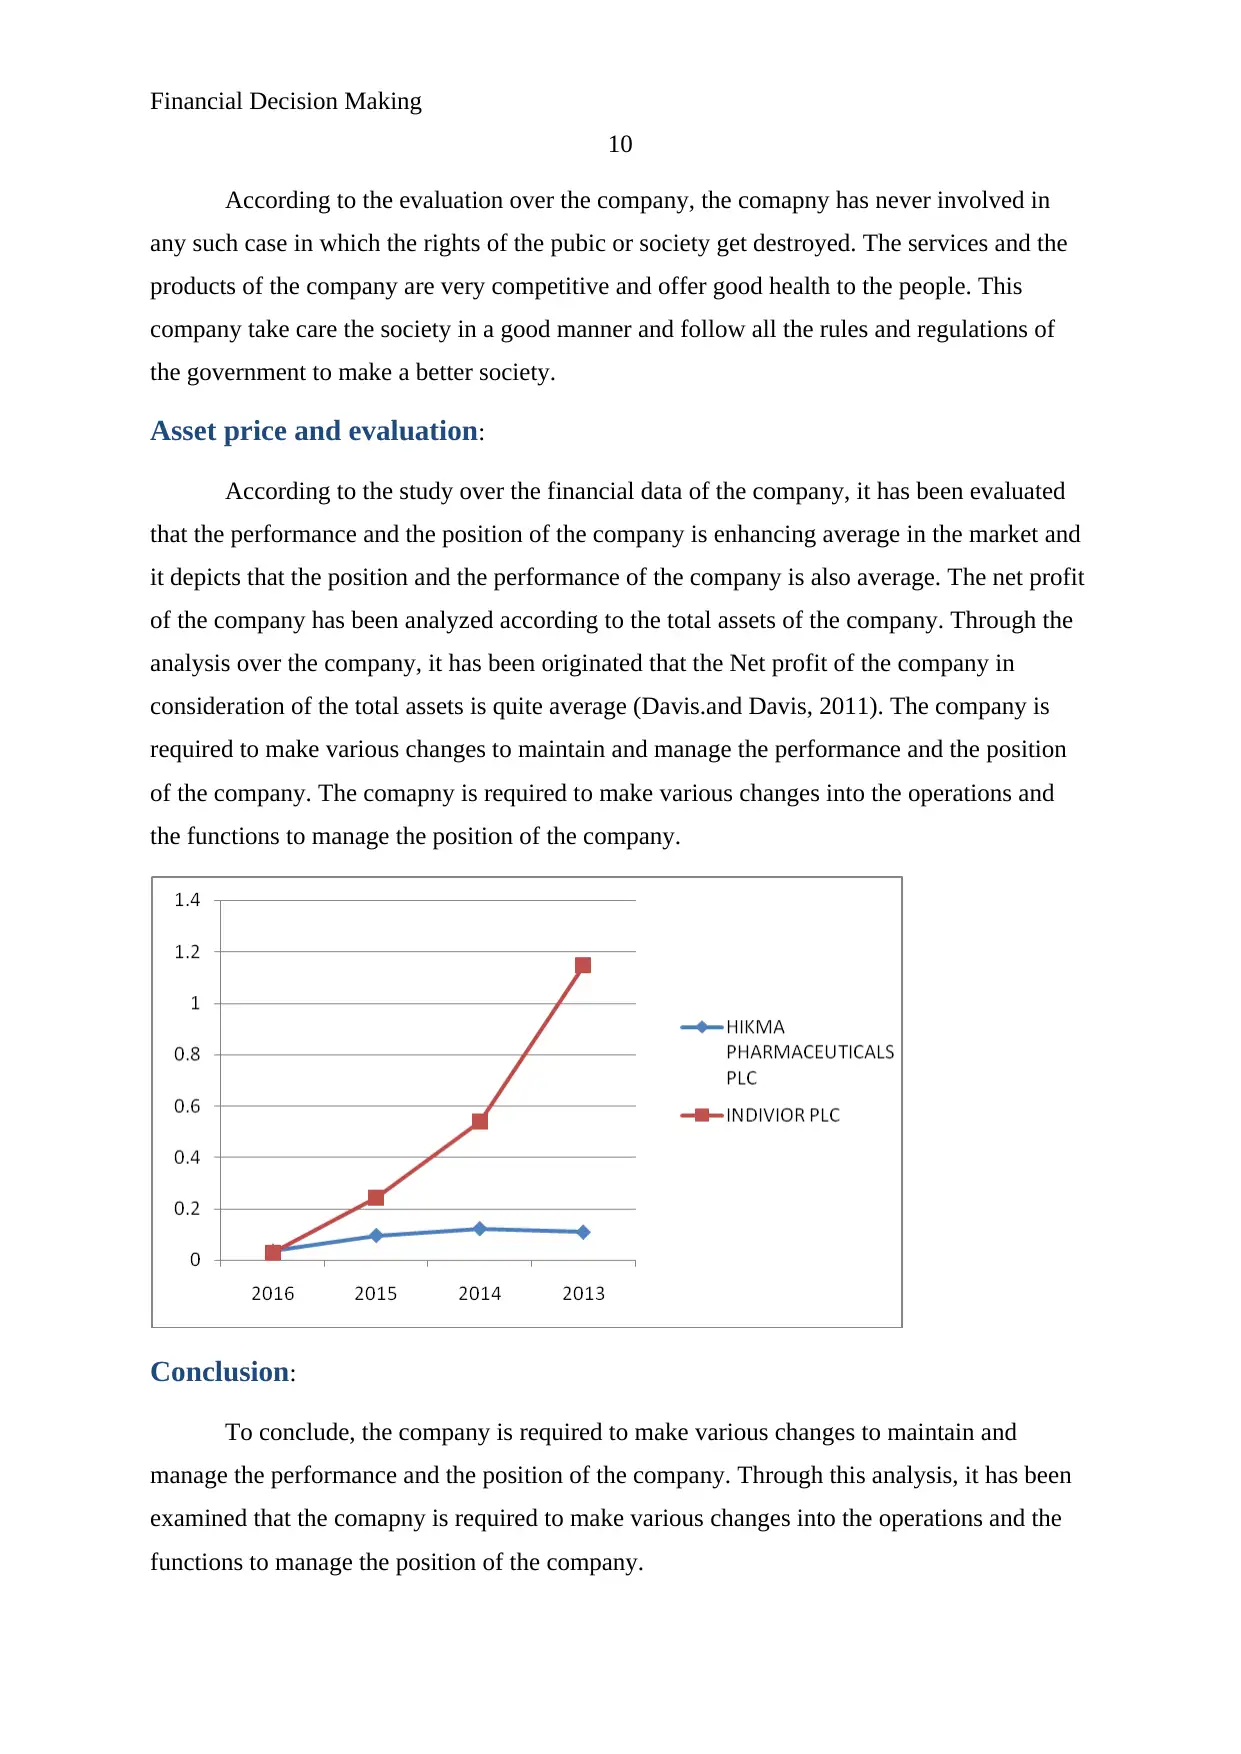
According to the study over the financial data of the company, it has been evaluated
that the performance and the position of the company is enhancing average in the market and
it depicts that the position and the performance of the company is also average. The net profit
of the company has been analyzed according to the total assets of the company. Through the
analysis over the company, it has been originated that the Net profit of the company in
consideration of the total assets is quite average (Davis.and Davis, 2011). The company is
required to make various changes to maintain and manage the performance and the position
of the company. The comapny is required to make various changes into the operations and
the functions to manage the position of the company.
Conclusion:
To conclude, the company is required to make various changes to maintain and
manage the performance and the position of the company. Through this analysis, it has been
examined that the comapny is required to make various changes into the operations and the
functions to manage the position of the company.
10
According to the evaluation over the company, the comapny has never involved in
any such case in which the rights of the pubic or society get destroyed. The services and the
products of the company are very competitive and offer good health to the people. This
company take care the society in a good manner and follow all the rules and regulations of
the government to make a better society.
Asset price and evaluation:
According to the study over the financial data of the company, it has been evaluated
that the performance and the position of the company is enhancing average in the market and
it depicts that the position and the performance of the company is also average. The net profit
of the company has been analyzed according to the total assets of the company. Through the
analysis over the company, it has been originated that the Net profit of the company in
consideration of the total assets is quite average (Davis.and Davis, 2011). The company is
required to make various changes to maintain and manage the performance and the position
of the company. The comapny is required to make various changes into the operations and
the functions to manage the position of the company.
Conclusion:
To conclude, the company is required to make various changes to maintain and
manage the performance and the position of the company. Through this analysis, it has been
examined that the comapny is required to make various changes into the operations and the
functions to manage the position of the company.
Paraphrase This Document
Need a fresh take? Get an instant paraphrase of this document with our AI Paraphraser
Financial Decision Making
11
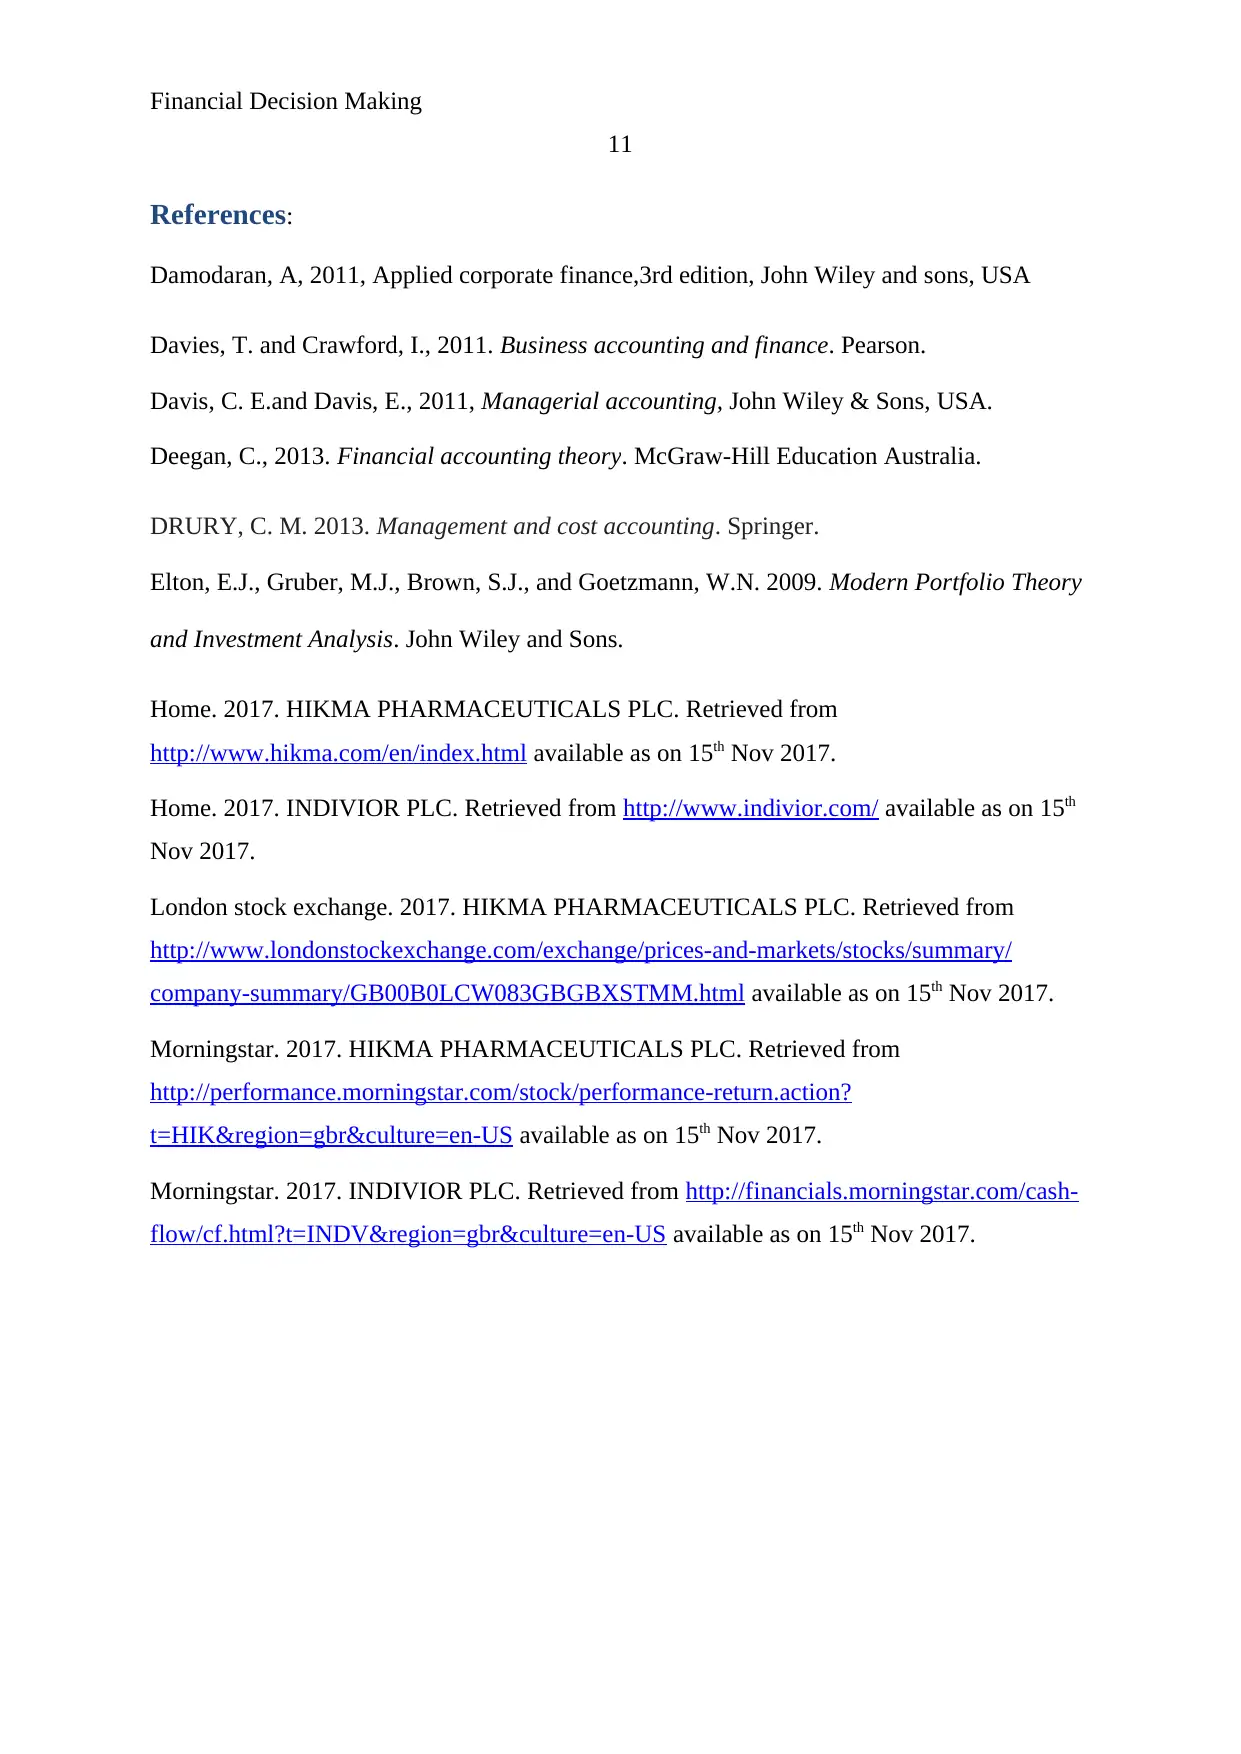
References:
Damodaran, A, 2011, Applied corporate finance,3rd edition, John Wiley and sons, USA
Davies, T. and Crawford, I., 2011. Business accounting and finance. Pearson.
Davis, C. E.and Davis, E., 2011, Managerial accounting, John Wiley & Sons, USA.
Deegan, C., 2013. Financial accounting theory. McGraw-Hill Education Australia.
DRURY, C. M. 2013. Management and cost accounting. Springer.
Elton, E.J., Gruber, M.J., Brown, S.J., and Goetzmann, W.N. 2009. Modern Portfolio Theory
and Investment Analysis. John Wiley and Sons.
Home. 2017. HIKMA PHARMACEUTICALS PLC. Retrieved from
http://www.hikma.com/en/index.html available as on 15th Nov 2017.
Home. 2017. INDIVIOR PLC. Retrieved from http://www.indivior.com/ available as on 15th
Nov 2017.
London stock exchange. 2017. HIKMA PHARMACEUTICALS PLC. Retrieved from
http://www.londonstockexchange.com/exchange/prices-and-markets/stocks/summary/
company-summary/GB00B0LCW083GBGBXSTMM.html available as on 15th Nov 2017.
Morningstar. 2017. HIKMA PHARMACEUTICALS PLC. Retrieved from
http://performance.morningstar.com/stock/performance-return.action?
t=HIK®ion=gbr&culture=en-US available as on 15th Nov 2017.
Morningstar. 2017. INDIVIOR PLC. Retrieved from http://financials.morningstar.com/cash-
flow/cf.html?t=INDV®ion=gbr&culture=en-US available as on 15th Nov 2017.
11
References:
Damodaran, A, 2011, Applied corporate finance,3rd edition, John Wiley and sons, USA
Davies, T. and Crawford, I., 2011. Business accounting and finance. Pearson.
Davis, C. E.and Davis, E., 2011, Managerial accounting, John Wiley & Sons, USA.
Deegan, C., 2013. Financial accounting theory. McGraw-Hill Education Australia.
DRURY, C. M. 2013. Management and cost accounting. Springer.
Elton, E.J., Gruber, M.J., Brown, S.J., and Goetzmann, W.N. 2009. Modern Portfolio Theory
and Investment Analysis. John Wiley and Sons.
Home. 2017. HIKMA PHARMACEUTICALS PLC. Retrieved from
http://www.hikma.com/en/index.html available as on 15th Nov 2017.
Home. 2017. INDIVIOR PLC. Retrieved from http://www.indivior.com/ available as on 15th
Nov 2017.
London stock exchange. 2017. HIKMA PHARMACEUTICALS PLC. Retrieved from
http://www.londonstockexchange.com/exchange/prices-and-markets/stocks/summary/
company-summary/GB00B0LCW083GBGBXSTMM.html available as on 15th Nov 2017.
Morningstar. 2017. HIKMA PHARMACEUTICALS PLC. Retrieved from
http://performance.morningstar.com/stock/performance-return.action?
t=HIK®ion=gbr&culture=en-US available as on 15th Nov 2017.
Morningstar. 2017. INDIVIOR PLC. Retrieved from http://financials.morningstar.com/cash-
flow/cf.html?t=INDV®ion=gbr&culture=en-US available as on 15th Nov 2017.
Financial Decision Making
12
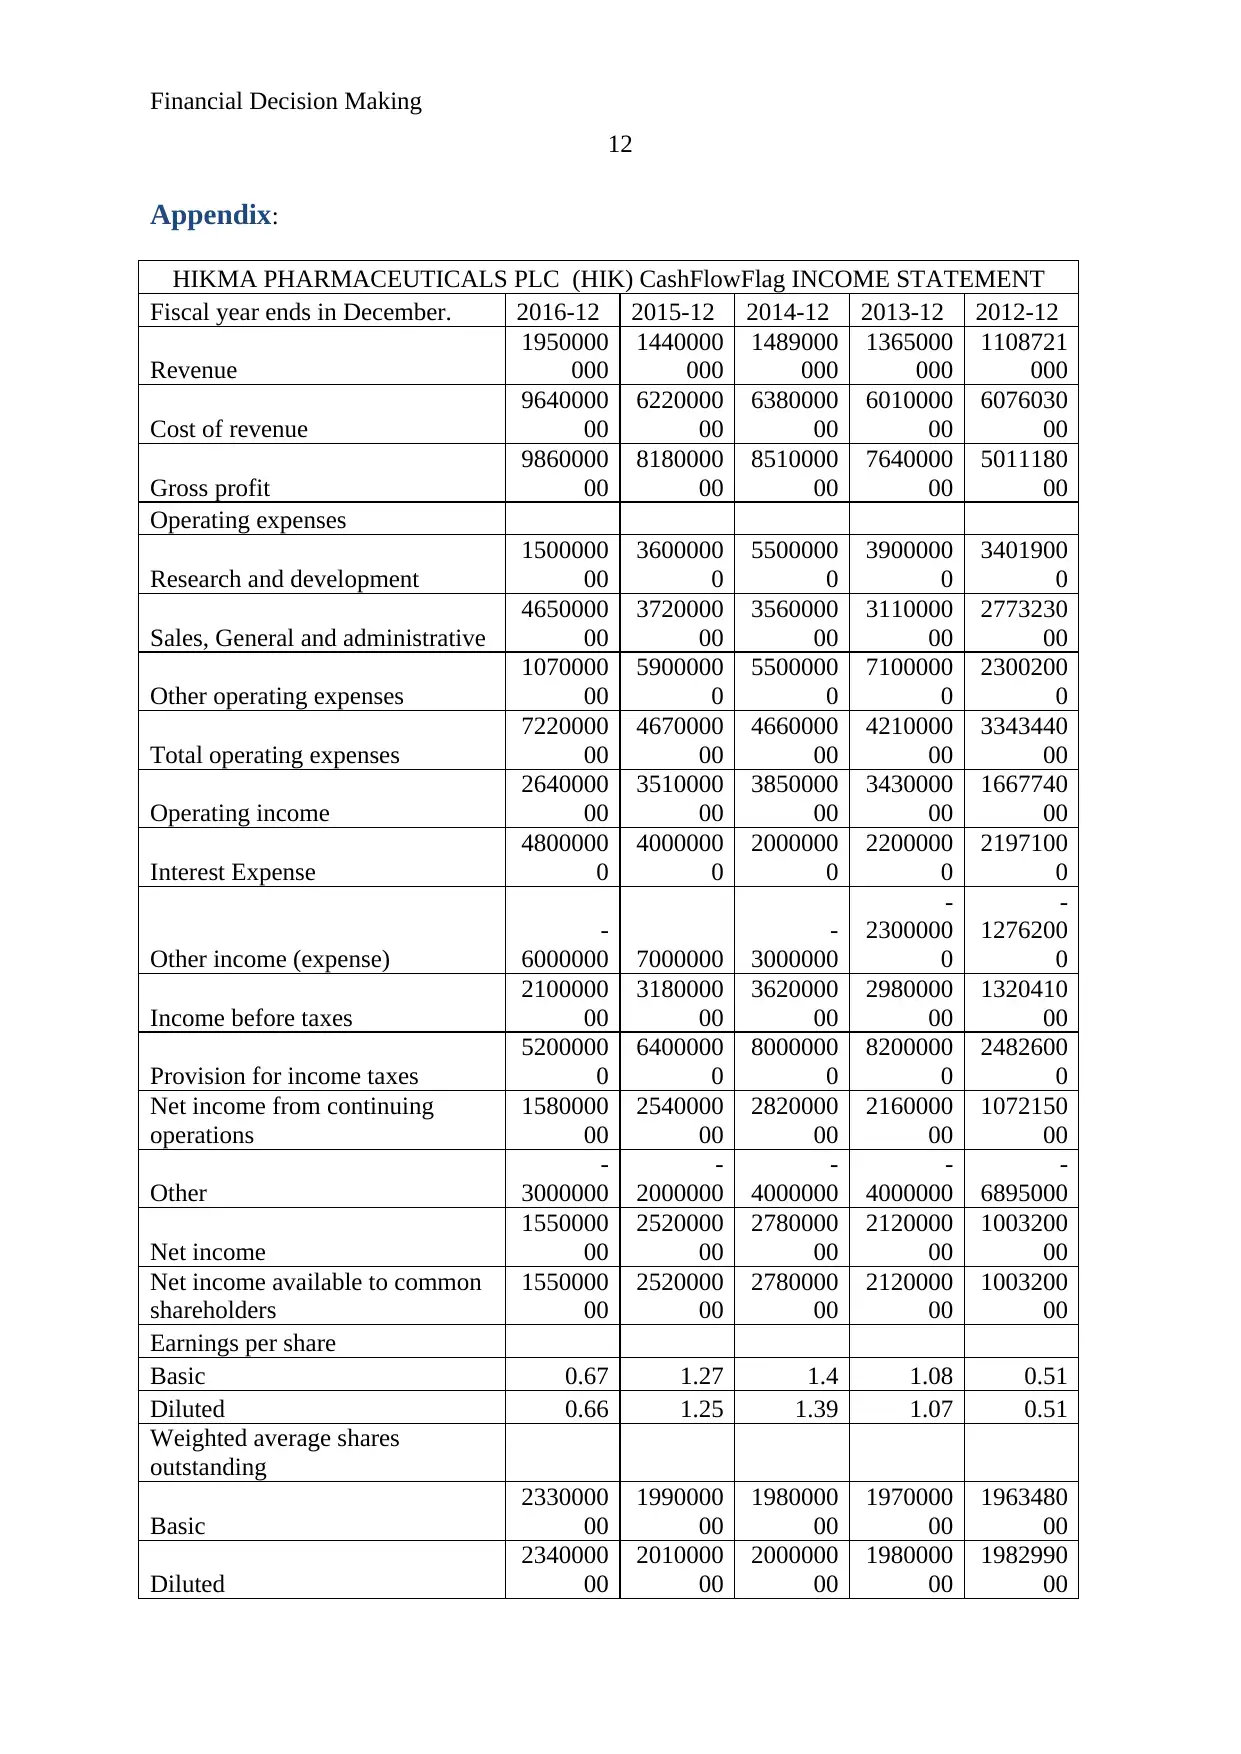
Appendix:
HIKMA PHARMACEUTICALS PLC (HIK) CashFlowFlag INCOME STATEMENT
Fiscal year ends in December. 2016-12 2015-12 2014-12 2013-12 2012-12
Revenue
1950000
000
1440000
000
1489000
000
1365000
000
1108721
000
Cost of revenue
9640000
00
6220000
00
6380000
00
6010000
00
6076030
00
Gross profit
9860000
00
8180000
00
8510000
00
7640000
00
5011180
00
Operating expenses
Research and development
1500000
00
3600000
0
5500000
0
3900000
0
3401900
0
Sales, General and administrative
4650000
00
3720000
00
3560000
00
3110000
00
2773230
00
Other operating expenses
1070000
00
5900000
0
5500000
0
7100000
0
2300200
0
Total operating expenses
7220000
00
4670000
00
4660000
00
4210000
00
3343440
00
Operating income
2640000
00
3510000
00
3850000
00
3430000
00
1667740
00
Interest Expense
4800000
0
4000000
0
2000000
0
2200000
0
2197100
0
Other income (expense)
-
6000000 7000000
-
3000000
-
2300000
0
-
1276200
0
Income before taxes
2100000
00
3180000
00
3620000
00
2980000
00
1320410
00
Provision for income taxes
5200000
0
6400000
0
8000000
0
8200000
0
2482600
0
Net income from continuing
operations
1580000
00
2540000
00
2820000
00
2160000
00
1072150
00
Other
-
3000000
-
2000000
-
4000000
-
4000000
-
6895000
Net income
1550000
00
2520000
00
2780000
00
2120000
00
1003200
00
Net income available to common
shareholders
1550000
00
2520000
00
2780000
00
2120000
00
1003200
00
Earnings per share
Basic 0.67 1.27 1.4 1.08 0.51
Diluted 0.66 1.25 1.39 1.07 0.51
Weighted average shares
outstanding
Basic
2330000
00
1990000
00
1980000
00
1970000
00
1963480
00
Diluted
2340000
00
2010000
00
2000000
00
1980000
00
1982990
00
12
Appendix:
HIKMA PHARMACEUTICALS PLC (HIK) CashFlowFlag INCOME STATEMENT
Fiscal year ends in December. 2016-12 2015-12 2014-12 2013-12 2012-12
Revenue
1950000
000
1440000
000
1489000
000
1365000
000
1108721
000
Cost of revenue
9640000
00
6220000
00
6380000
00
6010000
00
6076030
00
Gross profit
9860000
00
8180000
00
8510000
00
7640000
00
5011180
00
Operating expenses
Research and development
1500000
00
3600000
0
5500000
0
3900000
0
3401900
0
Sales, General and administrative
4650000
00
3720000
00
3560000
00
3110000
00
2773230
00
Other operating expenses
1070000
00
5900000
0
5500000
0
7100000
0
2300200
0
Total operating expenses
7220000
00
4670000
00
4660000
00
4210000
00
3343440
00
Operating income
2640000
00
3510000
00
3850000
00
3430000
00
1667740
00
Interest Expense
4800000
0
4000000
0
2000000
0
2200000
0
2197100
0
Other income (expense)
-
6000000 7000000
-
3000000
-
2300000
0
-
1276200
0
Income before taxes
2100000
00
3180000
00
3620000
00
2980000
00
1320410
00
Provision for income taxes
5200000
0
6400000
0
8000000
0
8200000
0
2482600
0
Net income from continuing
operations
1580000
00
2540000
00
2820000
00
2160000
00
1072150
00
Other
-
3000000
-
2000000
-
4000000
-
4000000
-
6895000
Net income
1550000
00
2520000
00
2780000
00
2120000
00
1003200
00
Net income available to common
shareholders
1550000
00
2520000
00
2780000
00
2120000
00
1003200
00
Earnings per share
Basic 0.67 1.27 1.4 1.08 0.51
Diluted 0.66 1.25 1.39 1.07 0.51
Weighted average shares
outstanding
Basic
2330000
00
1990000
00
1980000
00
1970000
00
1963480
00
Diluted
2340000
00
2010000
00
2000000
00
1980000
00
1982990
00
⊘ This is a preview!⊘
Do you want full access?
Subscribe today to unlock all pages.
Trusted by 1+ million students worldwide
1 out of 23
Related Documents


Your All-in-One AI-Powered Toolkit for Academic Success.
+13062052269
info@desklib.com
Available 24*7 on WhatsApp / Email
![[object Object]](/_next/static/media/star-bottom.7253800d.svg)
Unlock your academic potential
Copyright © 2020–2026 A2Z Services. All Rights Reserved. Developed and managed by ZUCOL.