Financial Analysis and Comparison of H&M and GAP: MBA Report
VerifiedAdded on 2022/11/28
|16
|3151
|442
Report
AI Summary
This report presents a financial analysis comparing the performance of two major companies, H&M and GAP. The analysis includes an introduction to the companies, followed by a critical comparison of their financial performance over several years. The core of the report focuses on a detailed examination of various financial ratios, including profitability ratios such as gross profit margin and net profit margin, liquidity ratios like the current ratio, and solvency ratios, specifically the debt-to-equity ratio. The report provides a five-year performance summary for both companies, utilizing tables and figures to illustrate trends. The analysis aims to assess the companies' financial health, efficiency, and ability to meet their obligations, ultimately leading to a conclusion regarding their investment potential. The study also addresses limitations and assumptions made during the analysis, providing a comprehensive overview of the financial standing of both companies.
Running head: FINANCIAL ANALYSIS
FINANCIAL ANALYSIS
Name of the Student
Name of the University
Author Note
FINANCIAL ANALYSIS
Name of the Student
Name of the University
Author Note
Paraphrase This Document
Need a fresh take? Get an instant paraphrase of this document with our AI Paraphraser
1FINANCIAL ANALYSIS
Table of Contents
Introduction......................................................................................................................................2
GAP.................................................................................................................................................2
H and M...........................................................................................................................................3
Critical comparison and financial performance over the last few years..........................................3
Profitability ratio..............................................................................................................................4
Gross Profit Margin.........................................................................................................................4
Net profit Margin.............................................................................................................................6
Liquidity..........................................................................................................................................7
Current Ratio...................................................................................................................................7
Solvency Ratios...............................................................................................................................9
Debt to Equity Ratio........................................................................................................................9
Earnings Per share.........................................................................................................................10
Choice of the company..................................................................................................................11
Problems, Limitations and assumptions which need to be undertaken.........................................12
Conclusion.....................................................................................................................................13
References......................................................................................................................................14
2FINANCIAL ANALYSIS
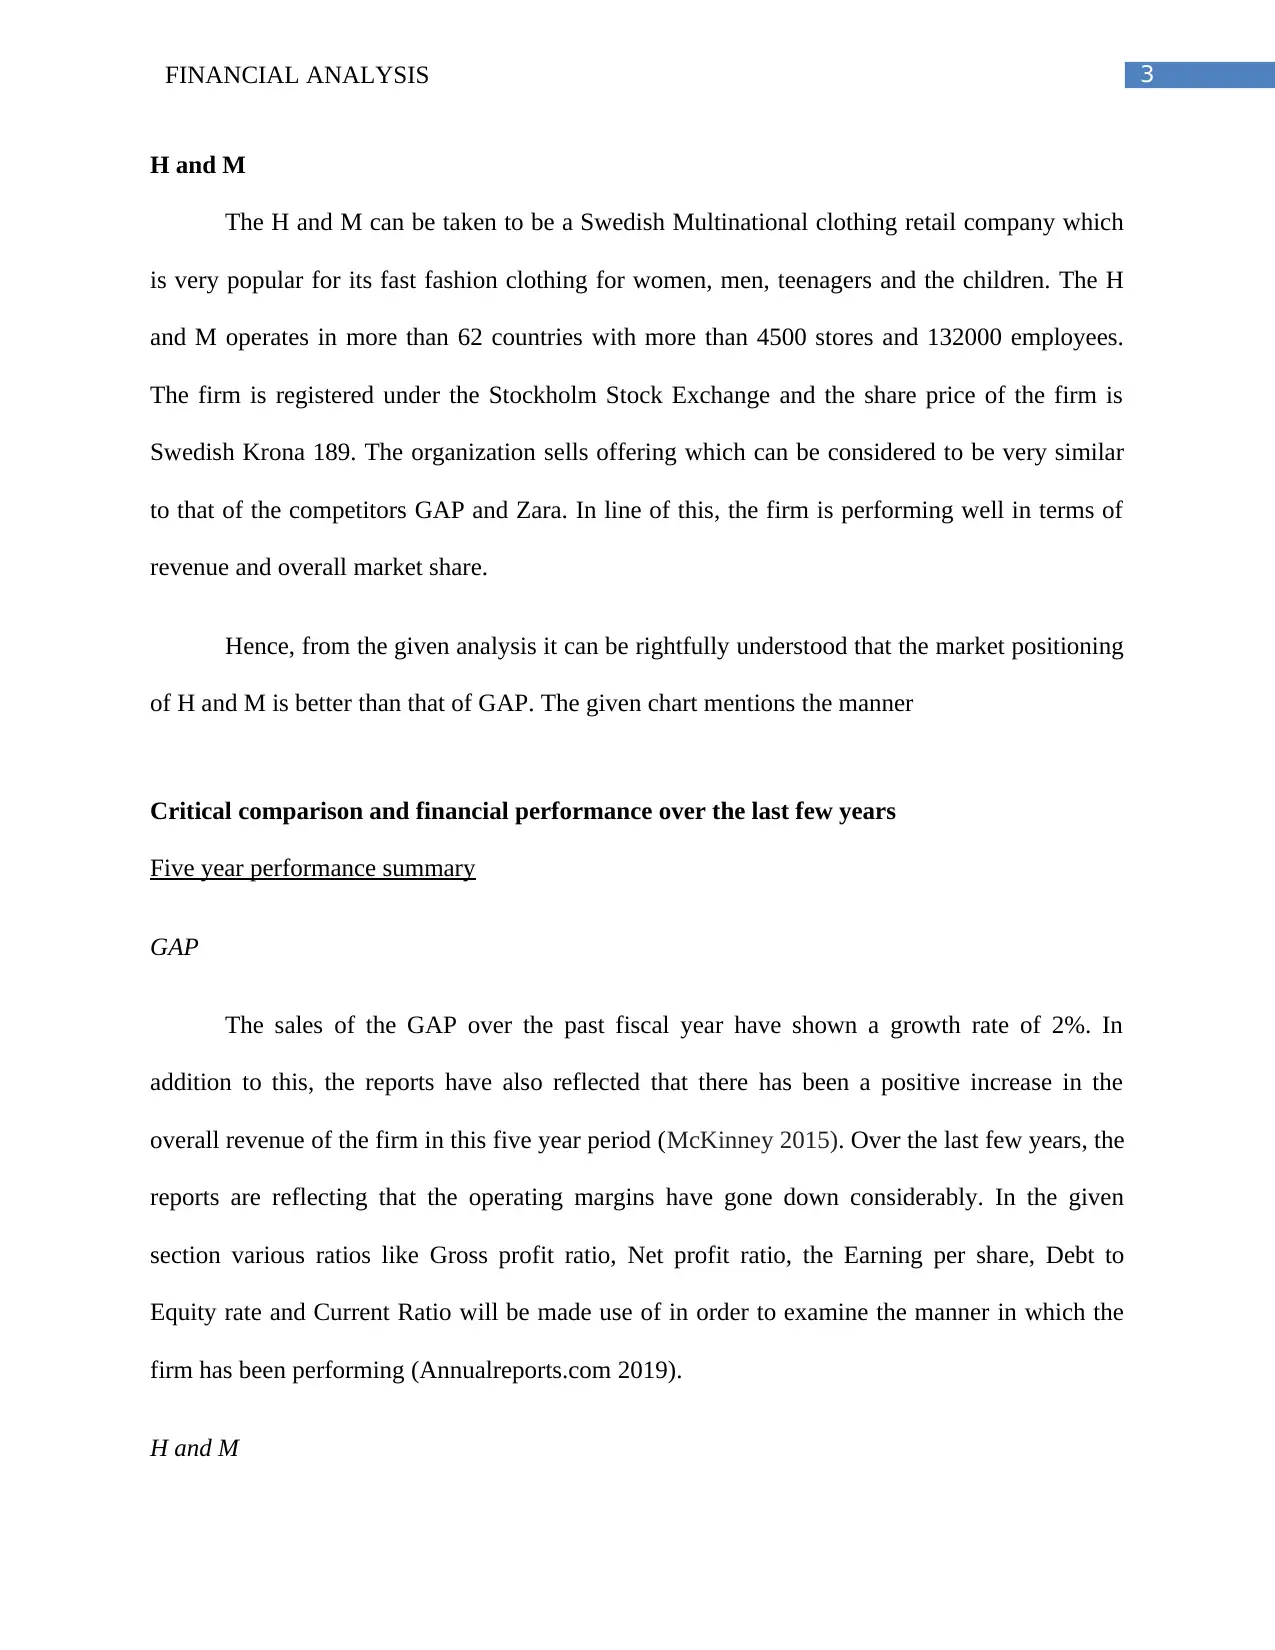
Introduction
In order to judge the firm regarding the overall facets of the organization, it can be
considered essentially crucial for the individual analyzing to see to it that, they are being able to
undertake a comprehensive analysis which will assist in determining how the firm is performing
(Bekaert and Hodrick 2017). The Ratio Analysis tends to serve as a manner in which the firm
will successfully be able to analyze its performance and determine the manner in which the firm
can improve its performance. Hence, in regard to this, the given section of the report will analyze
the financial performance of the two chosen companies named H and M and GAP which are
under globally registered stock exchange organizations and analyze the manner in which these
firms have been performing. Based on this analysis, a decision regarding the overall investment
in one of the companies will also be made. It needs to be noted that the major company has been
taken to be the GAP and the competitor is the H and M.
GAP
The GAP is an American worldwide clothing retailer which was found in 1969 by
Donald Fisher and Doris Fisherand is headquartered in California. The firm sells a large number
of products worldwide and has been performing considerably well over the last few years. The
firm is registered under the New York Stock Exchange and the share is priced at $17.19 as per
20th of September, 2019. The main competitors of the firm globally can be taken to be H and M
and Zara among others. The firm sells a large number of products like the kids clothing,
accessories, fashionable items and others. As compared to the competitor H and M, the firm is
performing below H and M.
⊘ This is a preview!⊘
Do you want full access?
Subscribe today to unlock all pages.
Trusted by 1+ million students worldwide
3FINANCIAL ANALYSIS
H and M
The H and M can be taken to be a Swedish Multinational clothing retail company which
is very popular for its fast fashion clothing for women, men, teenagers and the children. The H
and M operates in more than 62 countries with more than 4500 stores and 132000 employees.
The firm is registered under the Stockholm Stock Exchange and the share price of the firm is
Swedish Krona 189. The organization sells offering which can be considered to be very similar
to that of the competitors GAP and Zara. In line of this, the firm is performing well in terms of
revenue and overall market share.
Hence, from the given analysis it can be rightfully understood that the market positioning
of H and M is better than that of GAP. The given chart mentions the manner
Critical comparison and financial performance over the last few years
Five year performance summary
GAP
The sales of the GAP over the past fiscal year have shown a growth rate of 2%. In
addition to this, the reports have also reflected that there has been a positive increase in the
overall revenue of the firm in this five year period (McKinney 2015). Over the last few years, the
reports are reflecting that the operating margins have gone down considerably. In the given
section various ratios like Gross profit ratio, Net profit ratio, the Earning per share, Debt to
Equity rate and Current Ratio will be made use of in order to examine the manner in which the
firm has been performing (Annualreports.com 2019).
H and M
H and M
The H and M can be taken to be a Swedish Multinational clothing retail company which
is very popular for its fast fashion clothing for women, men, teenagers and the children. The H
and M operates in more than 62 countries with more than 4500 stores and 132000 employees.
The firm is registered under the Stockholm Stock Exchange and the share price of the firm is
Swedish Krona 189. The organization sells offering which can be considered to be very similar
to that of the competitors GAP and Zara. In line of this, the firm is performing well in terms of
revenue and overall market share.
Hence, from the given analysis it can be rightfully understood that the market positioning
of H and M is better than that of GAP. The given chart mentions the manner
Critical comparison and financial performance over the last few years
Five year performance summary
GAP
The sales of the GAP over the past fiscal year have shown a growth rate of 2%. In
addition to this, the reports have also reflected that there has been a positive increase in the
overall revenue of the firm in this five year period (McKinney 2015). Over the last few years, the
reports are reflecting that the operating margins have gone down considerably. In the given
section various ratios like Gross profit ratio, Net profit ratio, the Earning per share, Debt to
Equity rate and Current Ratio will be made use of in order to examine the manner in which the
firm has been performing (Annualreports.com 2019).
H and M
Paraphrase This Document
Need a fresh take? Get an instant paraphrase of this document with our AI Paraphraser
4FINANCIAL ANALYSIS
The H and M has improved its overall operations to a great extent. In line of this it can be
rightfully understood that the company has been able to expand into a greater number of
countries and this had not only lead to an increase in the overall operations of the country but in
addition to this, has also lead to an overall increase in the returns of the firm (Hm.com 2019).
The given section will examine the Net profit, gross profit and the current ratio along with the
debt to equity ratio so as to understand how the firm has been performing with respect to the
Profitability ratio
The profitability ratio is the metrics which help in assessing the overall ability of the
business with respect to the different profits which the firm would attain. The ratio helps in
assessing whether the firm is being able to earn adequate profits or not and also assists in
examining whether it will be able to engage in the competitive environment or not. The different
profitability ratios which are commonly used for the analysis are the Gross profit ratio and the
Net profit Ratio.
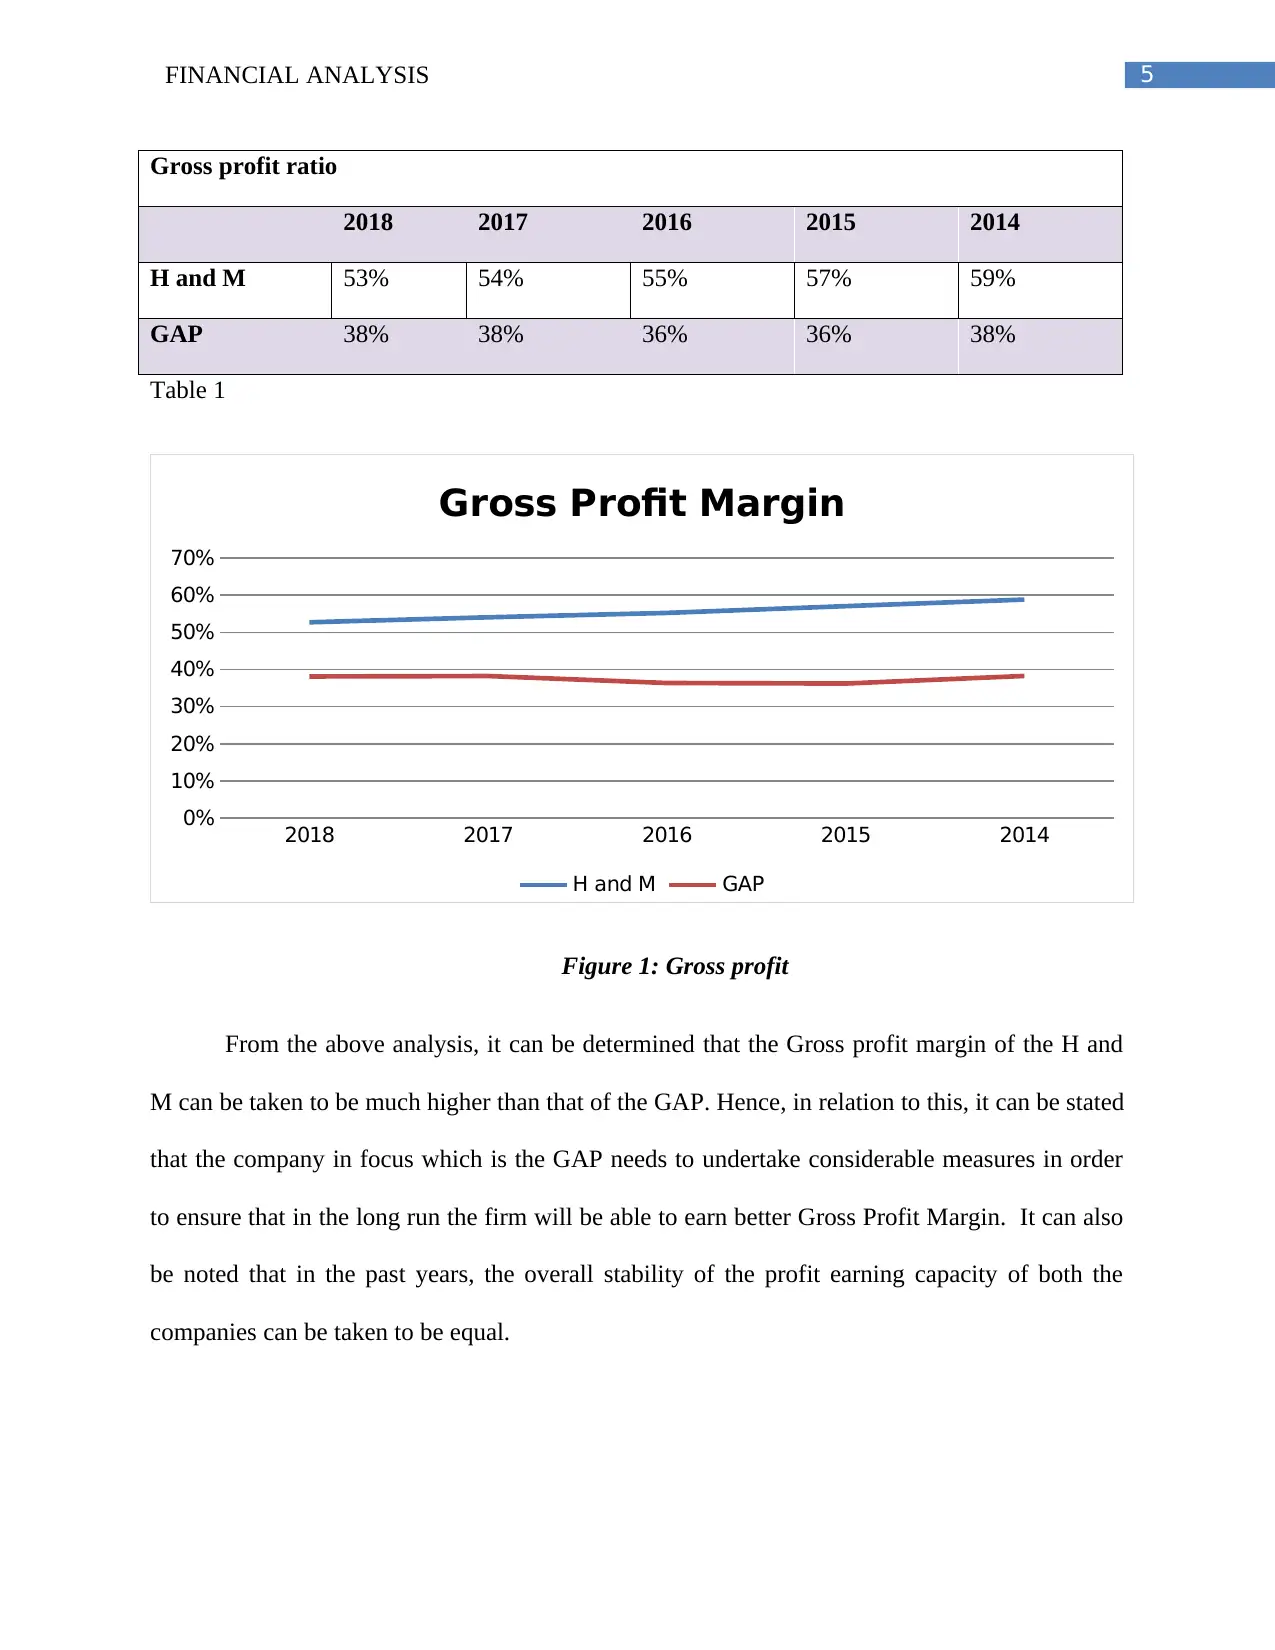
Gross Profit Margin
The gross profit margin also known as the gross margin can be understood to be the ratio
of gross margin which is expressed as a share of the sales of the firm. The gross margin
determines the extent of profit which is made by a firm after paying off the different cost of
goods sold. It helps in measuring the overall efficiency of the company which makes use of the
various raw materials and also determines the manner in which the firm is able to engage in long
term success (Ge and Weisbach 2019). The higher is the gross profit margin of the firm, the
better the company is performing. The formula for calculating the Gross profit margin of the firm
can be stated to be the gross profits of the firm divided by the Sales of the firm.
The H and M has improved its overall operations to a great extent. In line of this it can be
rightfully understood that the company has been able to expand into a greater number of
countries and this had not only lead to an increase in the overall operations of the country but in
addition to this, has also lead to an overall increase in the returns of the firm (Hm.com 2019).
The given section will examine the Net profit, gross profit and the current ratio along with the
debt to equity ratio so as to understand how the firm has been performing with respect to the
Profitability ratio
The profitability ratio is the metrics which help in assessing the overall ability of the
business with respect to the different profits which the firm would attain. The ratio helps in
assessing whether the firm is being able to earn adequate profits or not and also assists in
examining whether it will be able to engage in the competitive environment or not. The different
profitability ratios which are commonly used for the analysis are the Gross profit ratio and the
Net profit Ratio.
Gross Profit Margin
The gross profit margin also known as the gross margin can be understood to be the ratio
of gross margin which is expressed as a share of the sales of the firm. The gross margin
determines the extent of profit which is made by a firm after paying off the different cost of
goods sold. It helps in measuring the overall efficiency of the company which makes use of the
various raw materials and also determines the manner in which the firm is able to engage in long
term success (Ge and Weisbach 2019). The higher is the gross profit margin of the firm, the
better the company is performing. The formula for calculating the Gross profit margin of the firm
can be stated to be the gross profits of the firm divided by the Sales of the firm.
5FINANCIAL ANALYSIS
Gross profit ratio
2018 2017 2016 2015 2014
H and M 53% 54% 55% 57% 59%
GAP 38% 38% 36% 36% 38%
Table 1
2018 2017 2016 2015 2014
0%
10%
20%
30%
40%
50%
60%
70%
Gross Profit Margin
H and M GAP
Figure 1: Gross profit
From the above analysis, it can be determined that the Gross profit margin of the H and
M can be taken to be much higher than that of the GAP. Hence, in relation to this, it can be stated
that the company in focus which is the GAP needs to undertake considerable measures in order
to ensure that in the long run the firm will be able to earn better Gross Profit Margin. It can also
be noted that in the past years, the overall stability of the profit earning capacity of both the
companies can be taken to be equal.
⊘ This is a preview!⊘
Do you want full access?
Subscribe today to unlock all pages.
Trusted by 1+ million students worldwide
6FINANCIAL ANALYSIS
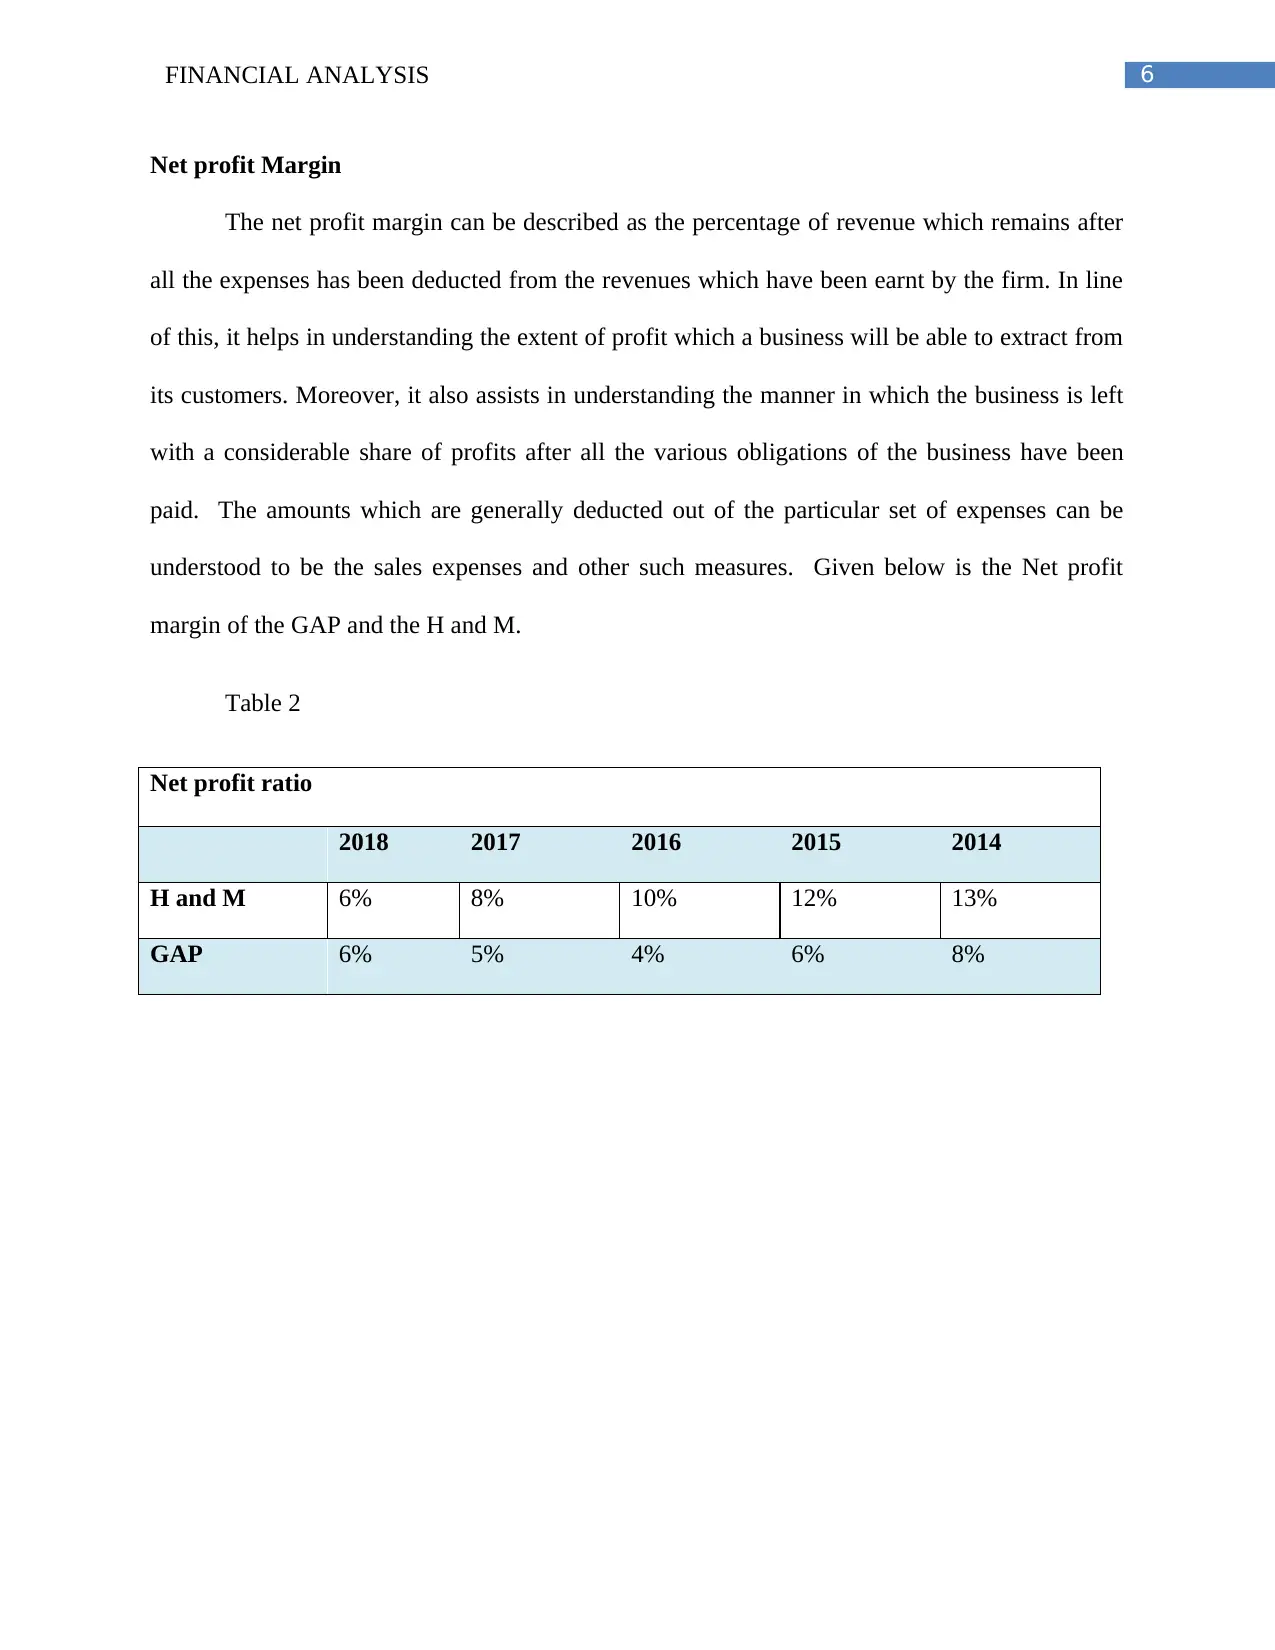
Net profit Margin
The net profit margin can be described as the percentage of revenue which remains after
all the expenses has been deducted from the revenues which have been earnt by the firm. In line
of this, it helps in understanding the extent of profit which a business will be able to extract from
its customers. Moreover, it also assists in understanding the manner in which the business is left
with a considerable share of profits after all the various obligations of the business have been
paid. The amounts which are generally deducted out of the particular set of expenses can be
understood to be the sales expenses and other such measures. Given below is the Net profit
margin of the GAP and the H and M.
Table 2
Net profit ratio
2018 2017 2016 2015 2014
H and M 6% 8% 10% 12% 13%
GAP 6% 5% 4% 6% 8%
Paraphrase This Document
Need a fresh take? Get an instant paraphrase of this document with our AI Paraphraser
7FINANCIAL ANALYSIS
2018 2017 2016 2015 2014
6%
8%
10%
12%
13%
6% 5% 4%
6%
8%
Net Profit Margin
H and M GAP
Figure 2: Net profit
From the given table and the figure, it can be observed that the Net profit margin of the H
and M can be understood to be considerably higher than that of the GAP. This means that the H
and M as a competitor has been performing considerably well and hence, with respect to this, it
can be rightfully mentioned that this performance has enabled the firm to expand its operations
in various parts of the country. In association of this, it can be mentioned that over the last few
years however, the net profit margin of the firm has been going down whereas the net profit
margin of GAP can be taken to be fairly stable. Therefore, in regard to this, it can be rightfully
mentioned that, stability is integral for any firm and as the overall profit of GAP is consistent, it
can be taken as a good sign.
Liquidity
The liquidity ratios act as an indicator of the fact whether the firm will be able to perform
well in the long run and assist in determining the overall ability of the firm to perform in the long
run (Mohanram, Saiy and Vyas 2018). It assists in ensuring whether the firm will be able to pay
8FINANCIAL ANALYSIS
off its debts in the long run or not. In line of this, it becomes very crucial for the firm to ensure
that it will be successfully able to attain a good competitive positioning or not. The liquidity ratio
which has been used here can be understood to be the Current Ratio.
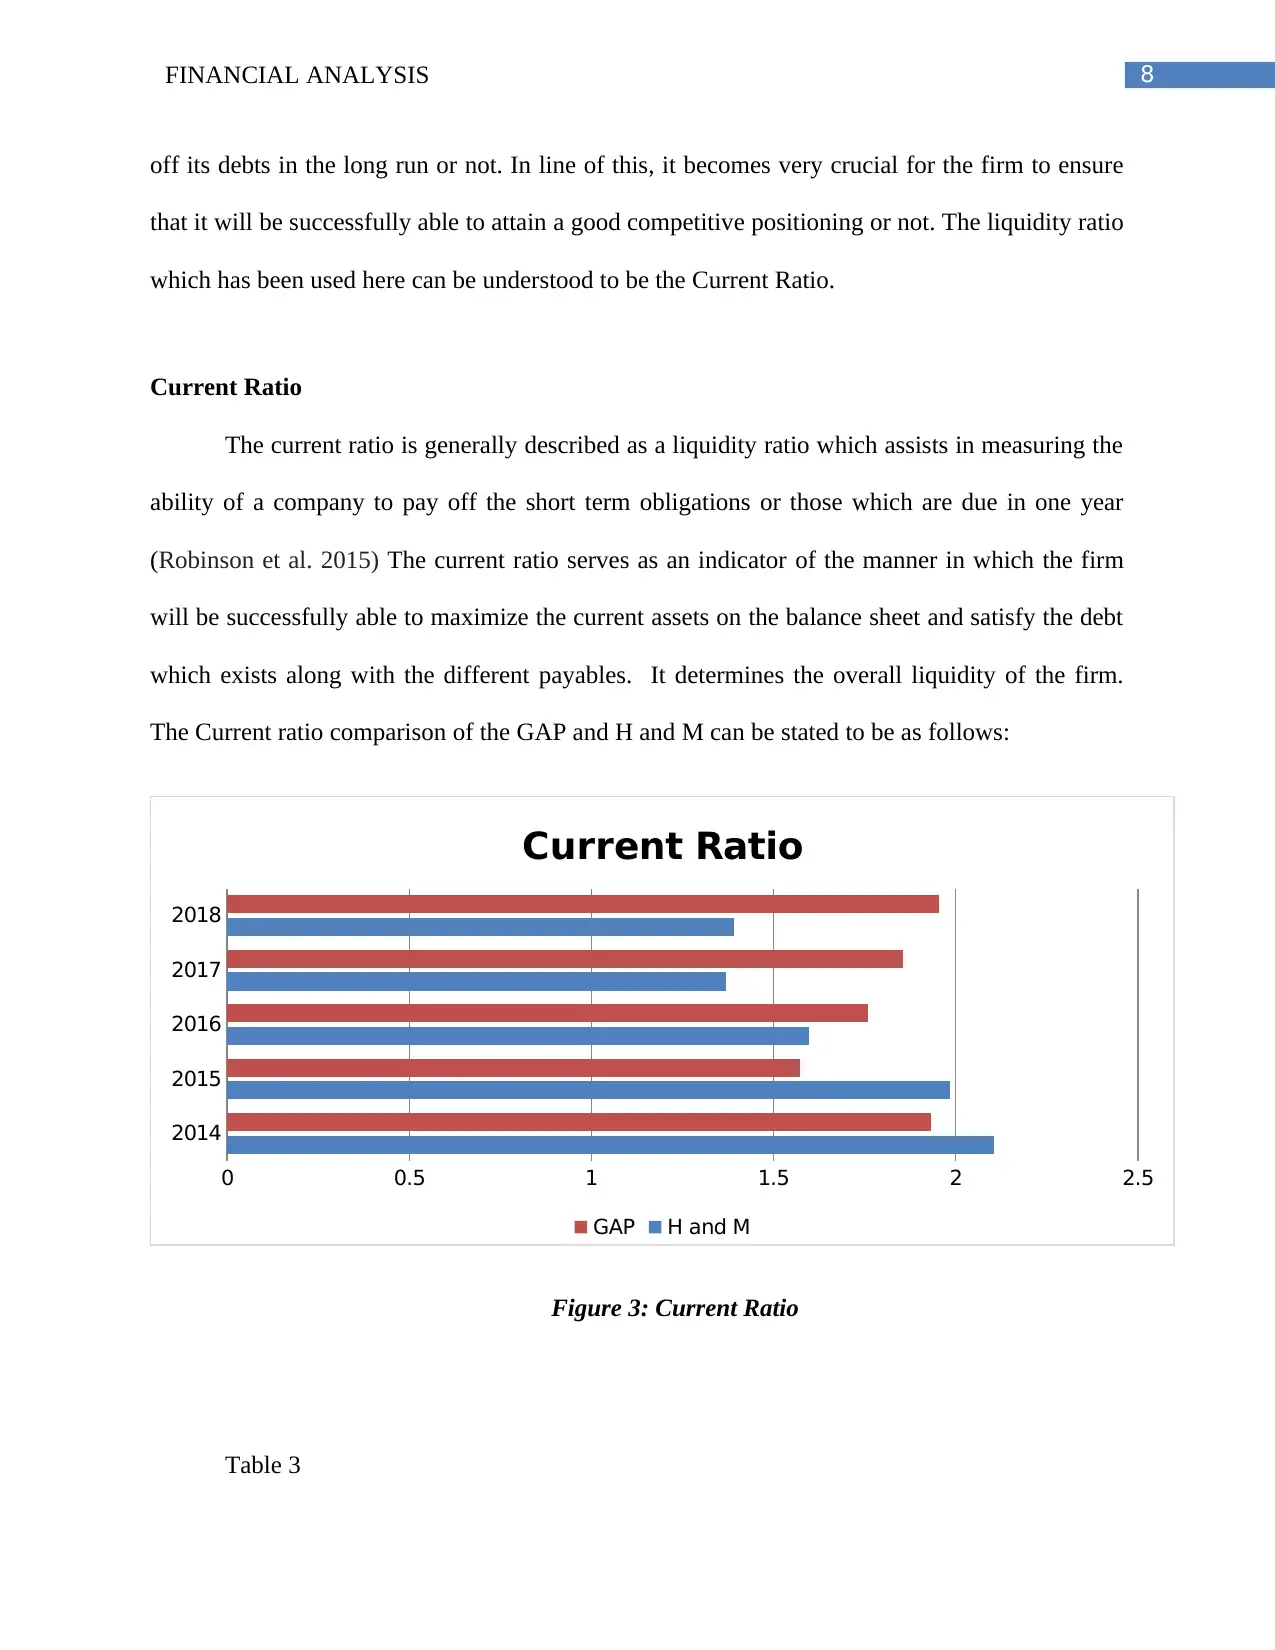
Current Ratio
The current ratio is generally described as a liquidity ratio which assists in measuring the
ability of a company to pay off the short term obligations or those which are due in one year
(Robinson et al. 2015) The current ratio serves as an indicator of the manner in which the firm
will be successfully able to maximize the current assets on the balance sheet and satisfy the debt
which exists along with the different payables. It determines the overall liquidity of the firm.
The Current ratio comparison of the GAP and H and M can be stated to be as follows:
2014
2015
2016
2017
2018
0 0.5 1 1.5 2 2.5
Current Ratio
GAP H and M
Figure 3: Current Ratio
Table 3
off its debts in the long run or not. In line of this, it becomes very crucial for the firm to ensure
that it will be successfully able to attain a good competitive positioning or not. The liquidity ratio
which has been used here can be understood to be the Current Ratio.
Current Ratio
The current ratio is generally described as a liquidity ratio which assists in measuring the
ability of a company to pay off the short term obligations or those which are due in one year
(Robinson et al. 2015) The current ratio serves as an indicator of the manner in which the firm
will be successfully able to maximize the current assets on the balance sheet and satisfy the debt
which exists along with the different payables. It determines the overall liquidity of the firm.
The Current ratio comparison of the GAP and H and M can be stated to be as follows:
2014
2015
2016
2017
2018
0 0.5 1 1.5 2 2.5
Current Ratio
GAP H and M
Figure 3: Current Ratio
Table 3
⊘ This is a preview!⊘
Do you want full access?
Subscribe today to unlock all pages.
Trusted by 1+ million students worldwide
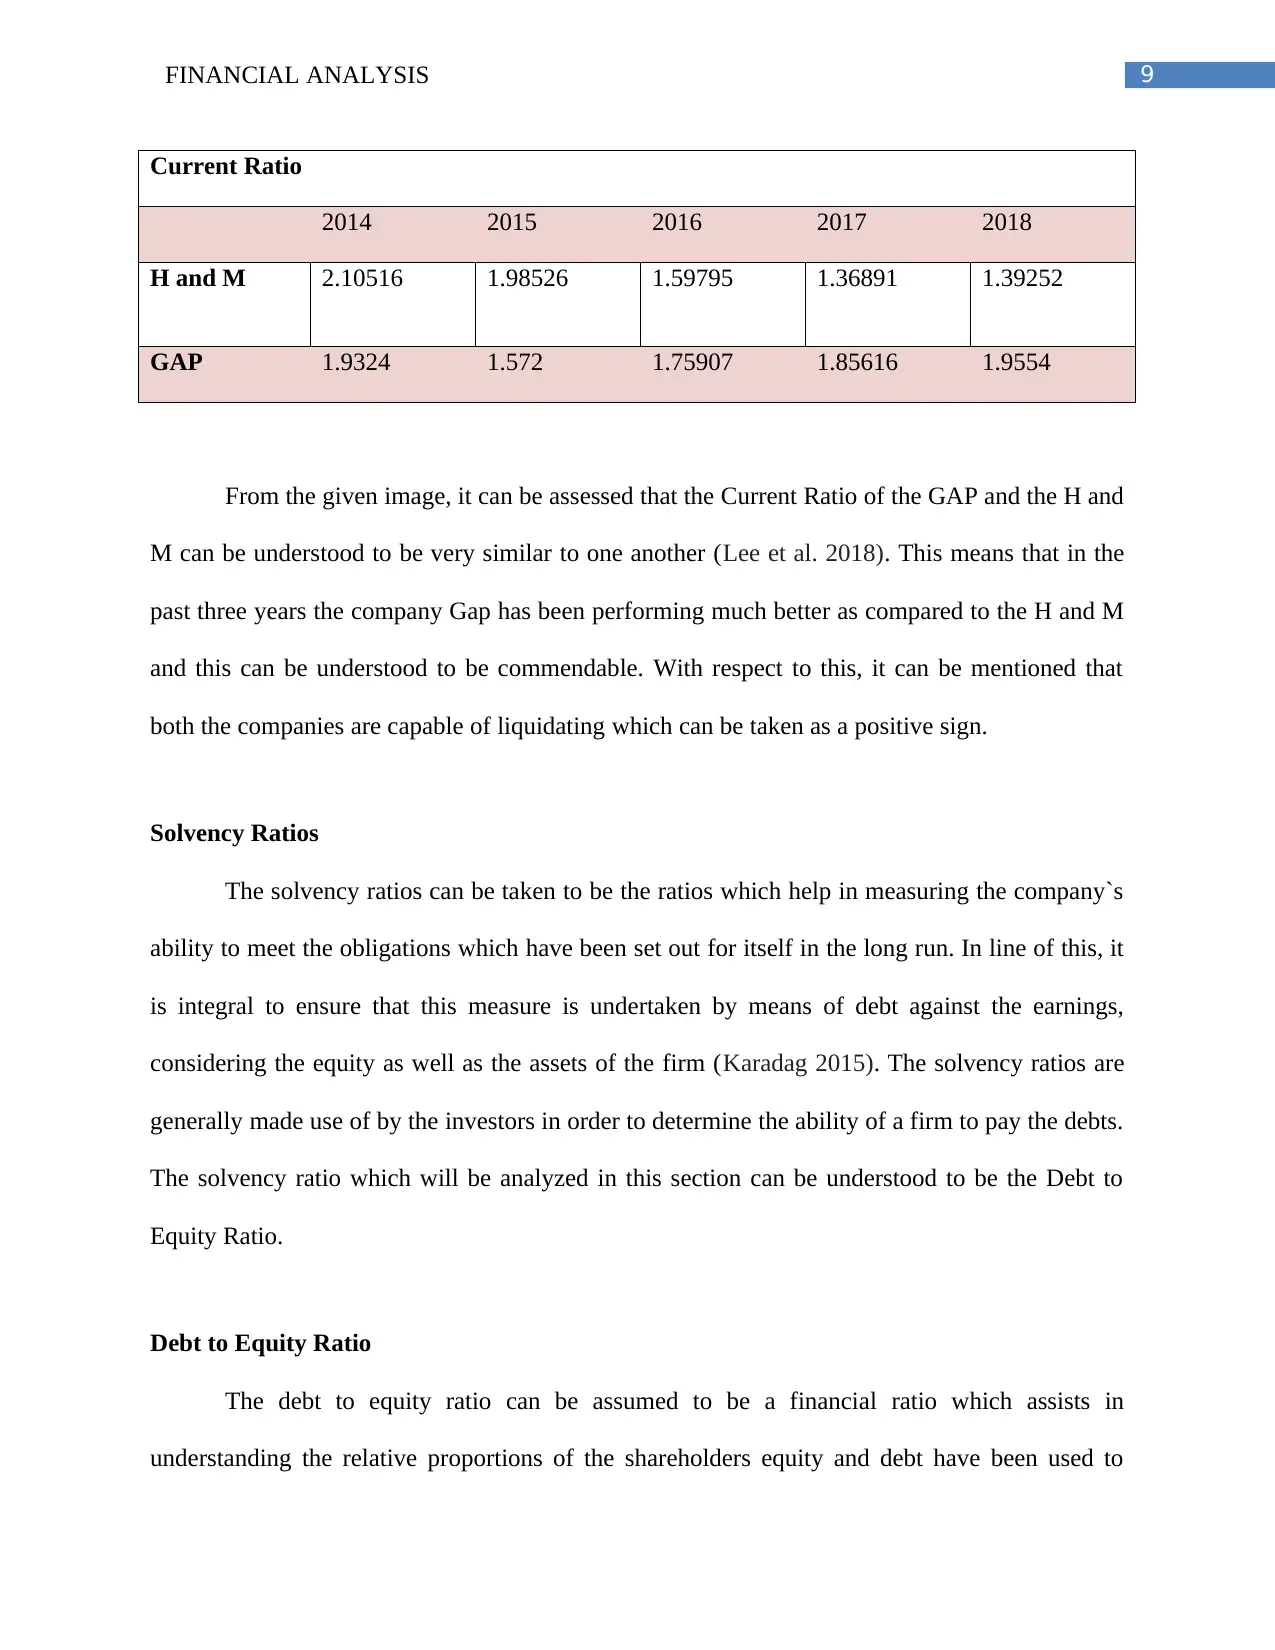
9FINANCIAL ANALYSIS
Current Ratio
2014 2015 2016 2017 2018
H and M 2.10516 1.98526 1.59795 1.36891 1.39252
GAP 1.9324 1.572 1.75907 1.85616 1.9554
From the given image, it can be assessed that the Current Ratio of the GAP and the H and
M can be understood to be very similar to one another (Lee et al. 2018). This means that in the
past three years the company Gap has been performing much better as compared to the H and M
and this can be understood to be commendable. With respect to this, it can be mentioned that
both the companies are capable of liquidating which can be taken as a positive sign.
Solvency Ratios
The solvency ratios can be taken to be the ratios which help in measuring the company`s
ability to meet the obligations which have been set out for itself in the long run. In line of this, it
is integral to ensure that this measure is undertaken by means of debt against the earnings,
considering the equity as well as the assets of the firm (Karadag 2015). The solvency ratios are
generally made use of by the investors in order to determine the ability of a firm to pay the debts.
The solvency ratio which will be analyzed in this section can be understood to be the Debt to
Equity Ratio.
Debt to Equity Ratio
The debt to equity ratio can be assumed to be a financial ratio which assists in
understanding the relative proportions of the shareholders equity and debt have been used to
Current Ratio
2014 2015 2016 2017 2018
H and M 2.10516 1.98526 1.59795 1.36891 1.39252
GAP 1.9324 1.572 1.75907 1.85616 1.9554
From the given image, it can be assessed that the Current Ratio of the GAP and the H and
M can be understood to be very similar to one another (Lee et al. 2018). This means that in the
past three years the company Gap has been performing much better as compared to the H and M
and this can be understood to be commendable. With respect to this, it can be mentioned that
both the companies are capable of liquidating which can be taken as a positive sign.
Solvency Ratios
The solvency ratios can be taken to be the ratios which help in measuring the company`s
ability to meet the obligations which have been set out for itself in the long run. In line of this, it
is integral to ensure that this measure is undertaken by means of debt against the earnings,
considering the equity as well as the assets of the firm (Karadag 2015). The solvency ratios are
generally made use of by the investors in order to determine the ability of a firm to pay the debts.
The solvency ratio which will be analyzed in this section can be understood to be the Debt to
Equity Ratio.
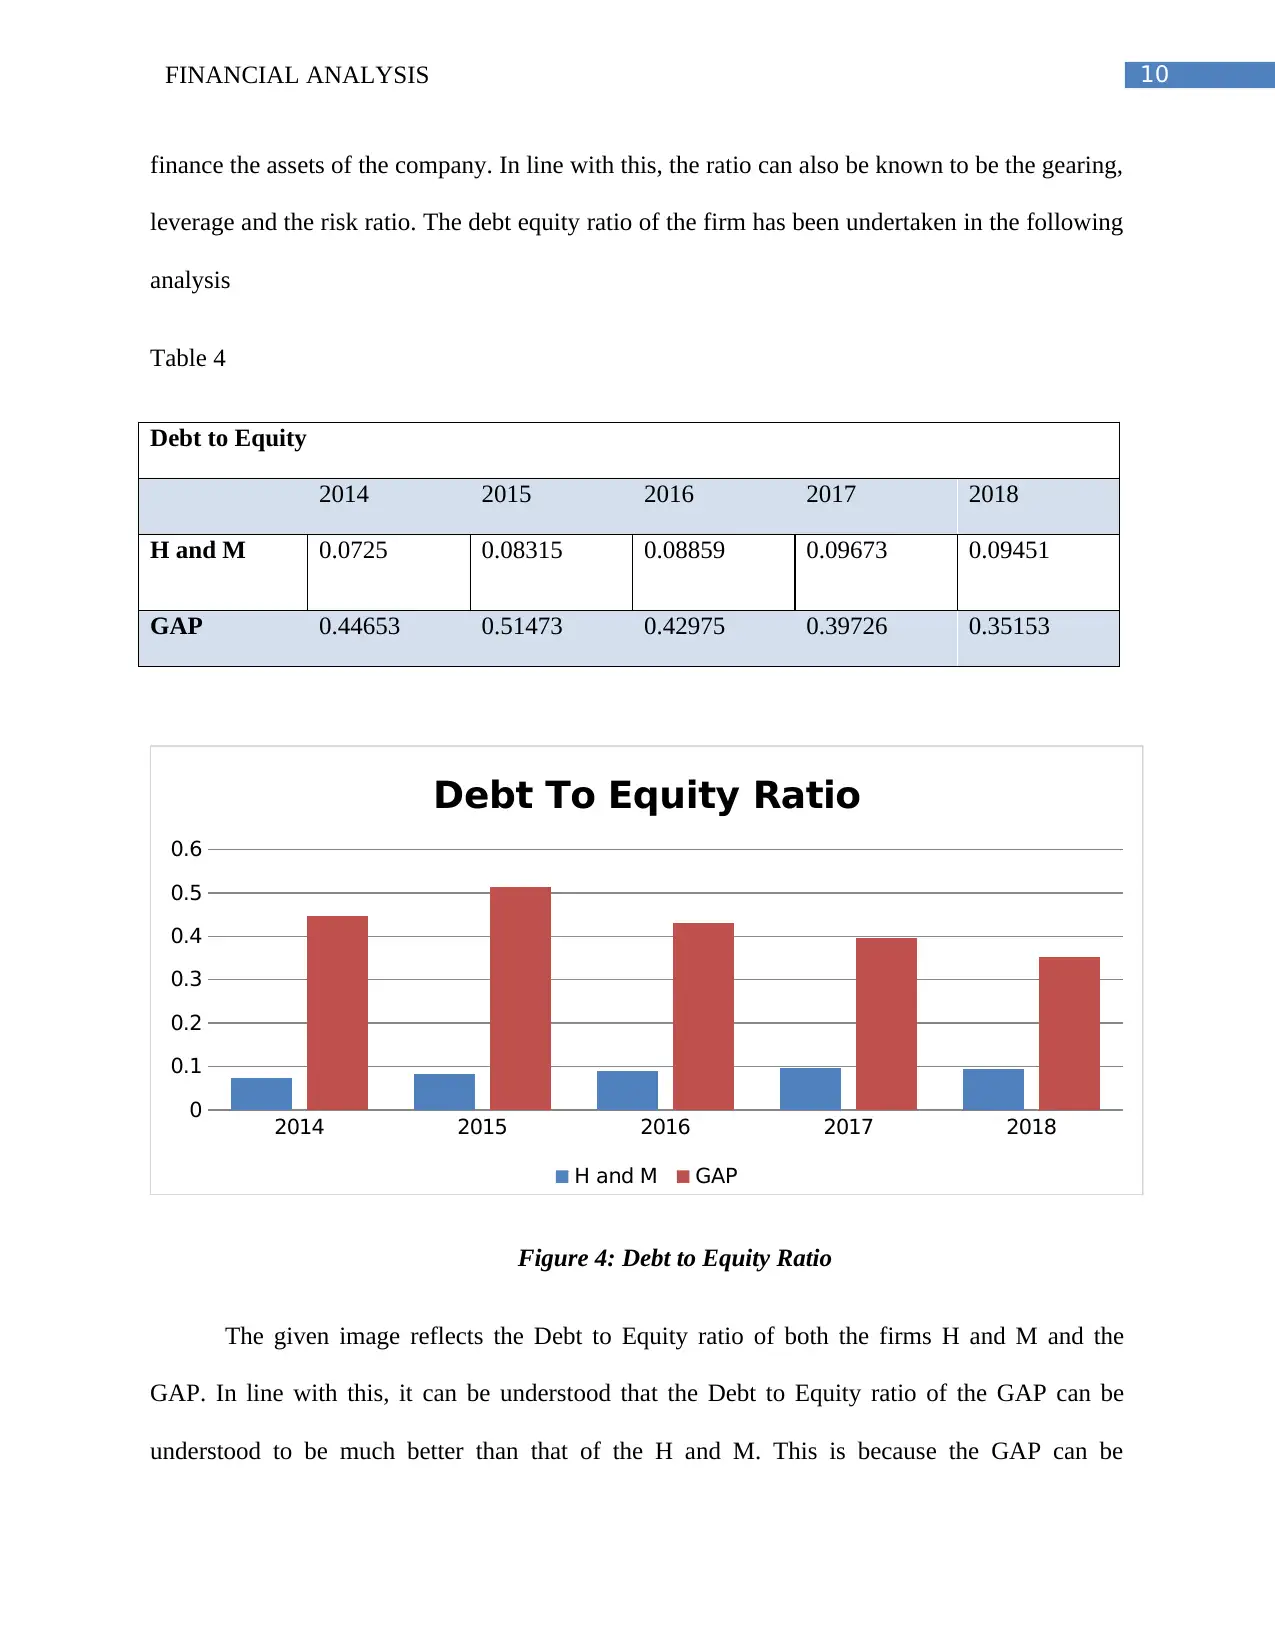
Debt to Equity Ratio
The debt to equity ratio can be assumed to be a financial ratio which assists in
understanding the relative proportions of the shareholders equity and debt have been used to
Paraphrase This Document
Need a fresh take? Get an instant paraphrase of this document with our AI Paraphraser
10FINANCIAL ANALYSIS
finance the assets of the company. In line with this, the ratio can also be known to be the gearing,
leverage and the risk ratio. The debt equity ratio of the firm has been undertaken in the following
analysis
Table 4
Debt to Equity
2014 2015 2016 2017 2018
H and M 0.0725 0.08315 0.08859 0.09673 0.09451
GAP 0.44653 0.51473 0.42975 0.39726 0.35153
2014 2015 2016 2017 2018
0
0.1
0.2
0.3
0.4
0.5
0.6
Debt To Equity Ratio
H and M GAP
Figure 4: Debt to Equity Ratio
The given image reflects the Debt to Equity ratio of both the firms H and M and the
GAP. In line with this, it can be understood that the Debt to Equity ratio of the GAP can be
understood to be much better than that of the H and M. This is because the GAP can be
11FINANCIAL ANALYSIS
understood to be managing its overall finances very well (Zietlow et al. 2018). In line of this, the
firm has been performing much better than the competitor can be understood to have been down
to a great extent.
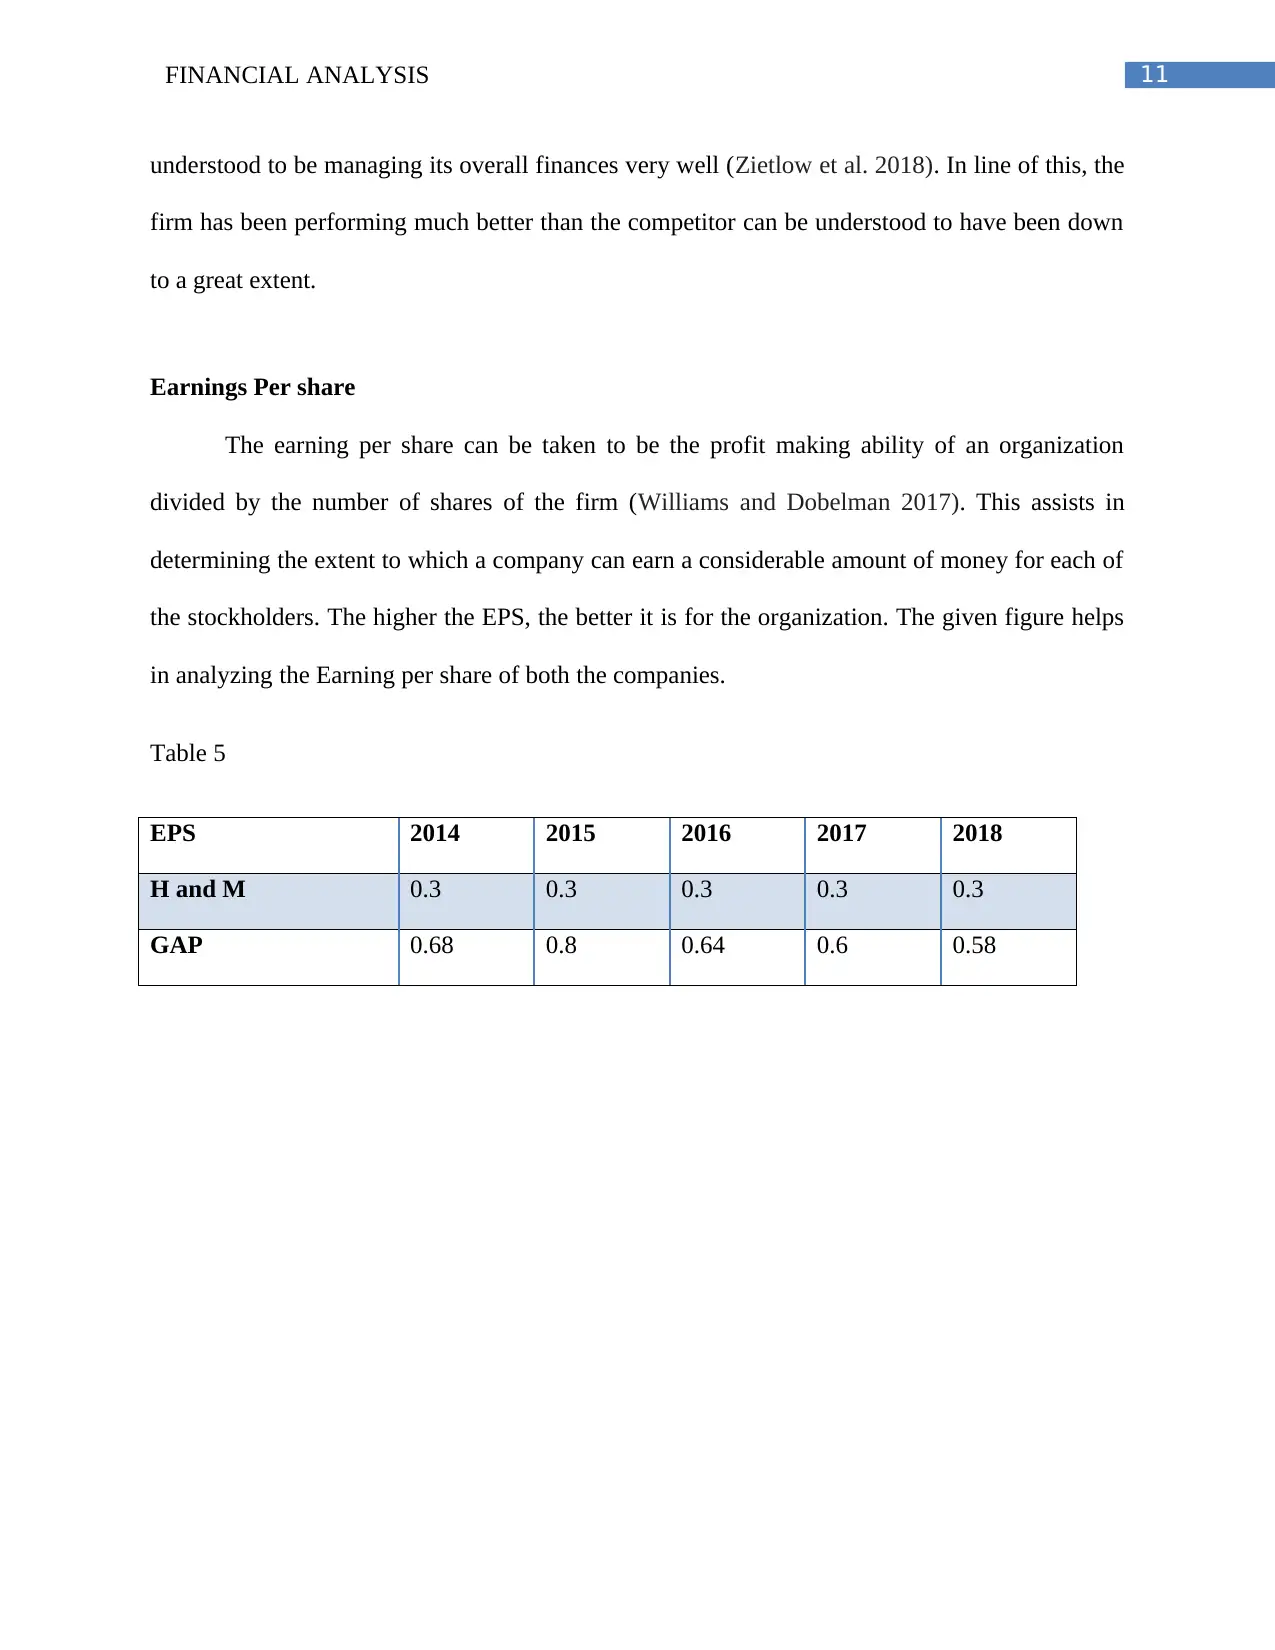
Earnings Per share
The earning per share can be taken to be the profit making ability of an organization
divided by the number of shares of the firm (Williams and Dobelman 2017). This assists in
determining the extent to which a company can earn a considerable amount of money for each of
the stockholders. The higher the EPS, the better it is for the organization. The given figure helps
in analyzing the Earning per share of both the companies.
Table 5
EPS 2014 2015 2016 2017 2018
H and M 0.3 0.3 0.3 0.3 0.3
GAP 0.68 0.8 0.64 0.6 0.58
understood to be managing its overall finances very well (Zietlow et al. 2018). In line of this, the
firm has been performing much better than the competitor can be understood to have been down
to a great extent.
Earnings Per share
The earning per share can be taken to be the profit making ability of an organization
divided by the number of shares of the firm (Williams and Dobelman 2017). This assists in
determining the extent to which a company can earn a considerable amount of money for each of
the stockholders. The higher the EPS, the better it is for the organization. The given figure helps
in analyzing the Earning per share of both the companies.
Table 5
EPS 2014 2015 2016 2017 2018
H and M 0.3 0.3 0.3 0.3 0.3
GAP 0.68 0.8 0.64 0.6 0.58
⊘ This is a preview!⊘
Do you want full access?
Subscribe today to unlock all pages.
Trusted by 1+ million students worldwide
1 out of 16
Related Documents


Your All-in-One AI-Powered Toolkit for Academic Success.
+13062052269
info@desklib.com
Available 24*7 on WhatsApp / Email
![[object Object]](/_next/static/media/star-bottom.7253800d.svg)
Unlock your academic potential
Copyright © 2020–2026 A2Z Services. All Rights Reserved. Developed and managed by ZUCOL.