HI5002 Finance: Harvey Norman Investment Decision Analysis
VerifiedAdded on 2022/12/15
|16
|4213
|272
Report
AI Summary
This report provides a comprehensive financial analysis of Harvey Norman Holdings Limited, an ASX-listed company. It begins with an abstract and introduction outlining the report's purpose: to guide potential overseas investors. The analysis includes a detailed examination of Harvey Norman's key products and market position, followed by a thorough assessment of its financial performance using ratio analysis (liquidity, capital structure, and profitability) and trend analysis from 2016 to 2018. The report also incorporates non-current asset analysis and scenario analysis, evaluating potential investment outcomes under different conditions. Furthermore, the report analyzes the company's share and bond issuance, along with its PE ratio and share price movements. The report concludes with investment recommendations for potential investors, based on the gathered data and research.
ANALYSIS REGARDING INVESTMENT DECISION
FROM:
STUDENT ID:
UNIT NAME:
CODE:
LECTURE NAME:
DATE: 08/09/2019
SUBJECT: ANALYSIS REGARDING INVESTMENT DECISION
UNIVERSITY:
FROM:
STUDENT ID:
UNIT NAME:
CODE:
LECTURE NAME:
DATE: 08/09/2019
SUBJECT: ANALYSIS REGARDING INVESTMENT DECISION
UNIVERSITY:
Paraphrase This Document
Need a fresh take? Get an instant paraphrase of this document with our AI Paraphraser
ANALYSIS REGARDING INVESTMENT DECISION 2
Table of content
Sr. No. Particulars Page no.
1. Abstract 3
2. Introduction 3
3. Detailed financial analysis of the entity 3
a. Description or key products of the company 3
b. Analysis of selected performance ratios of the company and
trend analysis
4
c. Non-current analysis of the company 6
d. Scenario Analysis 7
e. Analysis of share/ bonds issuance by the company 9
f. Analysis of PE ratio and share price movement 10
4. Letter for recommendation for proposed investment 12
5. Conclusion 13
6. References 14
ANALYSIS REGARDING INVESTMENT DECISION 3
1. Abstract:
This report has been prepared for company financial performance analysis for the
investment purposes. The annual reports of the company for three financial years and share
prices have been considered for financial performance analysis and accordingly the
conclusion has been drawn to advise the institutional investors regarding the investment in
the company. The resources which are reliable and authentic only have been used for the
purpose of report and the report has been prepared in such a structured manner so that the
investor will be able to analyze the financial performance of ASX listed entity for his
decision-making purposes. Various other resources such as ASX announcements made by
the company, articles in newspaper and websites, journals have been used to interpret other
financials and non-financial factors so that investor can analyze the information in detailed
manner.
2. Introduction:
We have selected an ASX listed company i.e. Harvey Norman Holdings Limited and detailed
analysis has been performed on the financial statements and share price of the entity. The
company is an Australian ASX listed company which is having head office at Homebush
West, New South Wales. The entity was founded in 1982 and the founder of the entity is
Gerry Harvey Ian Norman and the company operates at 194 locations.
The purpose of the research and assignment is to guide the overseas investor about
proposed investment in the company. In the assignment, we have performed detailed
analysis on various aspects of the company i.e. Harvey Normal Holding Limited and the
detailed report have been prepared. We have found in our research and report regarding the
financial position and performance of the entity, liquidity, solvency and profitability of the
entity, share price movement of the entity etc. and accordingly has advised the investor
about the investment in the company (Anđelić et al.2017). We have conducted detailed
research and our report has been prepared in structured manner. Firstly, we have described
about the key products manufactured by the company and its importance, then we have
performed detailed trend analysis along with financial and liquidity ratios, capital structure
and non-current assets analysis. Thereafter scenario analysis has been performed for a new
project considering base and worst case and accordingly decision has been taken to accept
or reject the proposal. We have also analyzed the issuance of shares/ bonds by the
company and PE ratio and share price movements of the company. After performing
detailed analysis, we have drawn conclusion and recommendation has been provided to
investor.
3. Detailed financial analysis of the entity:
The detailed financial examination of the entity in detailed manner is as below for the
decision-making of investor:
a. Description or key products of the company:
⊘ This is a preview!⊘
Do you want full access?
Subscribe today to unlock all pages.
Trusted by 1+ million students worldwide
ANALYSIS REGARDING INVESTMENT DECISION 4
The company is mainly operating on the basisof franchise concept and the company is
having more than 280 franchise and company-owned stores across the world i.e. Australia,
South-East Asia, New Zealand and Europe. The company is in retail business of bedding,
computersand laptops, consumer electrical equipment and communications. The entity is a
big brand retailer of household goods. The Household goods are an important part of
society and household goods are required in every of the world. The companies operating in
household goods sector have immense market opportunities to grow in each corner of the
world. Due to usage and huge demand of household products in each corner of the world,
the proposed overseas investor can have tremendous opportunities to grow and establish in
Australia (Annual Report- Harvey Norman).
b. Analysis of selected performance ratios of the company and trend analysis:
Ratio analysis is used by the company to analyze and evaluate the various aspects of the
financial statement of the company such as liquidity, profitability and capital structure of the
company (Babalola andAbiola, 2013). The ratio analysis of the company is generally
performed by the analyst who is external to the company because for the external users the
main source of the information is the financial statement of the company. The ratio analysis
of the company is generally performed to analyze and compare the result of the company
within the industry andit is generally used to analyze the trend of the company over the
period(Easton, E. 2016). There are various important ratios that is analyzed for the given
company such as liquidity, capital structure and profitability ratio.
The liquidity ratio of the company is used to determine the liquid position of the company i.e.
the ability of the company to pay off its debt and its obligations. The liquidity position of the
company can be analyzed and determined through various ratios such as current ratio,
quick ratio, etc. which is discussed as below:
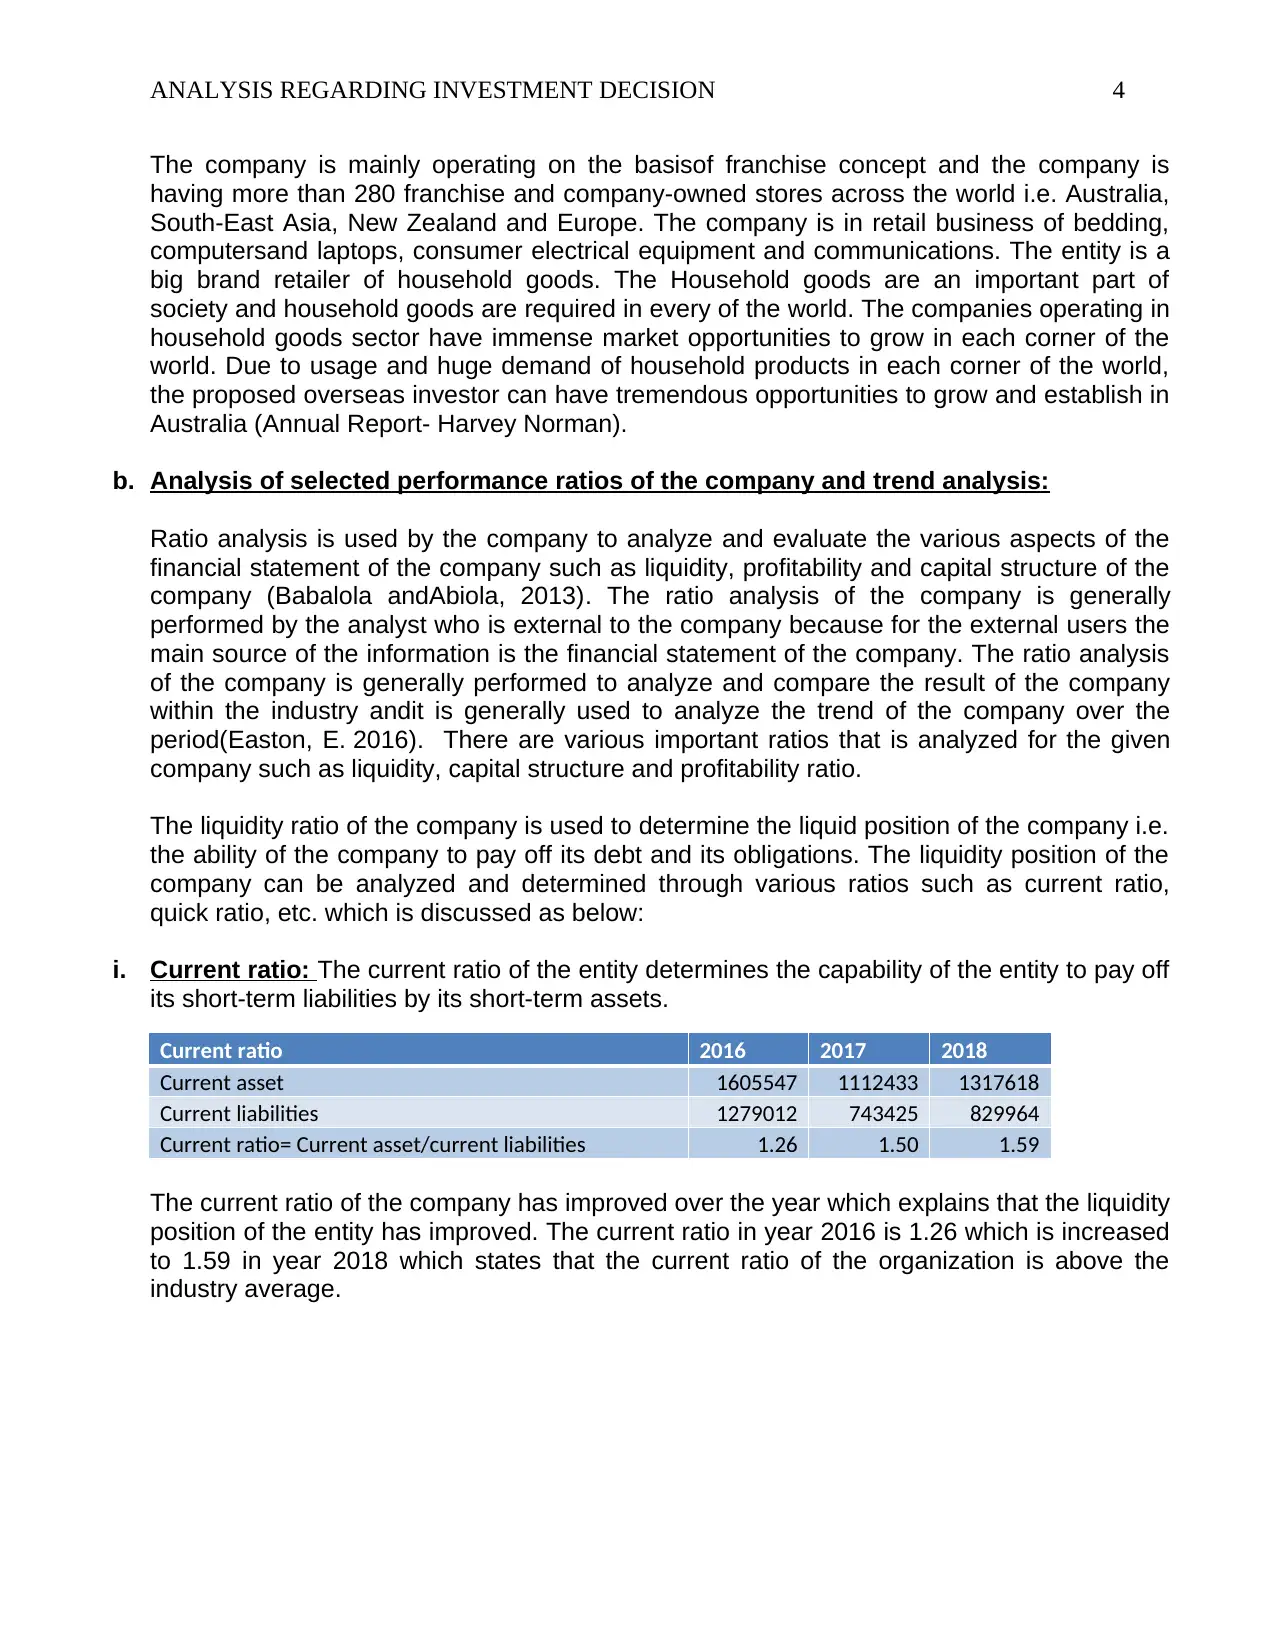
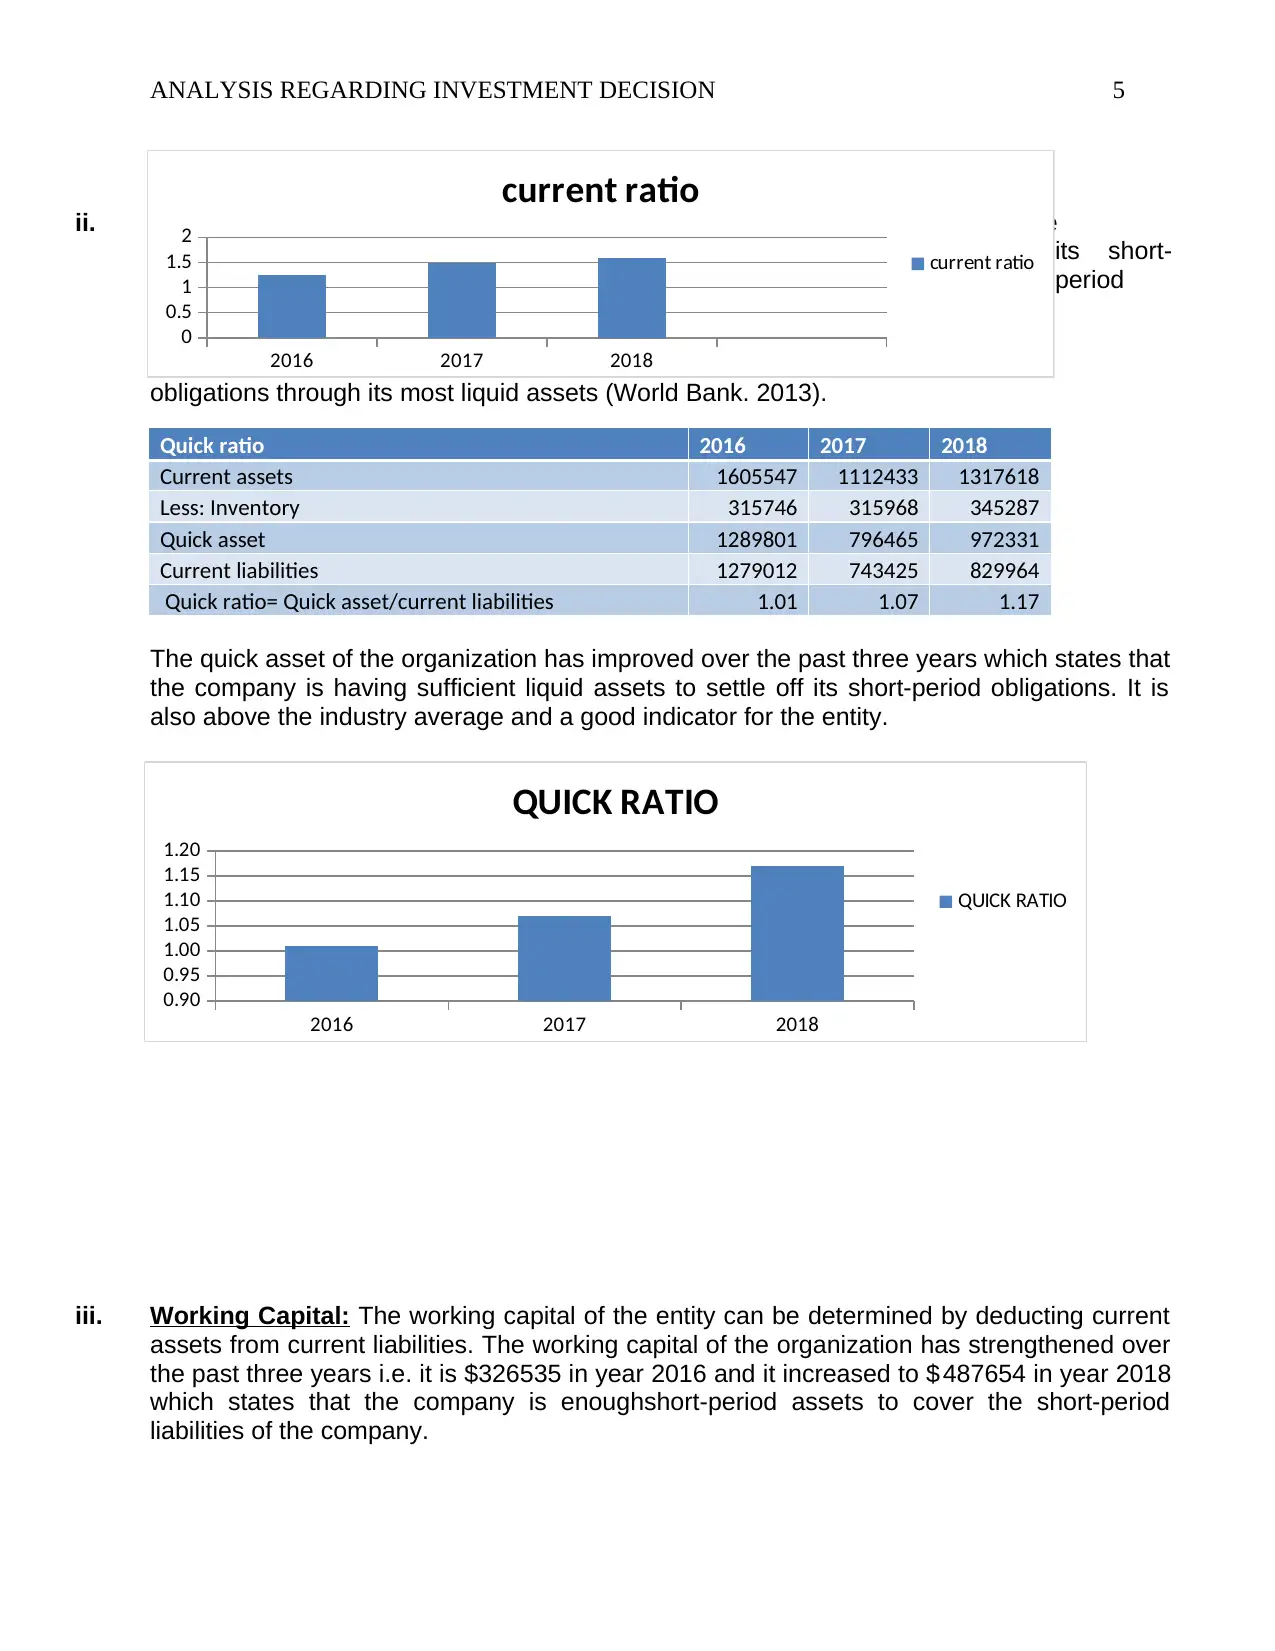
i. Current ratio: The current ratio of the entity determines the capability of the entity to pay off
its short-term liabilities by its short-term assets.
Current ratio 2016 2017 2018
Current asset 1605547 1112433 1317618
Current liabilities 1279012 743425 829964
Current ratio= Current asset/current liabilities 1.26 1.50 1.59
The current ratio of the company has improved over the year which explains that the liquidity
position of the entity has improved. The current ratio in year 2016 is 1.26 which is increased
to 1.59 in year 2018 which states that the current ratio of the organization is above the
industry average.
The company is mainly operating on the basisof franchise concept and the company is
having more than 280 franchise and company-owned stores across the world i.e. Australia,
South-East Asia, New Zealand and Europe. The company is in retail business of bedding,
computersand laptops, consumer electrical equipment and communications. The entity is a
big brand retailer of household goods. The Household goods are an important part of
society and household goods are required in every of the world. The companies operating in
household goods sector have immense market opportunities to grow in each corner of the
world. Due to usage and huge demand of household products in each corner of the world,
the proposed overseas investor can have tremendous opportunities to grow and establish in
Australia (Annual Report- Harvey Norman).
b. Analysis of selected performance ratios of the company and trend analysis:
Ratio analysis is used by the company to analyze and evaluate the various aspects of the
financial statement of the company such as liquidity, profitability and capital structure of the
company (Babalola andAbiola, 2013). The ratio analysis of the company is generally
performed by the analyst who is external to the company because for the external users the
main source of the information is the financial statement of the company. The ratio analysis
of the company is generally performed to analyze and compare the result of the company
within the industry andit is generally used to analyze the trend of the company over the
period(Easton, E. 2016). There are various important ratios that is analyzed for the given
company such as liquidity, capital structure and profitability ratio.
The liquidity ratio of the company is used to determine the liquid position of the company i.e.
the ability of the company to pay off its debt and its obligations. The liquidity position of the
company can be analyzed and determined through various ratios such as current ratio,
quick ratio, etc. which is discussed as below:
i. Current ratio: The current ratio of the entity determines the capability of the entity to pay off
its short-term liabilities by its short-term assets.
Current ratio 2016 2017 2018
Current asset 1605547 1112433 1317618
Current liabilities 1279012 743425 829964
Current ratio= Current asset/current liabilities 1.26 1.50 1.59
The current ratio of the company has improved over the year which explains that the liquidity
position of the entity has improved. The current ratio in year 2016 is 1.26 which is increased
to 1.59 in year 2018 which states that the current ratio of the organization is above the
industry average.
Paraphrase This Document
Need a fresh take? Get an instant paraphrase of this document with our AI Paraphraser
ANALYSIS REGARDING INVESTMENT DECISION 5
ii. Quick ratio: The
its short-
period
obligations through its most liquid assets (World Bank. 2013).
Quick ratio 2016 2017 2018
Current assets 1605547 1112433 1317618
Less: Inventory 315746 315968 345287
Quick asset 1289801 796465 972331
Current liabilities 1279012 743425 829964
Quick ratio= Quick asset/current liabilities 1.01 1.07 1.17
The quick asset of the organization has improved over the past three years which states that
the company is having sufficient liquid assets to settle off its short-period obligations. It is
also above the industry average and a good indicator for the entity.
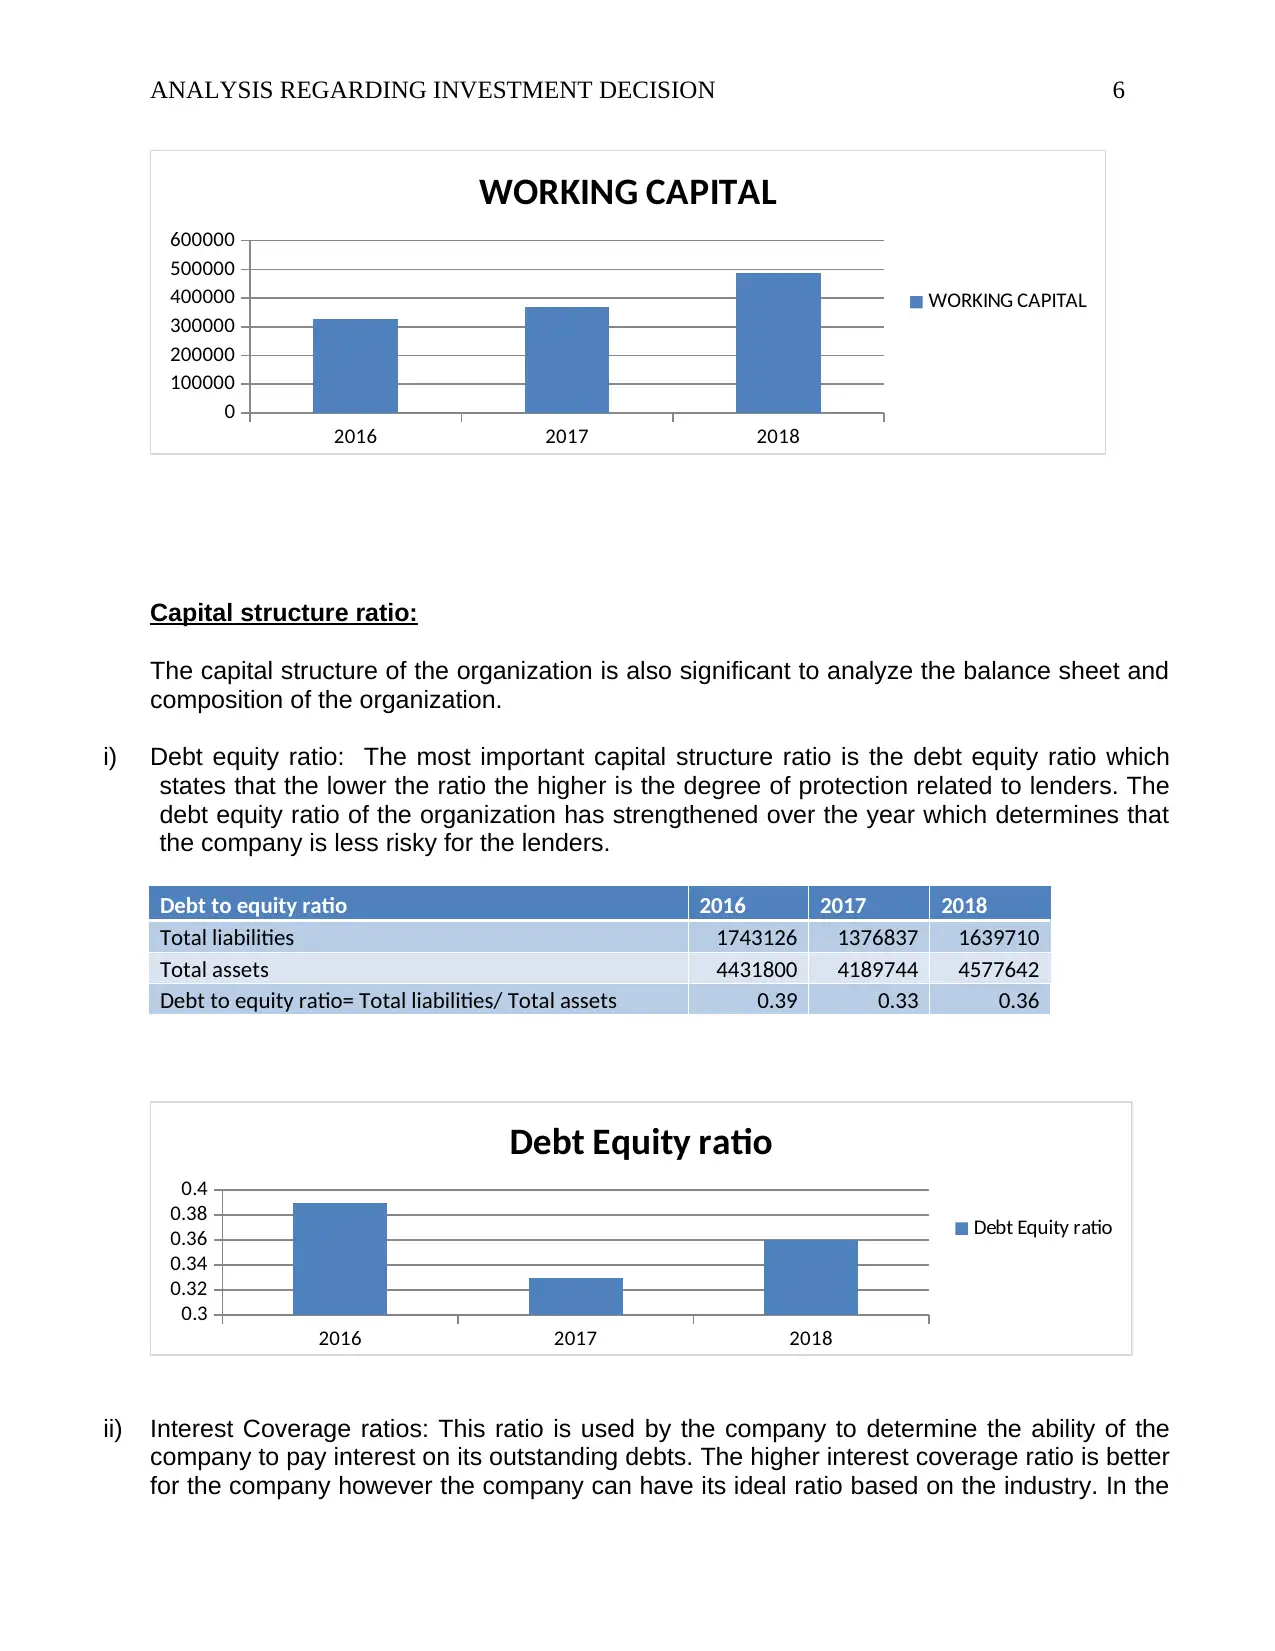
iii. Working Capital: The working capital of the entity can be determined by deducting current
assets from current liabilities. The working capital of the organization has strengthened over
the past three years i.e. it is $326535 in year 2016 and it increased to $ 487654 in year 2018
which states that the company is enoughshort-period assets to cover the short-period
liabilities of the company.
2016 2017 2018
0
0.5
1
1.5
2
current ratio
current ratio
2016 2017 2018
0.90
0.95
1.00
1.05
1.10
1.15
1.20
QUICK RATIO
QUICK RATIO
ii. Quick ratio: The
its short-
period
obligations through its most liquid assets (World Bank. 2013).
Quick ratio 2016 2017 2018
Current assets 1605547 1112433 1317618
Less: Inventory 315746 315968 345287
Quick asset 1289801 796465 972331
Current liabilities 1279012 743425 829964
Quick ratio= Quick asset/current liabilities 1.01 1.07 1.17
The quick asset of the organization has improved over the past three years which states that
the company is having sufficient liquid assets to settle off its short-period obligations. It is
also above the industry average and a good indicator for the entity.
iii. Working Capital: The working capital of the entity can be determined by deducting current
assets from current liabilities. The working capital of the organization has strengthened over
the past three years i.e. it is $326535 in year 2016 and it increased to $ 487654 in year 2018
which states that the company is enoughshort-period assets to cover the short-period
liabilities of the company.
2016 2017 2018
0
0.5
1
1.5
2
current ratio
current ratio
2016 2017 2018
0.90
0.95
1.00
1.05
1.10
1.15
1.20
QUICK RATIO
QUICK RATIO
ANALYSIS REGARDING INVESTMENT DECISION 6
2016 2017 2018
0
100000
200000
300000
400000
500000
600000
WORKING CAPITAL
WORKING CAPITAL
Capital structure ratio:
The capital structure of the organization is also significant to analyze the balance sheet and
composition of the organization.
i) Debt equity ratio: The most important capital structure ratio is the debt equity ratio which
states that the lower the ratio the higher is the degree of protection related to lenders. The
debt equity ratio of the organization has strengthened over the year which determines that
the company is less risky for the lenders.
Debt to equity ratio 2016 2017 2018
Total liabilities 1743126 1376837 1639710
Total assets 4431800 4189744 4577642
Debt to equity ratio= Total liabilities/ Total assets 0.39 0.33 0.36
2016 2017 2018
0.3
0.32
0.34
0.36
0.38
0.4
Debt Equity ratio
Debt Equity ratio
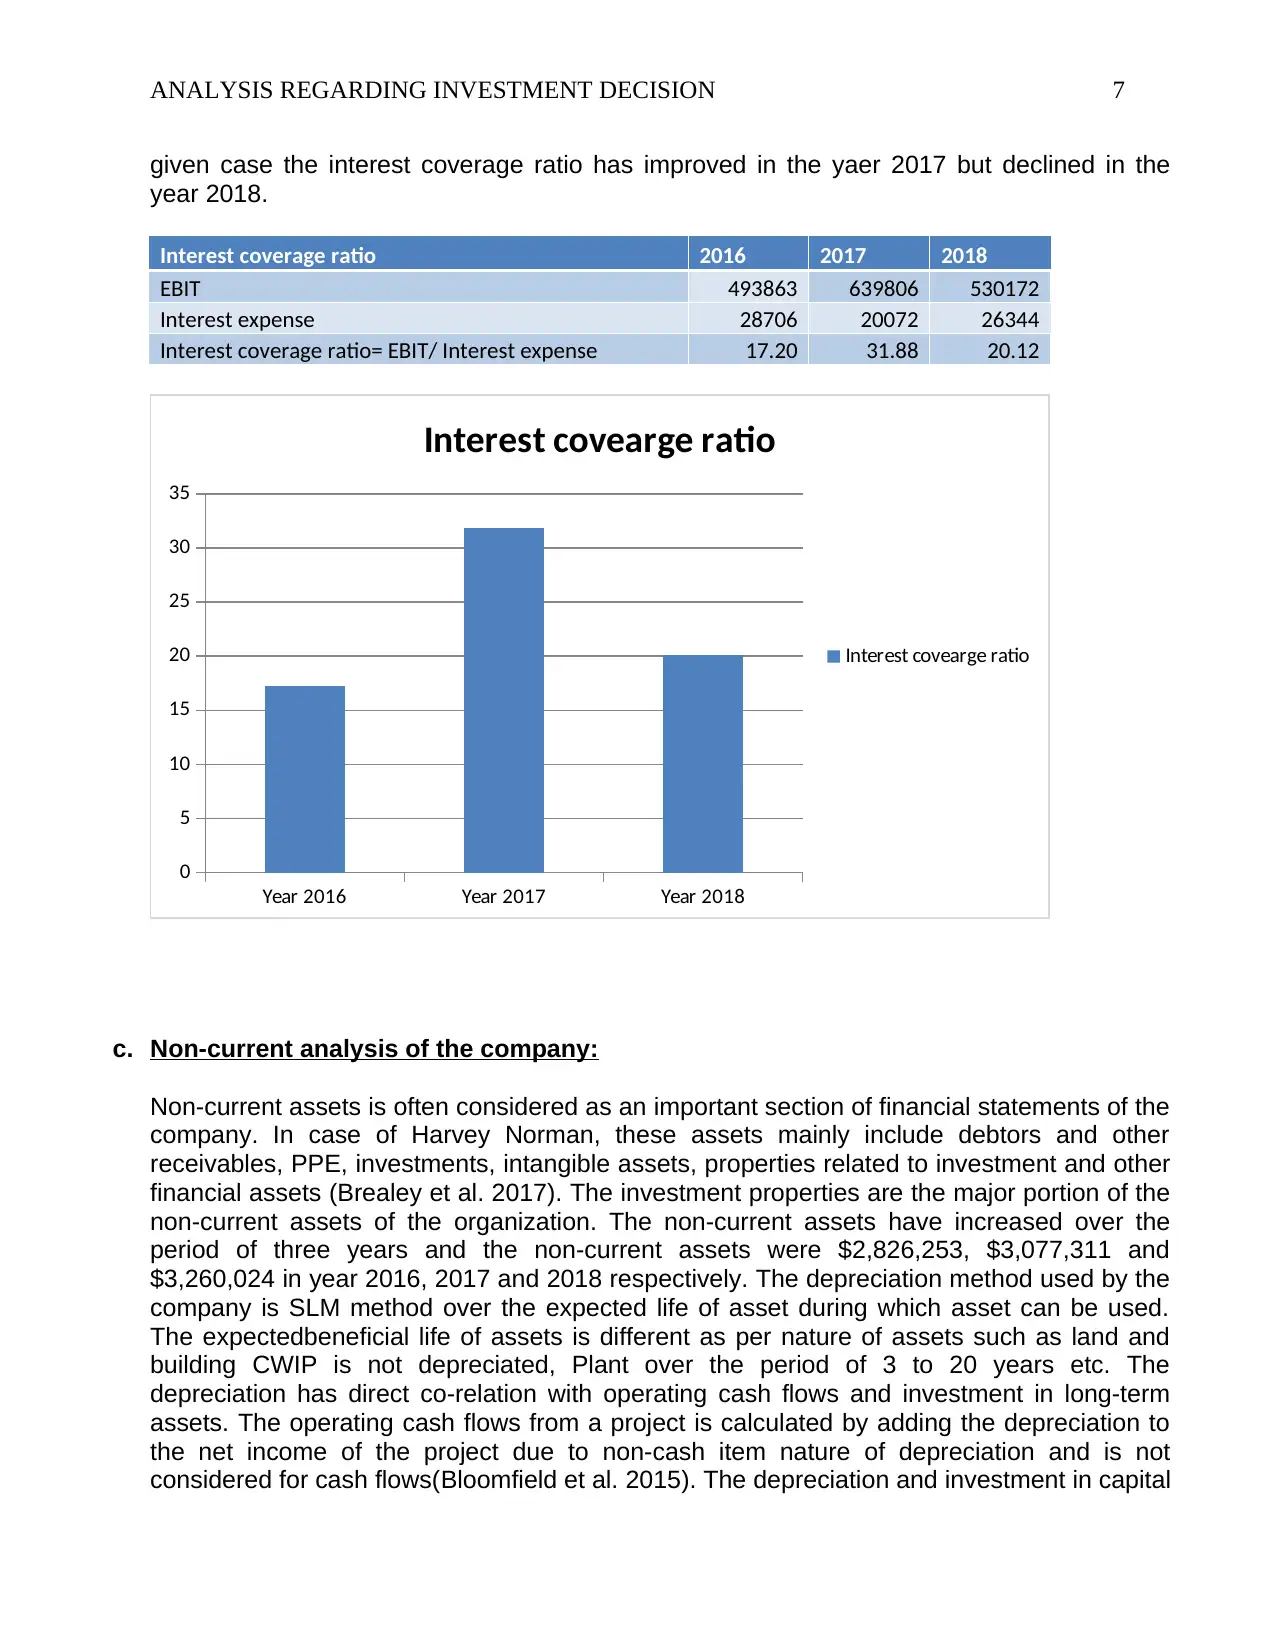
ii) Interest Coverage ratios: This ratio is used by the company to determine the ability of the
company to pay interest on its outstanding debts. The higher interest coverage ratio is better
for the company however the company can have its ideal ratio based on the industry. In the
2016 2017 2018
0
100000
200000
300000
400000
500000
600000
WORKING CAPITAL
WORKING CAPITAL
Capital structure ratio:
The capital structure of the organization is also significant to analyze the balance sheet and
composition of the organization.
i) Debt equity ratio: The most important capital structure ratio is the debt equity ratio which
states that the lower the ratio the higher is the degree of protection related to lenders. The
debt equity ratio of the organization has strengthened over the year which determines that
the company is less risky for the lenders.
Debt to equity ratio 2016 2017 2018
Total liabilities 1743126 1376837 1639710
Total assets 4431800 4189744 4577642
Debt to equity ratio= Total liabilities/ Total assets 0.39 0.33 0.36
2016 2017 2018
0.3
0.32
0.34
0.36
0.38
0.4
Debt Equity ratio
Debt Equity ratio
ii) Interest Coverage ratios: This ratio is used by the company to determine the ability of the
company to pay interest on its outstanding debts. The higher interest coverage ratio is better
for the company however the company can have its ideal ratio based on the industry. In the
⊘ This is a preview!⊘
Do you want full access?
Subscribe today to unlock all pages.
Trusted by 1+ million students worldwide
ANALYSIS REGARDING INVESTMENT DECISION 7
given case the interest coverage ratio has improved in the yaer 2017 but declined in the
year 2018.
Interest coverage ratio 2016 2017 2018
EBIT 493863 639806 530172
Interest expense 28706 20072 26344
Interest coverage ratio= EBIT/ Interest expense 17.20 31.88 20.12
Year 2016 Year 2017 Year 2018
0
5
10
15
20
25
30
35
Interest covearge ratio
Interest covearge ratio
c. Non-current analysis of the company:
Non-current assets is often considered as an important section of financial statements of the
company. In case of Harvey Norman, these assets mainly include debtors and other
receivables, PPE, investments, intangible assets, properties related to investment and other
financial assets (Brealey et al. 2017). The investment properties are the major portion of the
non-current assets of the organization. The non-current assets have increased over the
period of three years and the non-current assets were $2,826,253, $3,077,311 and
$3,260,024 in year 2016, 2017 and 2018 respectively. The depreciation method used by the
company is SLM method over the expected life of asset during which asset can be used.
The expectedbeneficial life of assets is different as per nature of assets such as land and
building CWIP is not depreciated, Plant over the period of 3 to 20 years etc. The
depreciation has direct co-relation with operating cash flows and investment in long-term
assets. The operating cash flows from a project is calculated by adding the depreciation to
the net income of the project due to non-cash item nature of depreciation and is not
considered for cash flows(Bloomfield et al. 2015). The depreciation and investment in capital
Paraphrase This Document
Need a fresh take? Get an instant paraphrase of this document with our AI Paraphraser
ANALYSIS REGARDING INVESTMENT DECISION 8
expenditures have direct relationship because higher the capex to depreciation ratios show
more investment made by the company. Higher the ratios show that the organization is in
growing stage and the organization is investing more into capex expenditures(Libby and
Rennekamp. 2016). The capex expenditure to depreciation ratio of the company for three
years is as below:
Particulars 2016 2017 2018
Capex expenditures 68,155 89,366 93,895
Depreciation, amortization
and impairment expense
111,108 102,880 151,156
Capex to dep ratio 0.61 0.87 0.62
The company has the capex to depreciation ratio has increased in year 2018 and it shows
that the company is in stable stage and has expanded its business in year 2017
significantly.
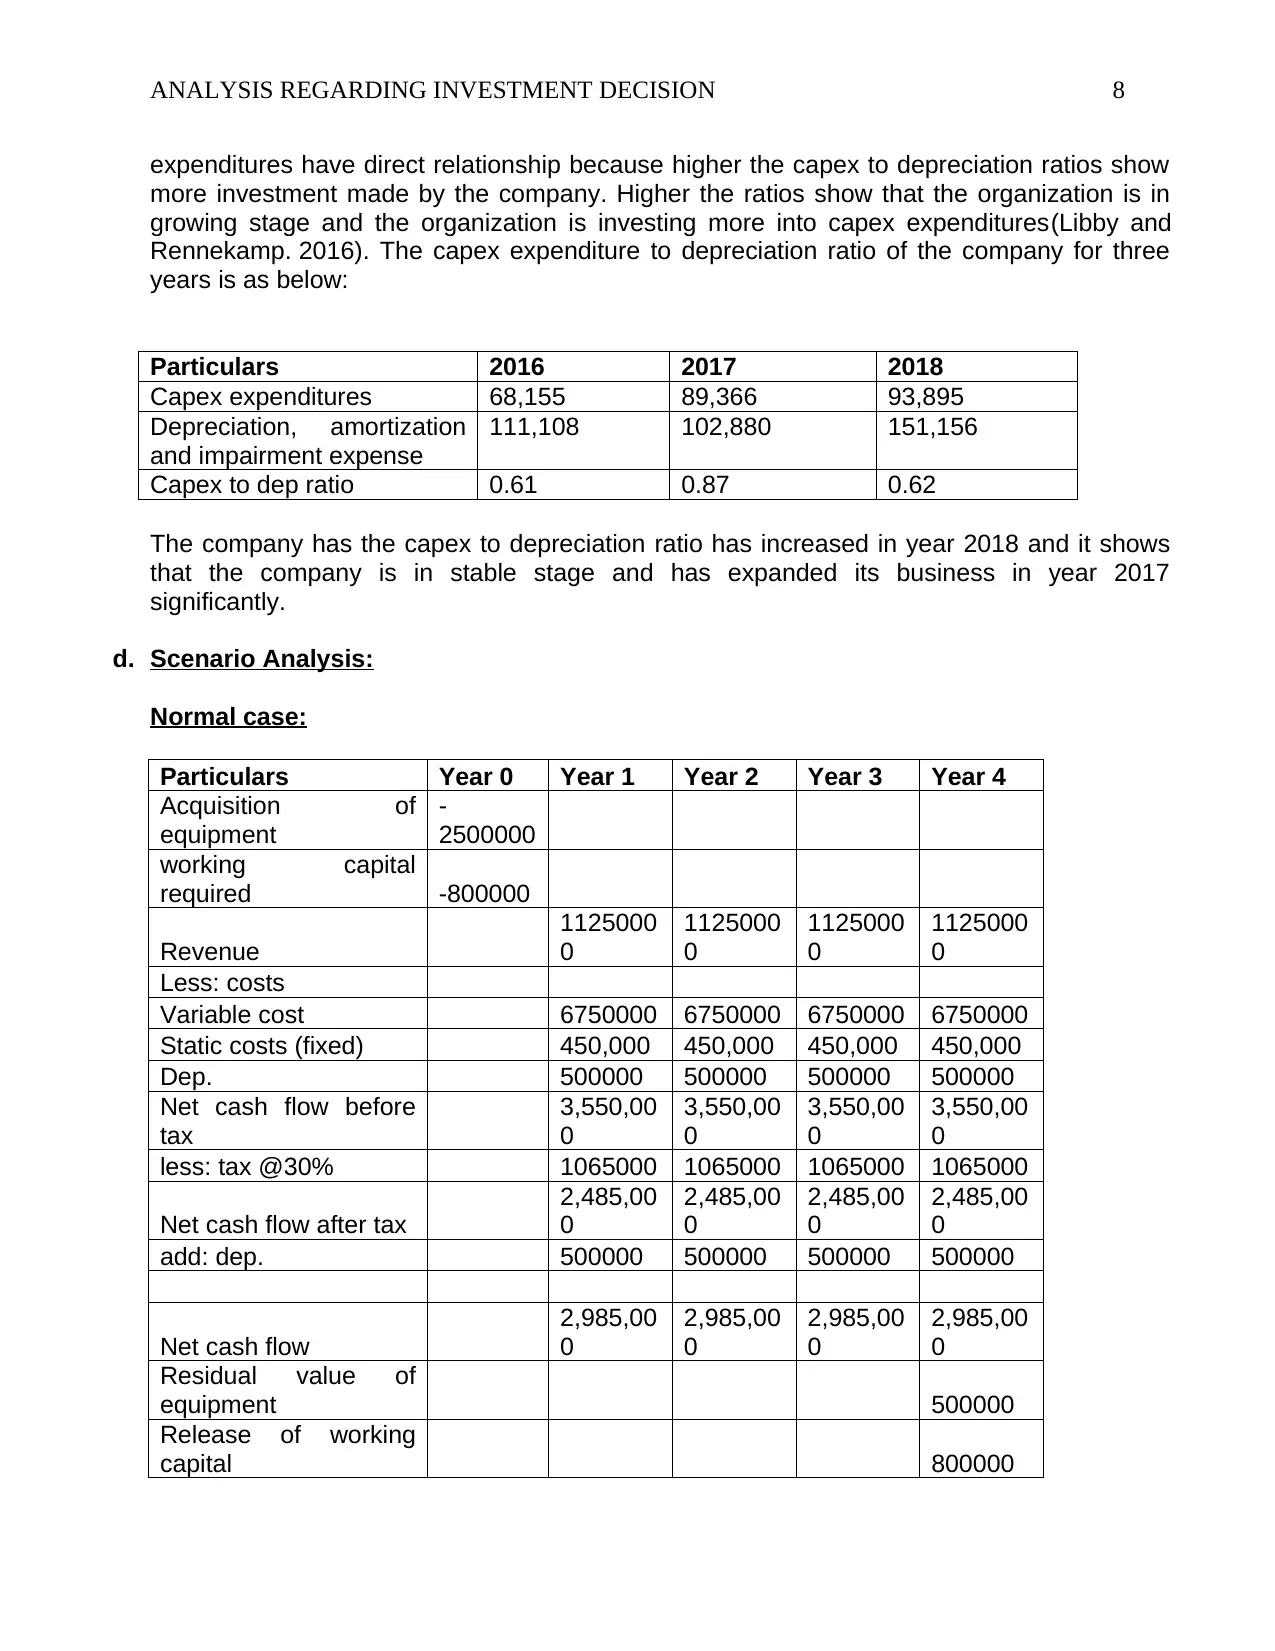
d. Scenario Analysis:
Normal case:
Particulars Year 0 Year 1 Year 2 Year 3 Year 4
Acquisition of
equipment
-
2500000
working capital
required -800000
Revenue
1125000
0
1125000
0
1125000
0
1125000
0
Less: costs
Variable cost 6750000 6750000 6750000 6750000
Static costs (fixed) 450,000 450,000 450,000 450,000
Dep. 500000 500000 500000 500000
Net cash flow before
tax
3,550,00
0
3,550,00
0
3,550,00
0
3,550,00
0
less: tax @30% 1065000 1065000 1065000 1065000
Net cash flow after tax
2,485,00
0
2,485,00
0
2,485,00
0
2,485,00
0
add: dep. 500000 500000 500000 500000
Net cash flow
2,985,00
0
2,985,00
0
2,985,00
0
2,985,00
0
Residual value of
equipment 500000
Release of working
capital 800000
expenditures have direct relationship because higher the capex to depreciation ratios show
more investment made by the company. Higher the ratios show that the organization is in
growing stage and the organization is investing more into capex expenditures(Libby and
Rennekamp. 2016). The capex expenditure to depreciation ratio of the company for three
years is as below:
Particulars 2016 2017 2018
Capex expenditures 68,155 89,366 93,895
Depreciation, amortization
and impairment expense
111,108 102,880 151,156
Capex to dep ratio 0.61 0.87 0.62
The company has the capex to depreciation ratio has increased in year 2018 and it shows
that the company is in stable stage and has expanded its business in year 2017
significantly.
d. Scenario Analysis:
Normal case:
Particulars Year 0 Year 1 Year 2 Year 3 Year 4
Acquisition of
equipment
-
2500000
working capital
required -800000
Revenue
1125000
0
1125000
0
1125000
0
1125000
0
Less: costs
Variable cost 6750000 6750000 6750000 6750000
Static costs (fixed) 450,000 450,000 450,000 450,000
Dep. 500000 500000 500000 500000
Net cash flow before
tax
3,550,00
0
3,550,00
0
3,550,00
0
3,550,00
0
less: tax @30% 1065000 1065000 1065000 1065000
Net cash flow after tax
2,485,00
0
2,485,00
0
2,485,00
0
2,485,00
0
add: dep. 500000 500000 500000 500000
Net cash flow
2,985,00
0
2,985,00
0
2,985,00
0
2,985,00
0
Residual value of
equipment 500000
Release of working
capital 800000
ANALYSIS REGARDING INVESTMENT DECISION 9
Net cash flows
-
3300000
2,985,00
0
2,985,00
0
2,985,00
0
4,285,00
0
PV factor @12% 1
0.89285
7
0.79719
4 0.71178
0.63551
8
Present value
-
3300000 2665179 2379624 2124664 2723195
Net present value 6592661
Worst case scenario:
Particulars Year 0 Year 1 Year 2 Year 3 Year 4
Acquisition of equipment -2500000
working capital required -800000
Revenue 7200000 7200000 7200000 7200000
Less: costs
Variable cost 6480000 6480000 6480000 6480000
Fixed costs 550,000 550,000 550,000 550,000
Dep. 500000 500000 500000 500000
Net cash flow before tax -330,000 -330,000 -330,000 -330,000
less: tax @30% -99000 -99000 -99000 -99000
Net cash flow after tax -231,000 -231,000 -231,000 -231,000
add: dep. 500000 500000 500000 500000
Net cash flow 269,000 269,000 269,000 269,000
Residual value of
equipment 500000
Release of W.C. 800000
Net cash flows -3300000 269,000 269,000 269,000 1,569,000
PV factor @12% 1 0.892857 0.797194 0.71178 0.635518
Present value -3300000 240178.6 214445.2 191468.9 997127.9
Net present value -1656780
Best case
Scenario:
Year 0 Year 1 Year 2 Year 3 Year 4
Acquisition of
equipment -2500000
⊘ This is a preview!⊘
Do you want full access?
Subscribe today to unlock all pages.
Trusted by 1+ million students worldwide
ANALYSIS REGARDING INVESTMENT DECISION 10
working capital
required -800000
Revenue
162000
00
162000
00
162000
00
162000
00
Less: costs
Variable cost
648000
0
648000
0
648000
0
648000
0
Fixed costs
350,00
0
350,00
0
350,00
0
350,00
0
Dep. 500000 500000 500000 500000
Net cash flow
before tax
8,870,0
00
8,870,0
00
8,870,0
00
8,870,0
00
less: tax @30%
266100
0
266100
0
266100
0
266100
0
Net cash flow after
tax
6,209,0
00
6,209,0
00
6,209,0
00
6,209,0
00
add: dep. 500000 500000 500000 500000
Net cash flow
6,709,0
00
6,709,0
00
6,709,0
00
6,709,0
00
Residual value of
equipment 500000
Release of working
capital 800000
Net cash flows -3300000
6,709,0
00
6,709,0
00
6,709,0
00
8,009,0
00
PV factor @12% 1
0.8928
57
0.7971
94
0.7117
8
0.6355
18
Present value -3300000
599017
9
534837
4
477533
4
508986
4
Net present value
17903750
.27
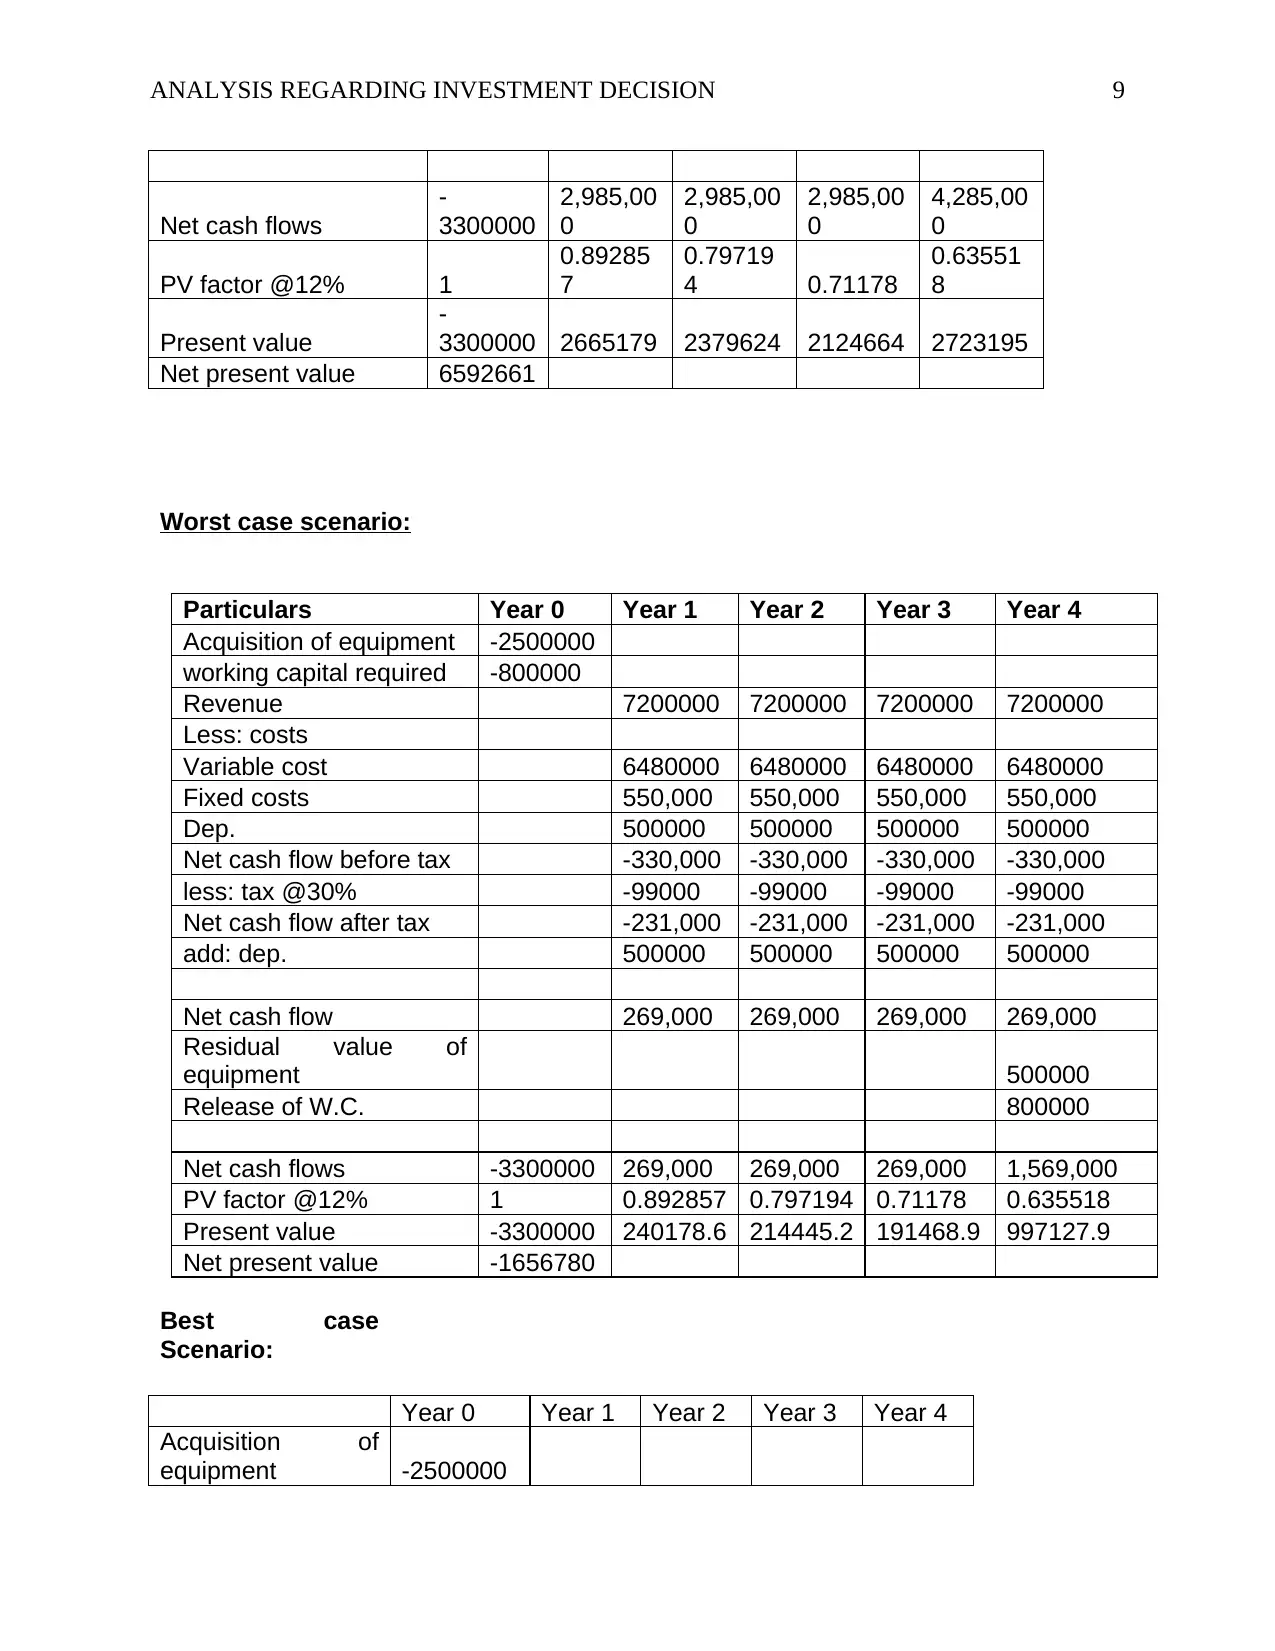
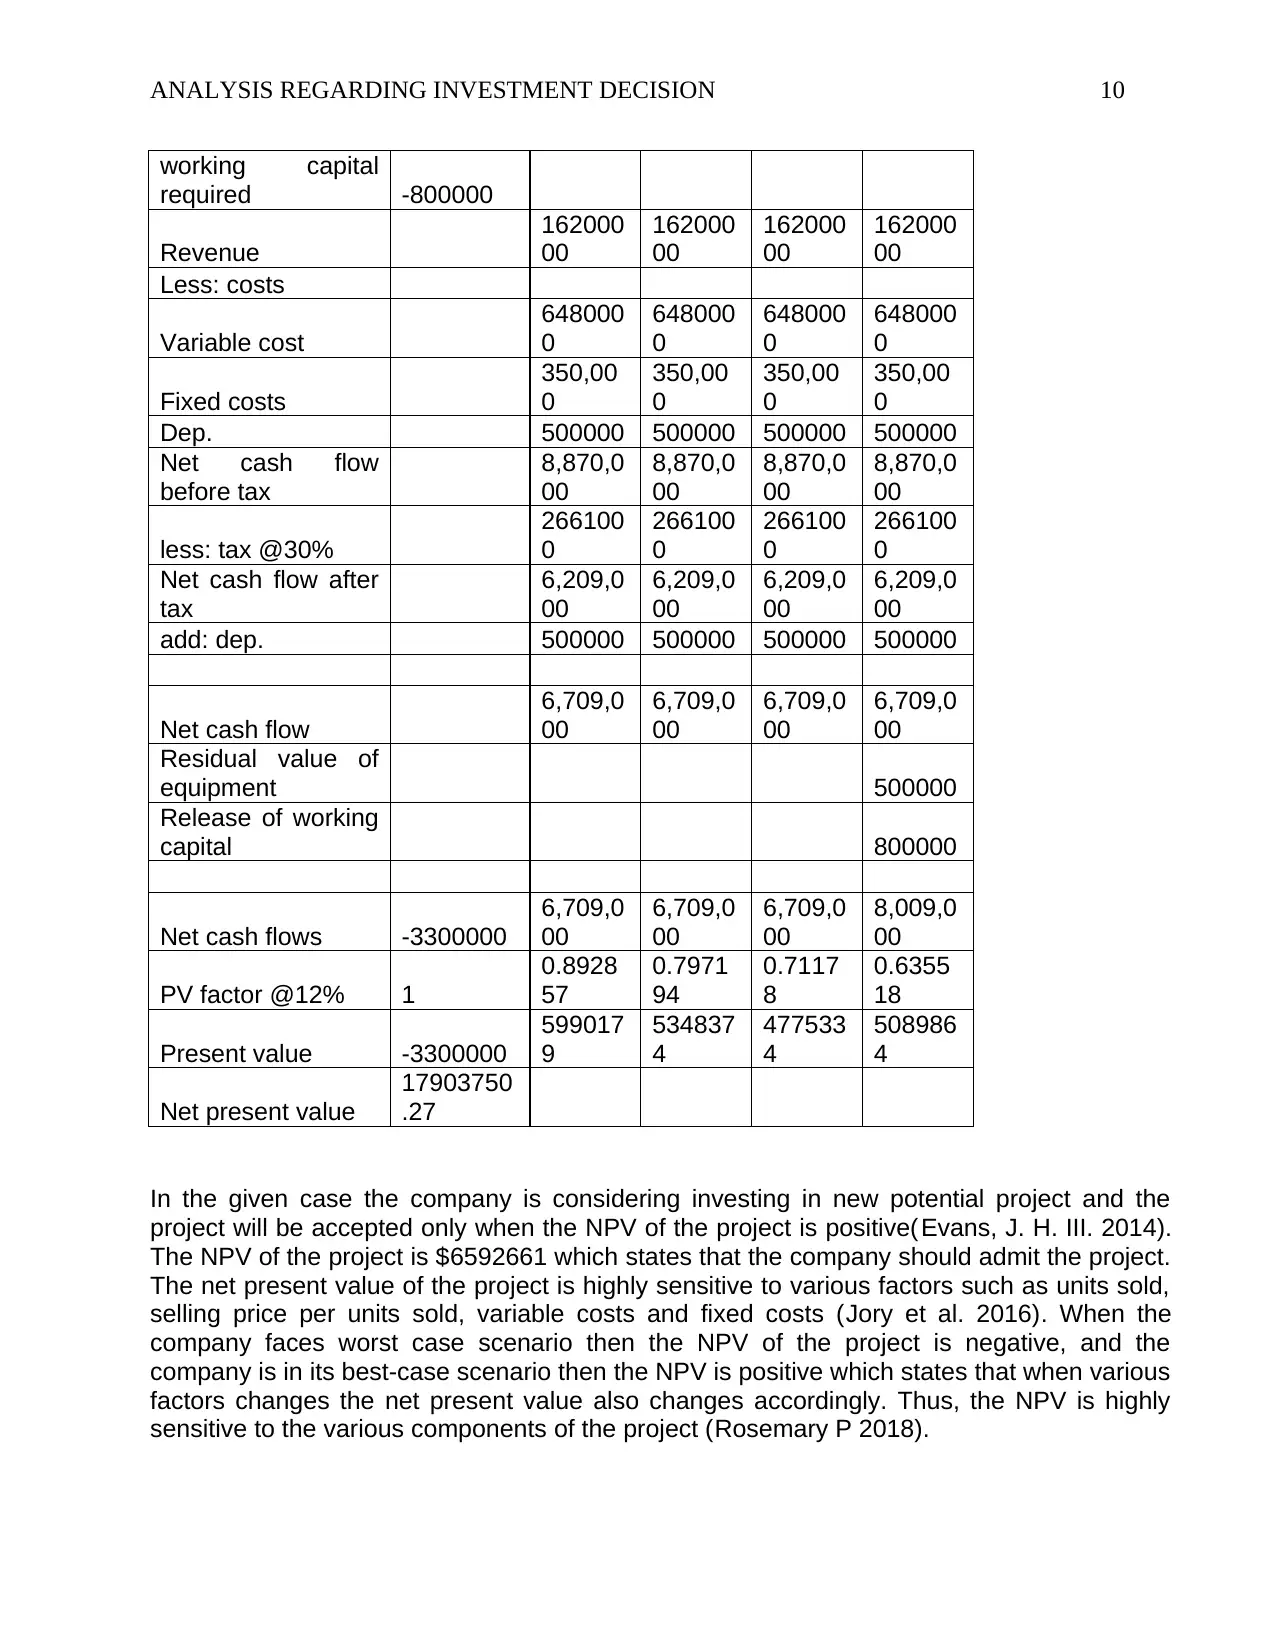
In the given case the company is considering investing in new potential project and the
project will be accepted only when the NPV of the project is positive(Evans, J. H. III. 2014).
The NPV of the project is $6592661 which states that the company should admit the project.
The net present value of the project is highly sensitive to various factors such as units sold,
selling price per units sold, variable costs and fixed costs (Jory et al. 2016). When the
company faces worst case scenario then the NPV of the project is negative, and the
company is in its best-case scenario then the NPV is positive which states that when various
factors changes the net present value also changes accordingly. Thus, the NPV is highly
sensitive to the various components of the project (Rosemary P 2018).
working capital
required -800000
Revenue
162000
00
162000
00
162000
00
162000
00
Less: costs
Variable cost
648000
0
648000
0
648000
0
648000
0
Fixed costs
350,00
0
350,00
0
350,00
0
350,00
0
Dep. 500000 500000 500000 500000
Net cash flow
before tax
8,870,0
00
8,870,0
00
8,870,0
00
8,870,0
00
less: tax @30%
266100
0
266100
0
266100
0
266100
0
Net cash flow after
tax
6,209,0
00
6,209,0
00
6,209,0
00
6,209,0
00
add: dep. 500000 500000 500000 500000
Net cash flow
6,709,0
00
6,709,0
00
6,709,0
00
6,709,0
00
Residual value of
equipment 500000
Release of working
capital 800000
Net cash flows -3300000
6,709,0
00
6,709,0
00
6,709,0
00
8,009,0
00
PV factor @12% 1
0.8928
57
0.7971
94
0.7117
8
0.6355
18
Present value -3300000
599017
9
534837
4
477533
4
508986
4
Net present value
17903750
.27
In the given case the company is considering investing in new potential project and the
project will be accepted only when the NPV of the project is positive(Evans, J. H. III. 2014).
The NPV of the project is $6592661 which states that the company should admit the project.
The net present value of the project is highly sensitive to various factors such as units sold,
selling price per units sold, variable costs and fixed costs (Jory et al. 2016). When the
company faces worst case scenario then the NPV of the project is negative, and the
company is in its best-case scenario then the NPV is positive which states that when various
factors changes the net present value also changes accordingly. Thus, the NPV is highly
sensitive to the various components of the project (Rosemary P 2018).
Paraphrase This Document
Need a fresh take? Get an instant paraphrase of this document with our AI Paraphraser
ANALYSIS REGARDING INVESTMENT DECISION 11
e. Analysis of share/ bonds issuance by the company:
The company has issued contributed equity i.e. ordinary shares during the year 2016, 2017
and 2018. During the year 2016 and 2017 the value of contributed equity was $4,968
thousands and $1,013 thousand respectively and during the current year 2018 it was $2,072
thousand. From the year 2016 to June 2017, the company has issued 500,000 ordinary
shares under ESOP. The company has also issued 400,000 performance rights on 28th Nov
2016 under tranche 2 of 2016 LTI scheme to the executive directors. Apart from vesting of
the options and issuance of shares under share option plan, no issuance of shares was
made during the year 2017. In year 2018, the company has also issued 1134000 shares
under executive option plan and other than abovementioned plan, no ordinary share was
issued. The additional shares were issued by the company to executive directors having the
same voting and dividend rights equivalent to old shares issued through listing process. The
company has not issued any kind of bonds in the recentfinancial years. Thus, we can
conclude that the organization has issued only ordinary shares under executive share option
and has not issued any kind of bonds or ordinary shares.
For the issuance of shares under executive share option, no underwriter or underwriting
agreement is required. Under share issuance plan, the employees have performance rights
and can exercise their options under vested period. The cost of issuance of shares of the
performance rights is generally the market value of shares issued because these shares are
issued in lieu of performance of the employee with cost or at concessional cost. As on June
30, 2018 the value of unvested performance rights was $4,292,000 and as on June 30,
2017 was $1,336,000. The value of option exercised i.e. cost was $319,788 during year
2018 and was $255,000 during the year 2017.
The issuance of securities will have huge impact on investment structure because it
changes the whole capital/ investment structure and alsothe liquidity and solvency ratios will
be changed due to issuance of securities. The proposed investor can alter his decision due
to change in capital structure because the capital structure plays an important role for any
decision-making process(Catherine M. S 2016).
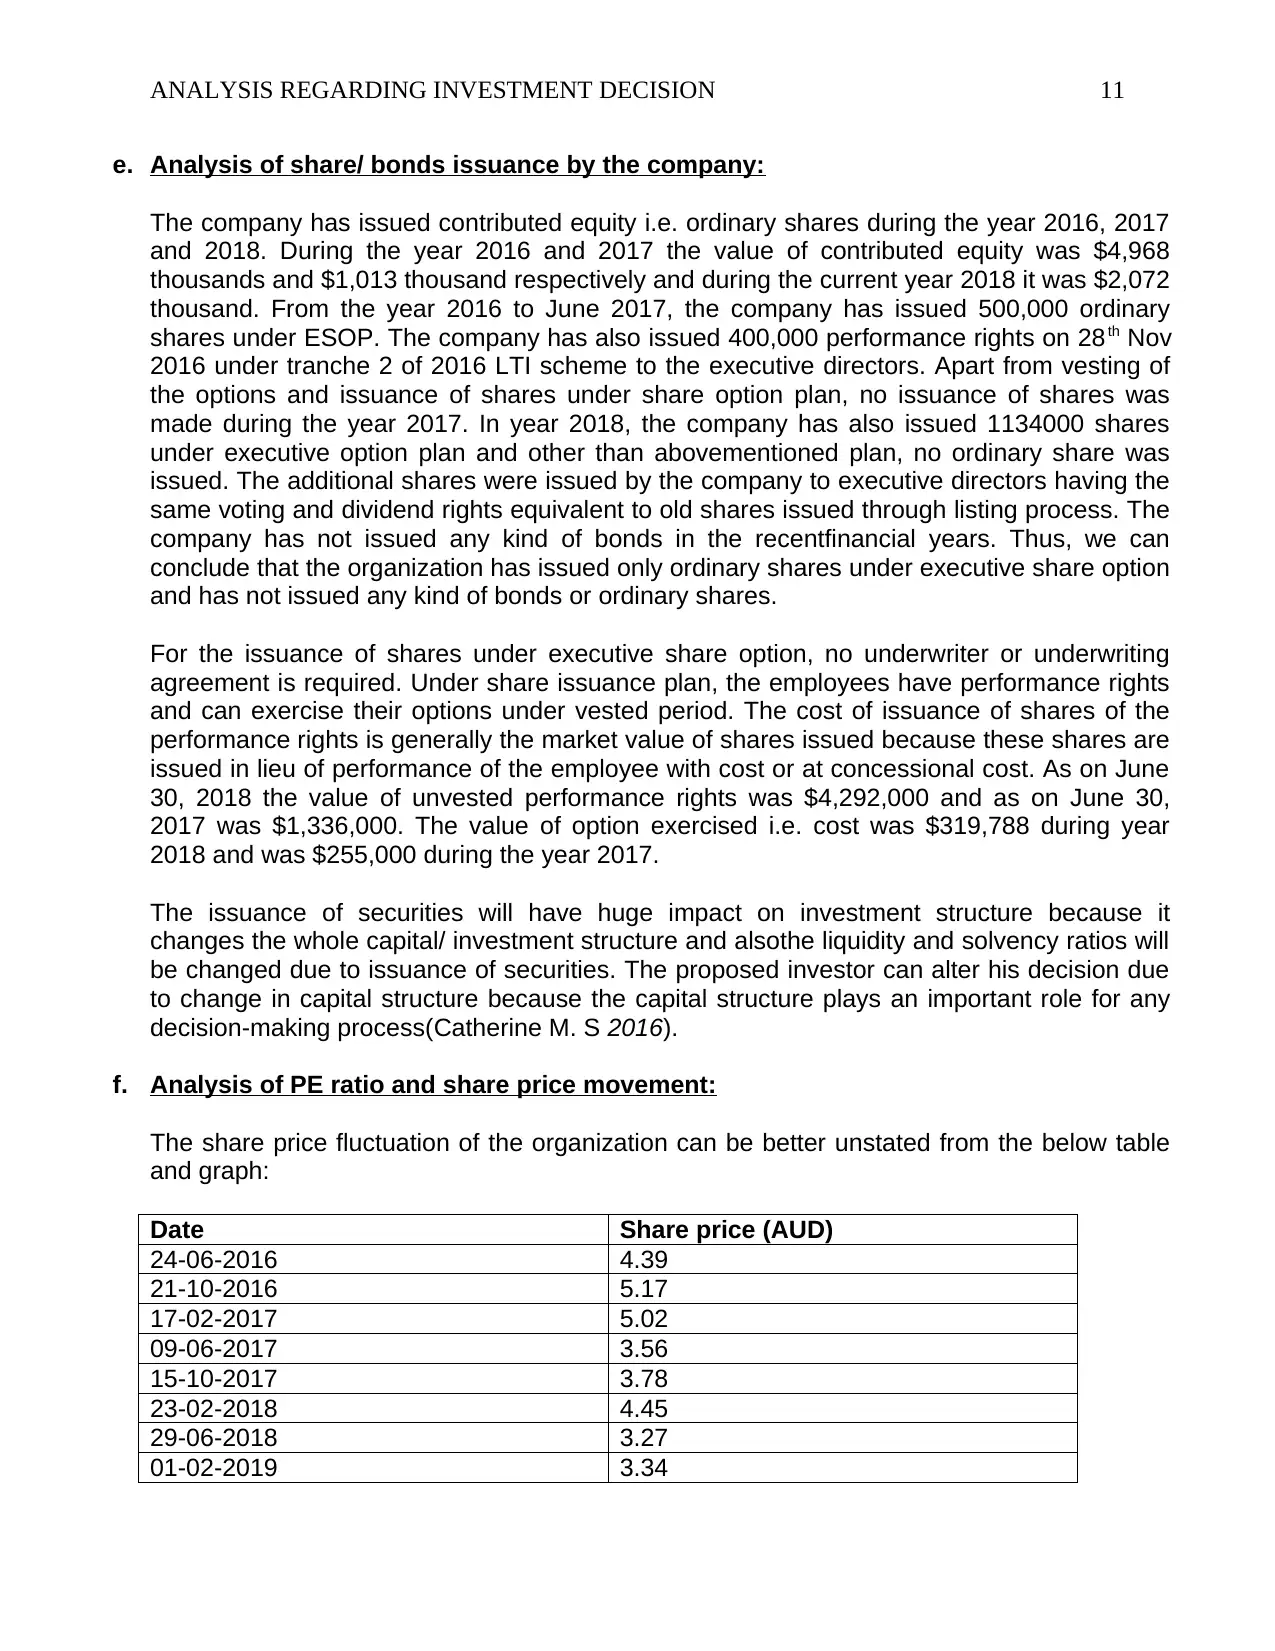
f. Analysis of PE ratio and share price movement:
The share price fluctuation of the organization can be better unstated from the below table
and graph:
Date Share price (AUD)
24-06-2016 4.39
21-10-2016 5.17
17-02-2017 5.02
09-06-2017 3.56
15-10-2017 3.78
23-02-2018 4.45
29-06-2018 3.27
01-02-2019 3.34
e. Analysis of share/ bonds issuance by the company:
The company has issued contributed equity i.e. ordinary shares during the year 2016, 2017
and 2018. During the year 2016 and 2017 the value of contributed equity was $4,968
thousands and $1,013 thousand respectively and during the current year 2018 it was $2,072
thousand. From the year 2016 to June 2017, the company has issued 500,000 ordinary
shares under ESOP. The company has also issued 400,000 performance rights on 28th Nov
2016 under tranche 2 of 2016 LTI scheme to the executive directors. Apart from vesting of
the options and issuance of shares under share option plan, no issuance of shares was
made during the year 2017. In year 2018, the company has also issued 1134000 shares
under executive option plan and other than abovementioned plan, no ordinary share was
issued. The additional shares were issued by the company to executive directors having the
same voting and dividend rights equivalent to old shares issued through listing process. The
company has not issued any kind of bonds in the recentfinancial years. Thus, we can
conclude that the organization has issued only ordinary shares under executive share option
and has not issued any kind of bonds or ordinary shares.
For the issuance of shares under executive share option, no underwriter or underwriting
agreement is required. Under share issuance plan, the employees have performance rights
and can exercise their options under vested period. The cost of issuance of shares of the
performance rights is generally the market value of shares issued because these shares are
issued in lieu of performance of the employee with cost or at concessional cost. As on June
30, 2018 the value of unvested performance rights was $4,292,000 and as on June 30,
2017 was $1,336,000. The value of option exercised i.e. cost was $319,788 during year
2018 and was $255,000 during the year 2017.
The issuance of securities will have huge impact on investment structure because it
changes the whole capital/ investment structure and alsothe liquidity and solvency ratios will
be changed due to issuance of securities. The proposed investor can alter his decision due
to change in capital structure because the capital structure plays an important role for any
decision-making process(Catherine M. S 2016).
f. Analysis of PE ratio and share price movement:
The share price fluctuation of the organization can be better unstated from the below table
and graph:
Date Share price (AUD)
24-06-2016 4.39
21-10-2016 5.17
17-02-2017 5.02
09-06-2017 3.56
15-10-2017 3.78
23-02-2018 4.45
29-06-2018 3.27
01-02-2019 3.34
ANALYSIS REGARDING INVESTMENT DECISION 12
31-05-2019 4.16
6/1/2016
8/1/2016
10/1/2016
12/1/2016
2/1/2017
4/1/2017
6/1/2017
8/1/2017
10/1/2017
12/1/2017
2/1/2018
4/1/2018
6/1/2018
8/1/2018
10/1/2018
12/1/2018
2/1/2019
4/1/2019
0
1
2
3
4
5
6
Share price
Share price
In the above table and graph, we can analyze that the share price of the organization is
volatile and fluctuating. The share price has shown upward and downward trend over the
period of three years. The share price was at high in year 2016 whereas in year 2017 the
share price decreased from AUD5.17 to AUD 3.78 per share. In year 2018 the share price
showed fluctuating trend but in year 2019 the share prices have started to rise and is
showing positive trend for the company.
The price earnings ratios of the company for three years are as below:
Year 2016 2017 2018
Price of the company 4.537 3.759 3.267
Earnings of the
company
0.3136 0.4035 0.3371
P/E ratio 14.47 9.39 9.69
The P/E ratio of the organization has decreased over the term of 3 years but in year 2018,
the P/E ratio has increased by slight margin due to increase in earnings. There is
divergence between the stock price and earnings of the company because the share prices
have decreased year on year basis whereas on other side the earnings have increased in
year 2017 but have declined in year 2018. Thus, we can conclude that in year 2018 the P/E
ratio has decreased in year 2017 but has been increased by slight margin in year 2018 and
the earnings have increased. The market movements are not favorable for the company but
the financial and earnings data are positive impact for the company(Barron, O. E. 2016).
The graph of PE ratio for three years can be better understood from below graph:
⊘ This is a preview!⊘
Do you want full access?
Subscribe today to unlock all pages.
Trusted by 1+ million students worldwide
1 out of 16
Related Documents


Your All-in-One AI-Powered Toolkit for Academic Success.
+13062052269
info@desklib.com
Available 24*7 on WhatsApp / Email
![[object Object]](/_next/static/media/star-bottom.7253800d.svg)
Unlock your academic potential
Copyright © 2020–2026 A2Z Services. All Rights Reserved. Developed and managed by ZUCOL.