Financial Statement Analysis, Ratio Calculation, and Reporting
VerifiedAdded on 2020/03/13
|6
|1165
|381
Homework Assignment
AI Summary
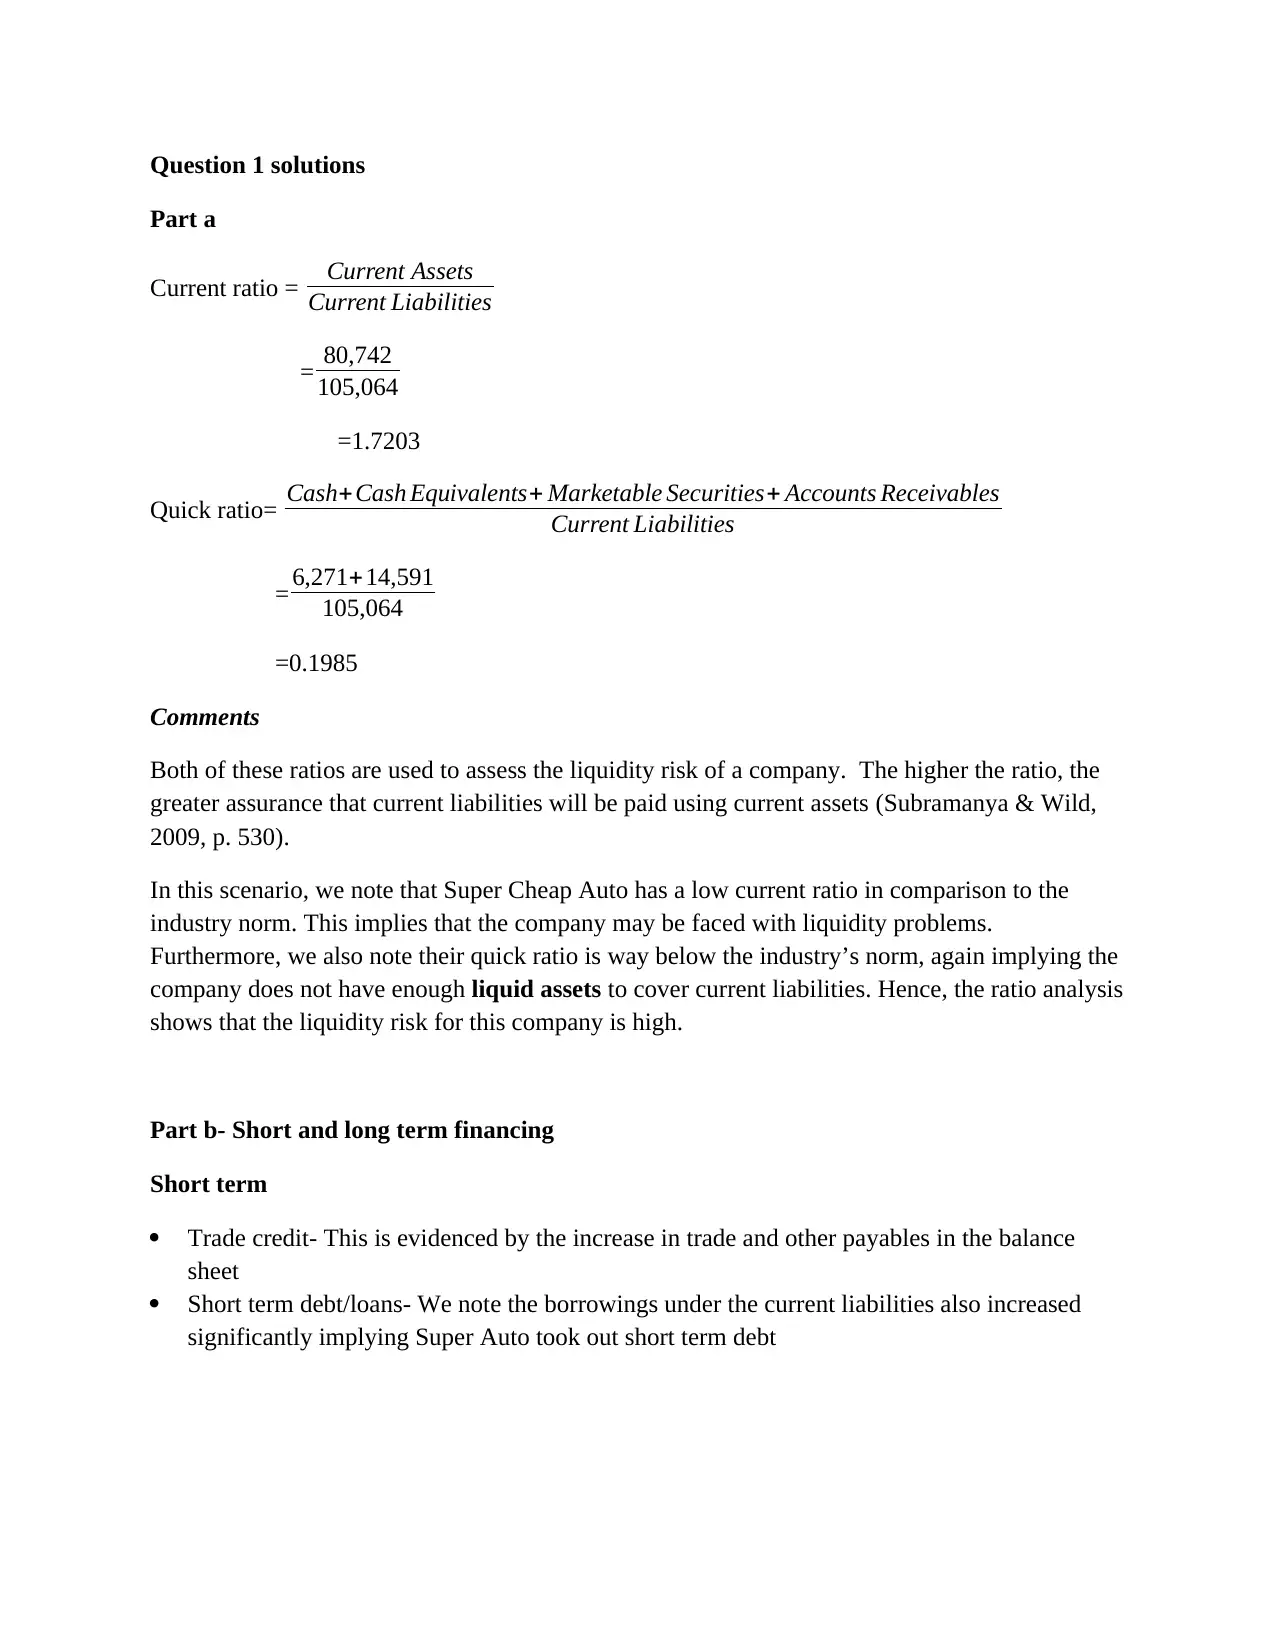
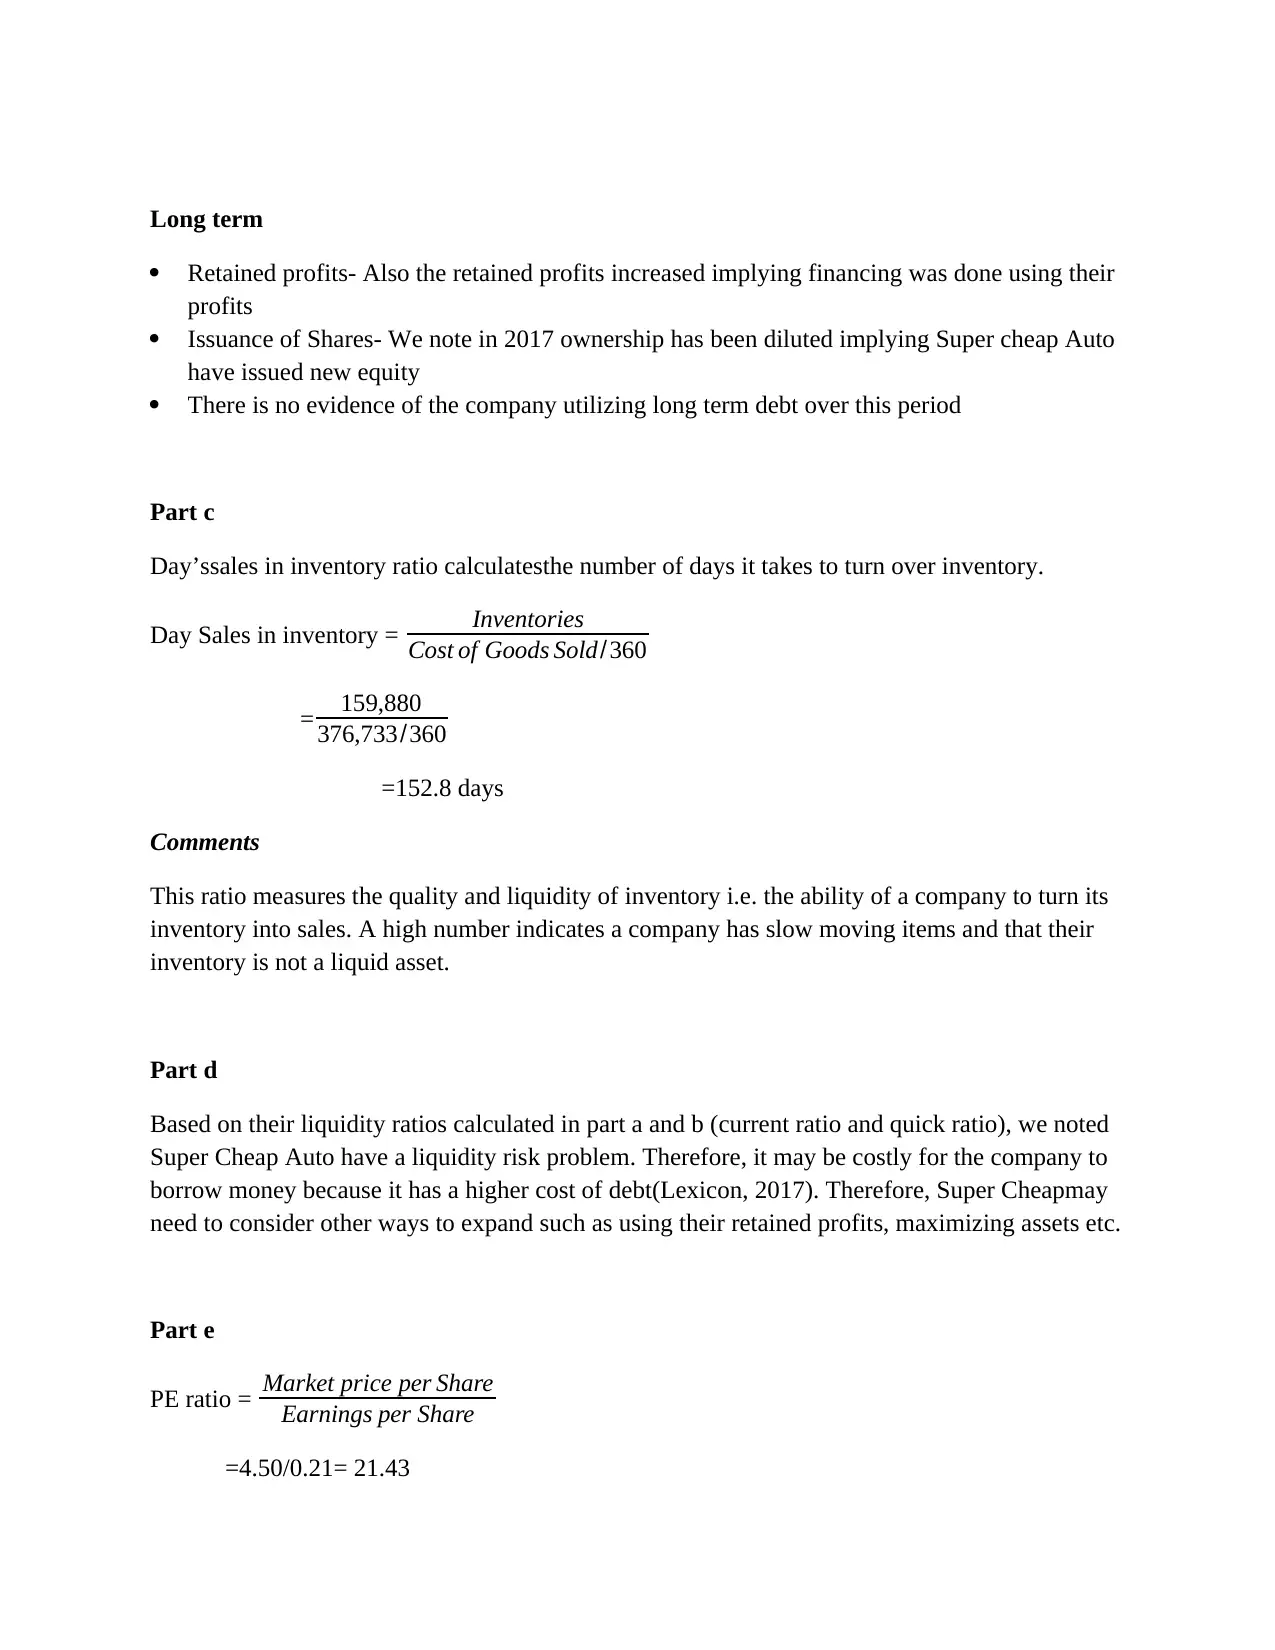
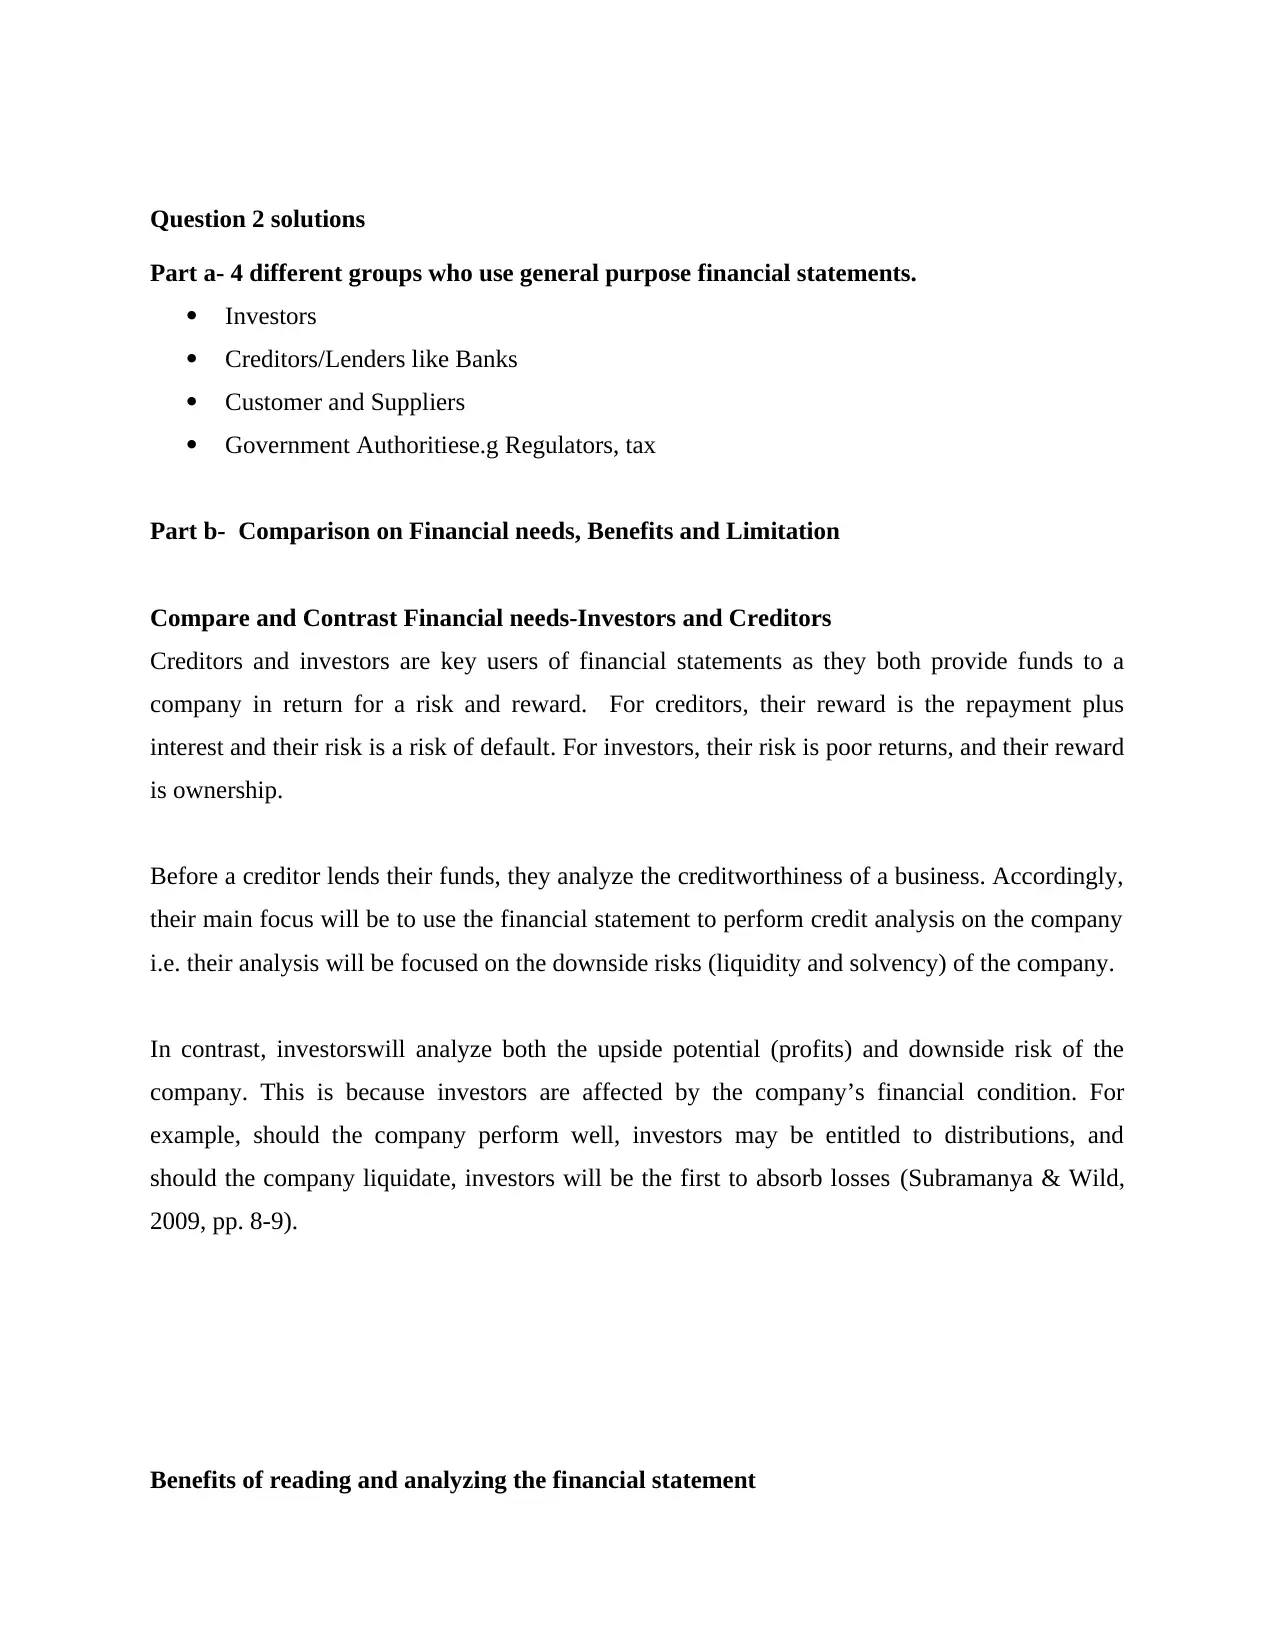
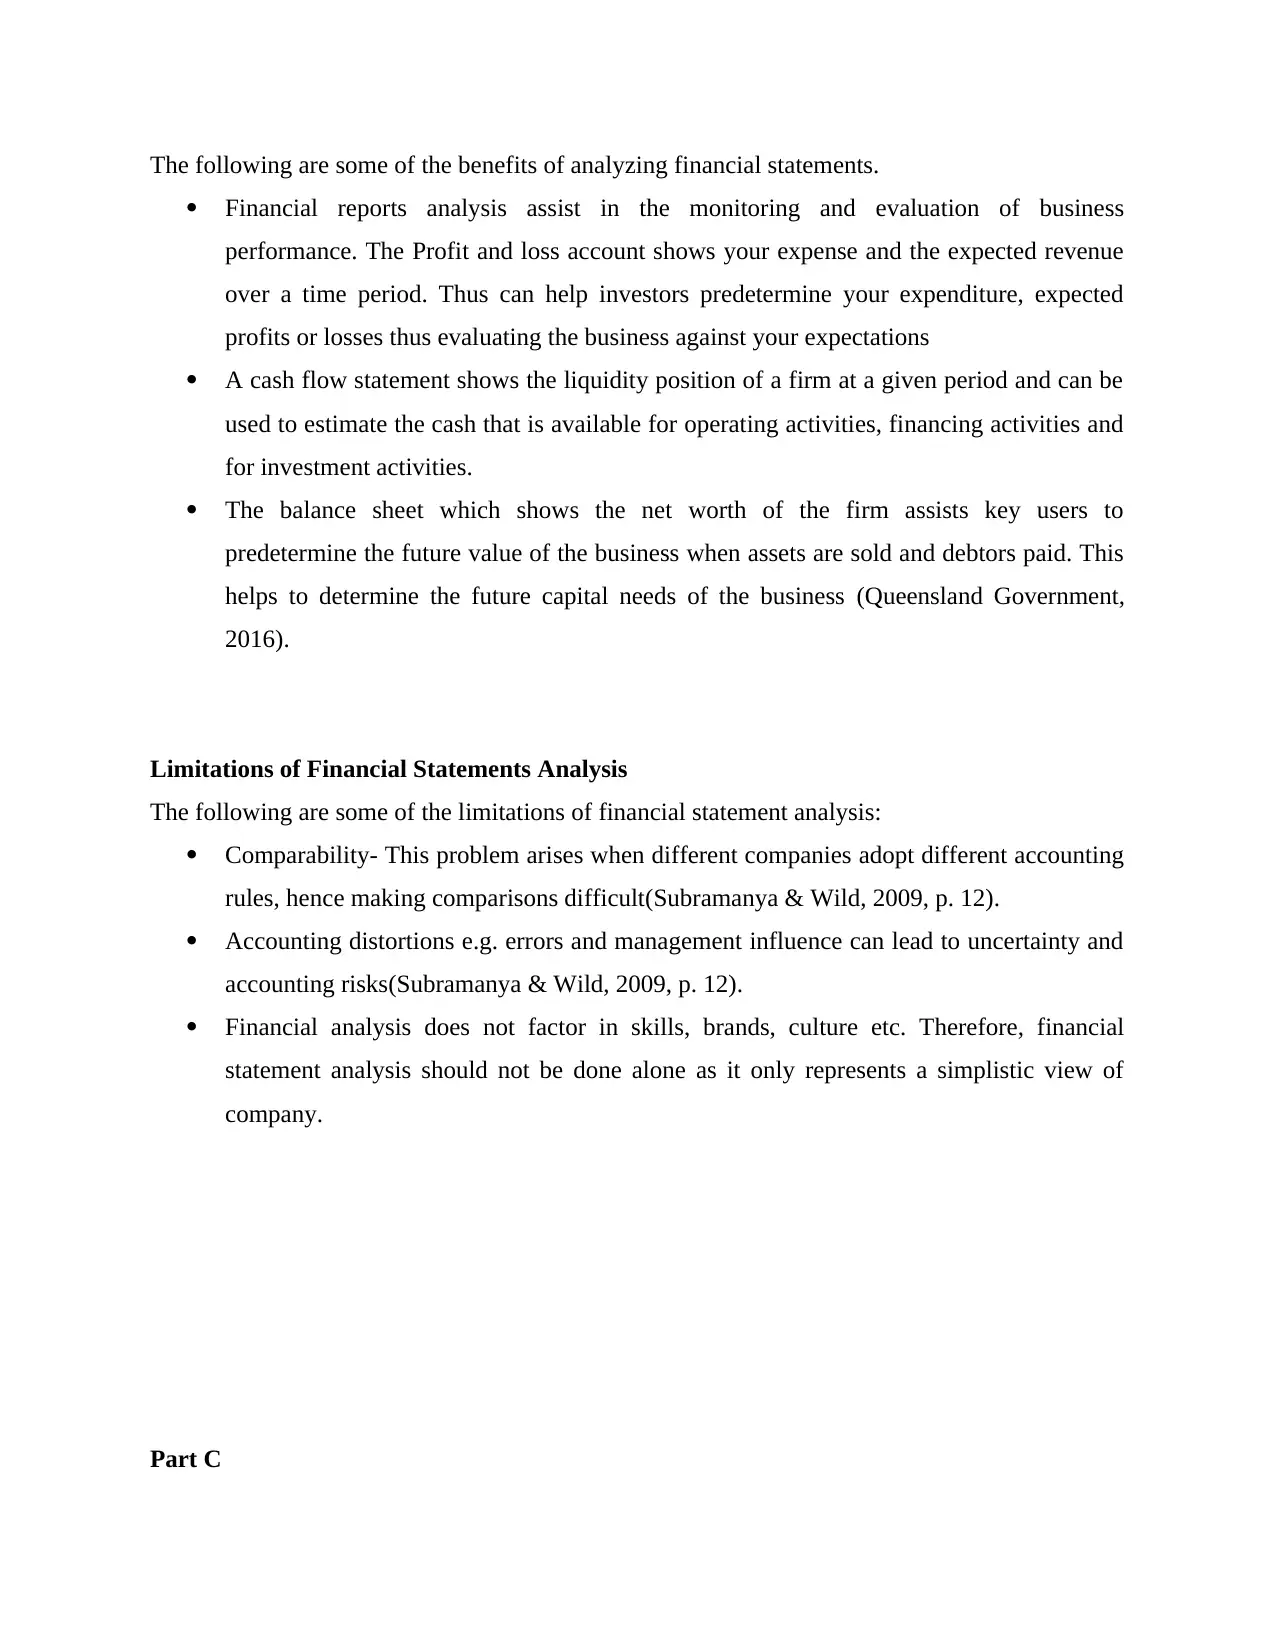
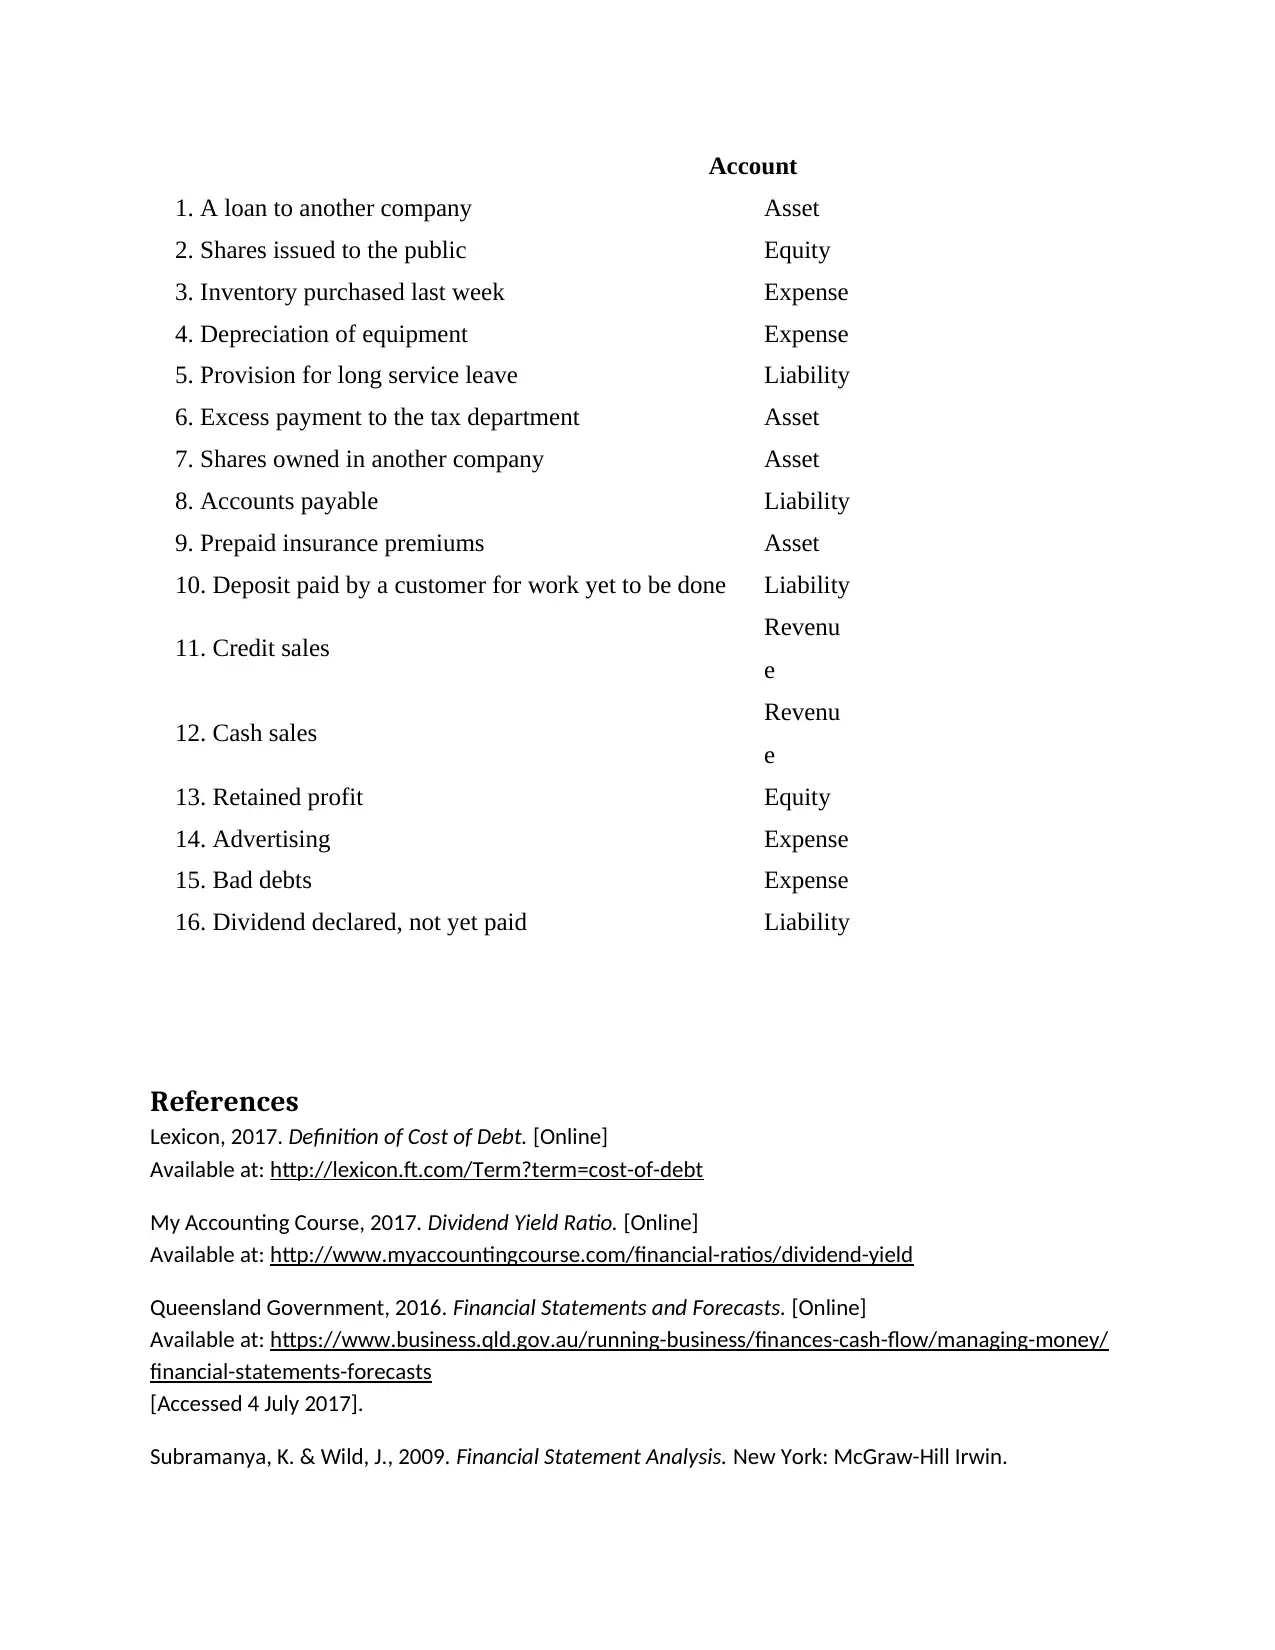
This homework assignment solution addresses key concepts in financial statement analysis. The solution begins with the calculation and interpretation of liquidity ratios, including the current and quick ratios, to assess a company's ability to meet its short-term obligations. It further analyzes short and long-term financing methods, such as trade credit, short-term debt, retained profits, and equity issuance. The solution then calculates the days sales in inventory ratio, providing insights into inventory management efficiency. The assignment also examines profitability ratios, like the PE ratio and dividend yield, and their implications for investors. The solution also identifies the different users of financial statements, their financial needs, benefits, and limitations of financial statement analysis. Finally, the solution categorizes various financial transactions into their appropriate accounting elements, such as assets, liabilities, equity, revenues, and expenses.

Question 1 solutions
Part a
Current ratio = Current Assets
Current Liabilities
= 80,742
105,064
=1.7203
Quick ratio= Cash+ Cash Equivalents+ Marketable Securities+ Accounts Receivables
Current Liabilities
= 6,271+14,591
105,064
=0.1985
Comments
Both of these ratios are used to assess the liquidity risk of a company. The higher the ratio, the
greater assurance that current liabilities will be paid using current assets (Subramanya & Wild,
2009, p. 530).
In this scenario, we note that Super Cheap Auto has a low current ratio in comparison to the
industry norm. This implies that the company may be faced with liquidity problems.
Furthermore, we also note their quick ratio is way below the industry’s norm, again implying the
company does not have enough liquid assets to cover current liabilities. Hence, the ratio analysis
shows that the liquidity risk for this company is high.
Part b- Short and long term financing
Short term
Trade credit- This is evidenced by the increase in trade and other payables in the balance
sheet
Short term debt/loans- We note the borrowings under the current liabilities also increased
significantly implying Super Auto took out short term debt
Paraphrase This Document
Need a fresh take? Get an instant paraphrase of this document with our AI Paraphraser

Long term
Retained profits- Also the retained profits increased implying financing was done using their
profits
Issuance of Shares- We note in 2017 ownership has been diluted implying Super cheap Auto
have issued new equity
There is no evidence of the company utilizing long term debt over this period
Part c
Day’ssales in inventory ratio calculatesthe number of days it takes to turn over inventory.
Day Sales in inventory = Inventories
Cost of Goods Sold/360
= 159,880
376,733/360
=152.8 days
Comments
This ratio measures the quality and liquidity of inventory i.e. the ability of a company to turn its
inventory into sales. A high number indicates a company has slow moving items and that their
inventory is not a liquid asset.
Part d
Based on their liquidity ratios calculated in part a and b (current ratio and quick ratio), we noted
Super Cheap Auto have a liquidity risk problem. Therefore, it may be costly for the company to
borrow money because it has a higher cost of debt(Lexicon, 2017). Therefore, Super Cheapmay
need to consider other ways to expand such as using their retained profits, maximizing assets etc.
Part e
PE ratio = Market price per Share
Earnings per Share
=4.50/0.21= 21.43

Dividend yield = Cash Dividends per share
Market price per share =0.105/4.50= 2.33%
Comments
In this scenario, we note that Super Cheap Auto has a higher PE ratio in comparison to the
sector’s average. This implies that investors have confidence in the future companyand/or the
company is entering its growth phase.
The dividend yieldratio is lower than the sector average implying the company does not issue
dividends regularly, but rather reinvest profits back into company(My Accounting Course,
2017).
⊘ This is a preview!⊘
Do you want full access?
Subscribe today to unlock all pages.

Trusted by 1+ million students worldwide

Question 2 solutions
Part a- 4 different groups who use general purpose financial statements.
Investors
Creditors/Lenders like Banks
Customer and Suppliers
Government Authoritiese.g Regulators, tax
Part b- Comparison on Financial needs, Benefits and Limitation
Compare and Contrast Financial needs-Investors and Creditors
Creditors and investors are key users of financial statements as they both provide funds to a
company in return for a risk and reward. For creditors, their reward is the repayment plus
interest and their risk is a risk of default. For investors, their risk is poor returns, and their reward
is ownership.
Before a creditor lends their funds, they analyze the creditworthiness of a business. Accordingly,
their main focus will be to use the financial statement to perform credit analysis on the company
i.e. their analysis will be focused on the downside risks (liquidity and solvency) of the company.
In contrast, investorswill analyze both the upside potential (profits) and downside risk of the
company. This is because investors are affected by the company’s financial condition. For
example, should the company perform well, investors may be entitled to distributions, and
should the company liquidate, investors will be the first to absorb losses (Subramanya & Wild,
2009, pp. 8-9).
Benefits of reading and analyzing the financial statement
Paraphrase This Document
Need a fresh take? Get an instant paraphrase of this document with our AI Paraphraser

The following are some of the benefits of analyzing financial statements.
Financial reports analysis assist in the monitoring and evaluation of business
performance. The Profit and loss account shows your expense and the expected revenue
over a time period. Thus can help investors predetermine your expenditure, expected
profits or losses thus evaluating the business against your expectations
A cash flow statement shows the liquidity position of a firm at a given period and can be
used to estimate the cash that is available for operating activities, financing activities and
for investment activities.
The balance sheet which shows the net worth of the firm assists key users to
predetermine the future value of the business when assets are sold and debtors paid. This
helps to determine the future capital needs of the business (Queensland Government,
2016).
Limitations of Financial Statements Analysis
The following are some of the limitations of financial statement analysis:
Comparability- This problem arises when different companies adopt different accounting
rules, hence making comparisons difficult(Subramanya & Wild, 2009, p. 12).
Accounting distortions e.g. errors and management influence can lead to uncertainty and
accounting risks(Subramanya & Wild, 2009, p. 12).
Financial analysis does not factor in skills, brands, culture etc. Therefore, financial
statement analysis should not be done alone as it only represents a simplistic view of
company.
Part C

Account
1. A loan to another company Asset
2. Shares issued to the public Equity
3. Inventory purchased last week Expense
4. Depreciation of equipment Expense
5. Provision for long service leave Liability
6. Excess payment to the tax department Asset
7. Shares owned in another company Asset
8. Accounts payable Liability
9. Prepaid insurance premiums Asset
10. Deposit paid by a customer for work yet to be done Liability
11. Credit sales Revenu
e
12. Cash sales Revenu
e
13. Retained profit Equity
14. Advertising Expense
15. Bad debts Expense
16. Dividend declared, not yet paid Liability
References
Lexicon, 2017. Definition of Cost of Debt. [Online]
Available at: http://lexicon.ft.com/Term?term=cost-of-debt
My Accounting Course, 2017. Dividend Yield Ratio. [Online]
Available at: http://www.myaccountingcourse.com/financial-ratios/dividend-yield
Queensland Government, 2016. Financial Statements and Forecasts. [Online]
Available at: https://www.business.qld.gov.au/running-business/finances-cash-flow/managing-money/
financial-statements-forecasts
[Accessed 4 July 2017].
Subramanya, K. & Wild, J., 2009. Financial Statement Analysis. New York: McGraw-Hill Irwin.
⊘ This is a preview!⊘
Do you want full access?
Subscribe today to unlock all pages.

Trusted by 1+ million students worldwide
1 out of 6
Related Documents
Your All-in-One AI-Powered Toolkit for Academic Success.
+13062052269
info@desklib.com
Available 24*7 on WhatsApp / Email
Unlock your academic potential
Copyright © 2020–2025 A2Z Services. All Rights Reserved. Developed and managed by ZUCOL.


