Evaluating Financial Performance: A Report on Honeywell Plc (2017)
VerifiedAdded on 2020/07/22
|21
|4989
|102
Report
AI Summary
This report presents a comprehensive financial analysis of Honeywell Plc, evaluating its performance through ratio analysis, including profitability, liquidity, gearing, and efficiency ratios. The report highlights the decline in profitability and liquidity in 2016 compared to 2015 and suggests strategic actions to improve financial performance. It calculates the working capital cycle, identifying an increase in working capital days in 2016, and discusses the break-even point (BEP) and margin of safety for Thompson Ltd, along with a critical evaluation of the assumptions associated with the BEP model. The report also assesses internal and external sources of finance and evaluates investment appraisal techniques, providing a detailed overview of financial management principles and their application to real-world business scenarios. The analysis covers various aspects of financial health, offering insights into decision-making and strategic planning for the company.

Financial Management
Paraphrase This Document
Need a fresh take? Get an instant paraphrase of this document with our AI Paraphraser
TABLE OF CONTENTS
1. Preparing a report for BOD of Honeywell Plc in relation to evaluating financial
performance.................................................................................................................................1
To,....................................................................................................................................................1
2. Calculating working capital cycle for Honeywell Plc.............................................................6
PART B...........................................................................................................................................8
1. Calculating BEP and margin of safety for Thompson Ltd......................................................8
2. Critically evaluating the key assumptions that are associated with BEP model.....................8
PART C.........................................................................................................................................10
1. Assessing the internal and external sources of finance that can be undertaken by business.10
2. Critically evaluating the investment appraisal techniques that are available for business....12
REFERENCES..............................................................................................................................15
APPENDIX....................................................................................................................................16

1. Preparing a report for BOD of Honeywell Plc in relation to evaluating financial performance
⊘ This is a preview!⊘
Do you want full access?
Subscribe today to unlock all pages.
Trusted by 1+ million students worldwide
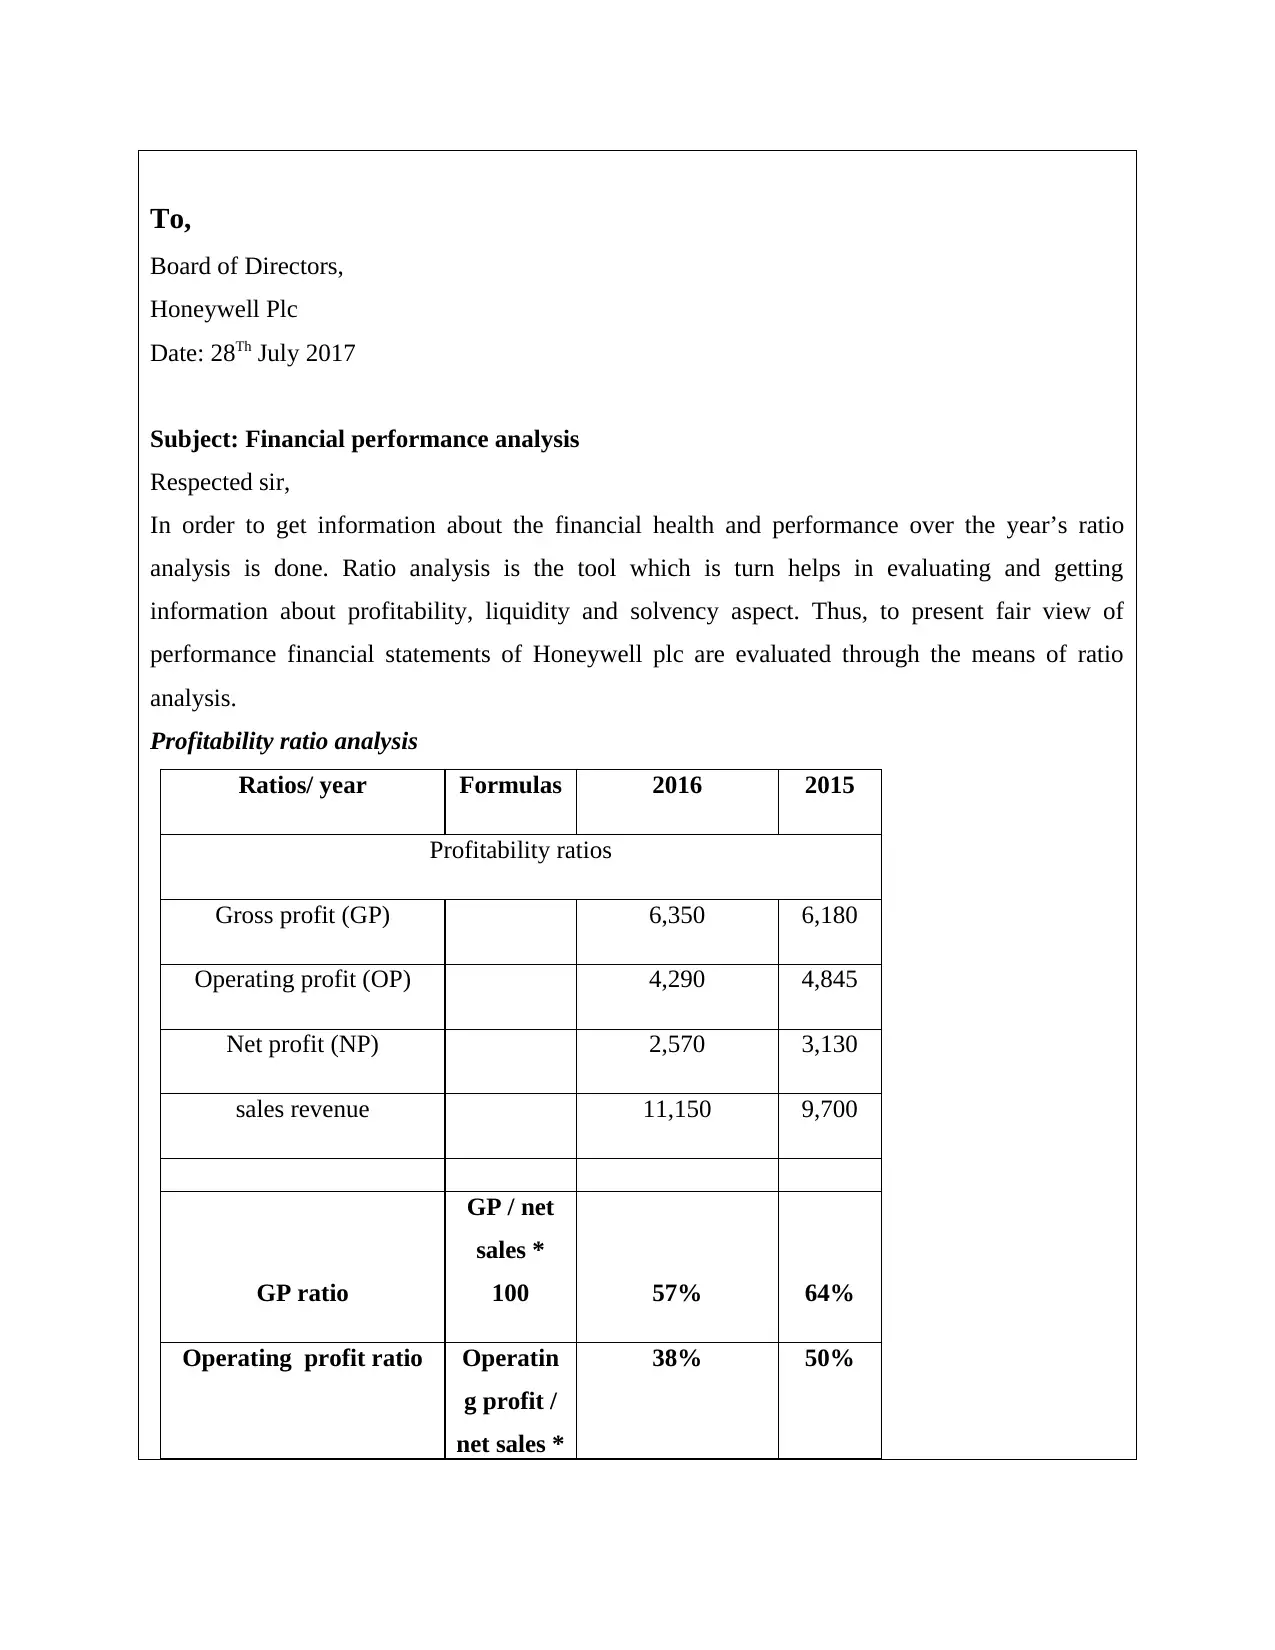
To,
Board of Directors,
Honeywell Plc
Date: 28Th July 2017
Subject: Financial performance analysis
Respected sir,
In order to get information about the financial health and performance over the year’s ratio
analysis is done. Ratio analysis is the tool which is turn helps in evaluating and getting
information about profitability, liquidity and solvency aspect. Thus, to present fair view of
performance financial statements of Honeywell plc are evaluated through the means of ratio
analysis.
Profitability ratio analysis
Ratios/ year Formulas 2016 2015
Profitability ratios
Gross profit (GP) 6,350 6,180
Operating profit (OP) 4,290 4,845
Net profit (NP) 2,570 3,130
sales revenue 11,150 9,700
GP ratio
GP / net
sales *
100 57% 64%
Operating profit ratio Operatin
g profit /
net sales *
38% 50%
Paraphrase This Document
Need a fresh take? Get an instant paraphrase of this document with our AI Paraphraser
100
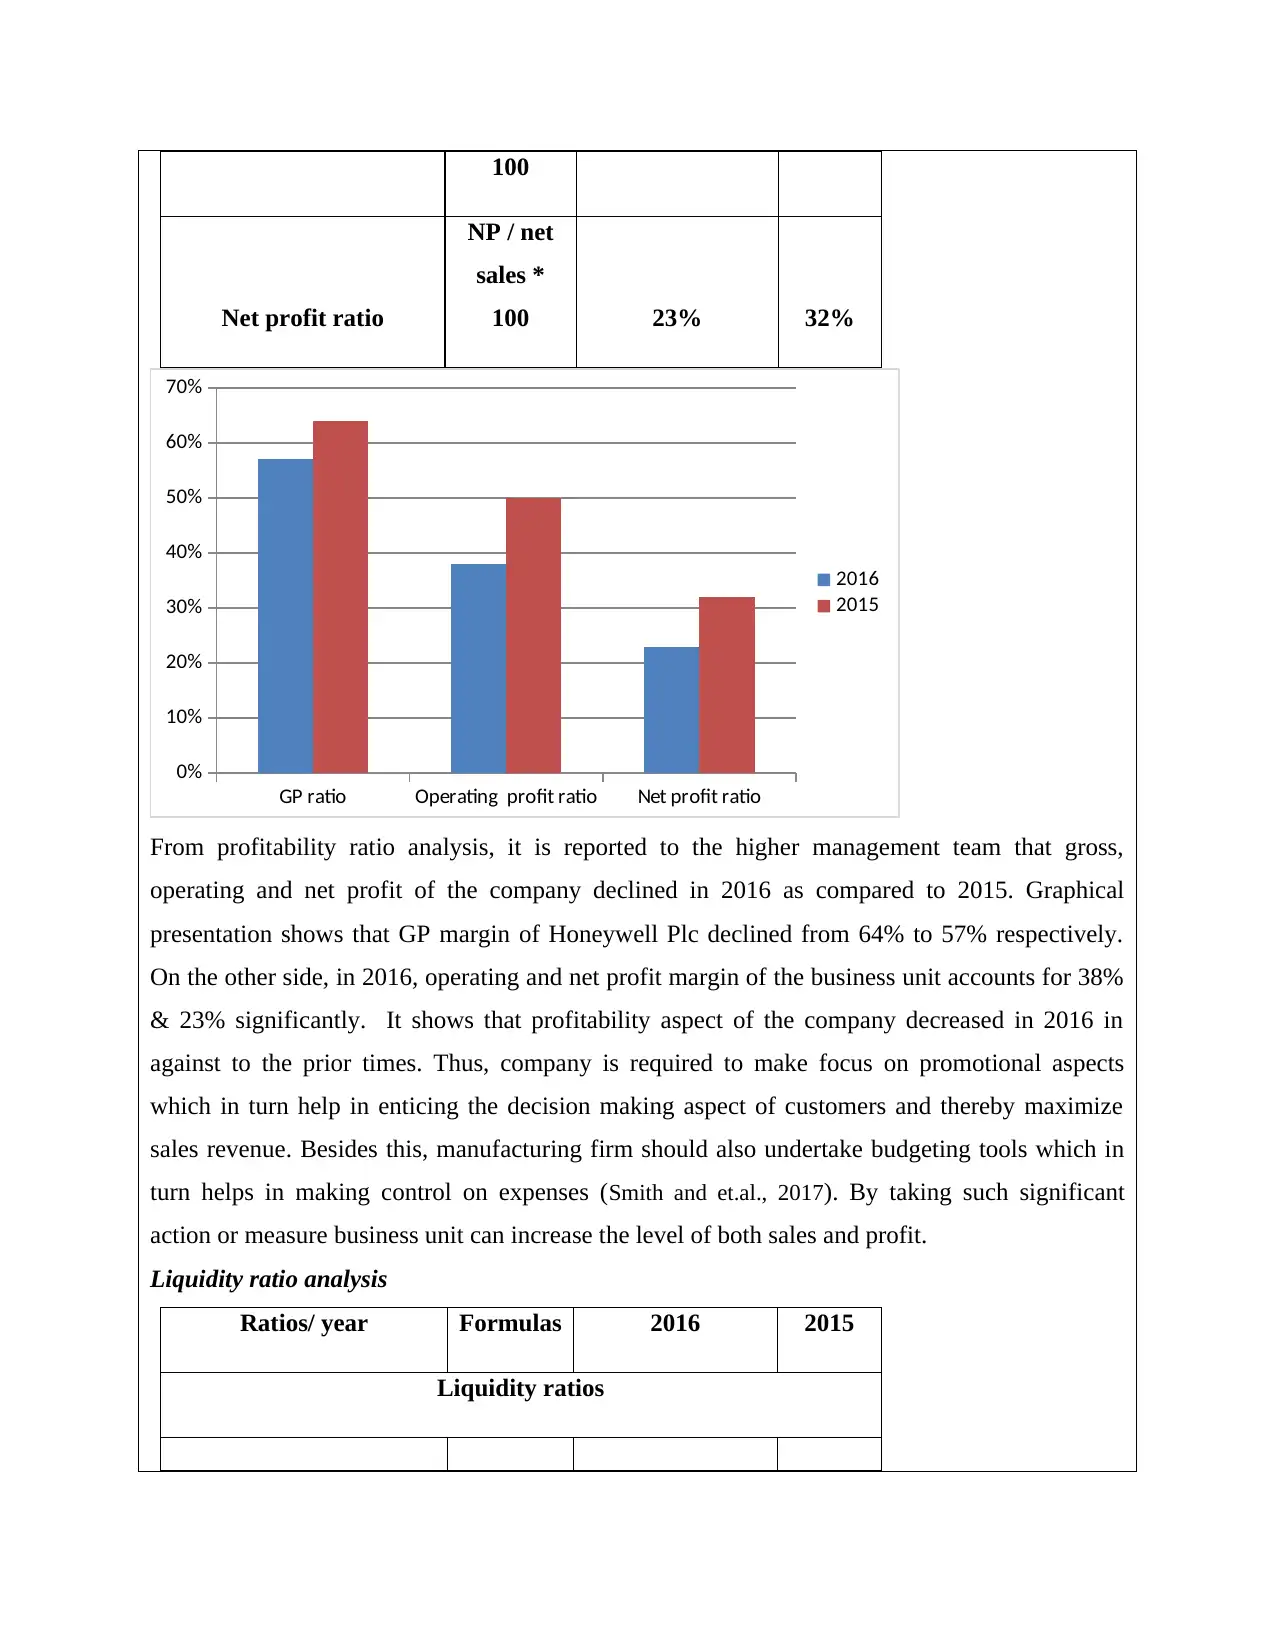
Net profit ratio
NP / net
sales *
100 23% 32%
GP ratio Operating profit ratio Net profit ratio
0%
10%
20%
30%
40%
50%
60%
70%
2016
2015
From profitability ratio analysis, it is reported to the higher management team that gross,
operating and net profit of the company declined in 2016 as compared to 2015. Graphical
presentation shows that GP margin of Honeywell Plc declined from 64% to 57% respectively.
On the other side, in 2016, operating and net profit margin of the business unit accounts for 38%
& 23% significantly. It shows that profitability aspect of the company decreased in 2016 in
against to the prior times. Thus, company is required to make focus on promotional aspects
which in turn help in enticing the decision making aspect of customers and thereby maximize
sales revenue. Besides this, manufacturing firm should also undertake budgeting tools which in
turn helps in making control on expenses (Smith and et.al., 2017). By taking such significant
action or measure business unit can increase the level of both sales and profit.
Liquidity ratio analysis
Ratios/ year Formulas 2016 2015
Liquidity ratios
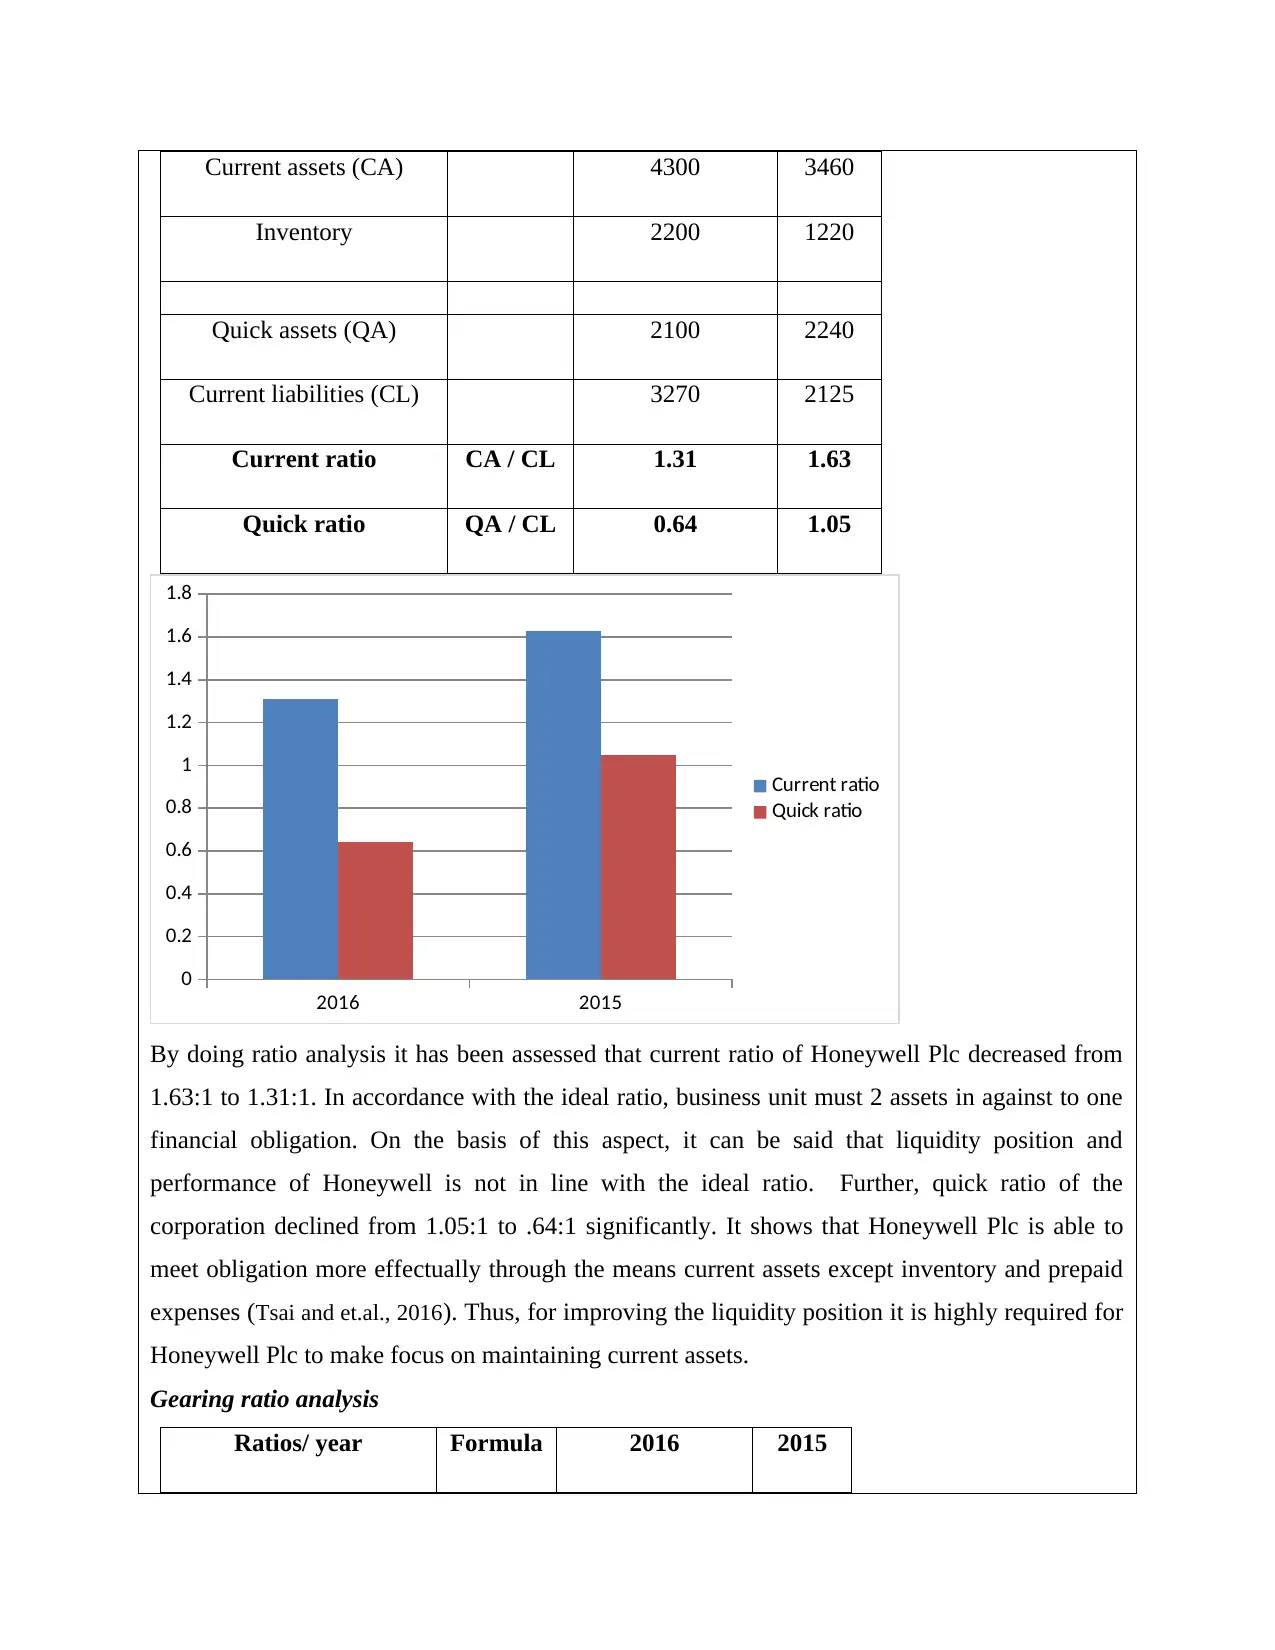
Current assets (CA) 4300 3460
Inventory 2200 1220
Quick assets (QA) 2100 2240
Current liabilities (CL) 3270 2125
Current ratio CA / CL 1.31 1.63
Quick ratio QA / CL 0.64 1.05
2016 2015
0
0.2
0.4
0.6
0.8
1
1.2
1.4
1.6
1.8
Current ratio
Quick ratio
By doing ratio analysis it has been assessed that current ratio of Honeywell Plc decreased from
1.63:1 to 1.31:1. In accordance with the ideal ratio, business unit must 2 assets in against to one
financial obligation. On the basis of this aspect, it can be said that liquidity position and
performance of Honeywell is not in line with the ideal ratio. Further, quick ratio of the
corporation declined from 1.05:1 to .64:1 significantly. It shows that Honeywell Plc is able to
meet obligation more effectually through the means current assets except inventory and prepaid
expenses (Tsai and et.al., 2016). Thus, for improving the liquidity position it is highly required for
Honeywell Plc to make focus on maintaining current assets.
Gearing ratio analysis
Ratios/ year Formula 2016 2015
⊘ This is a preview!⊘
Do you want full access?
Subscribe today to unlock all pages.
Trusted by 1+ million students worldwide
s
long-term loan capital 8000 3895
total capital employed
(7330 + 8070 +
8000) = 23400
(7330
+7000
+
3895)
=
18225
Debt-equity ratio
Long-
term loan
capital /
Total
capital
employe
d * 100 34.19%
21.37
%
2016 2015
0.00%
5.00%
10.00%
15.00%
20.00%
25.00%
30.00%
35.00%
40.00%
Debt-equity ratio
Debt-equity ratio
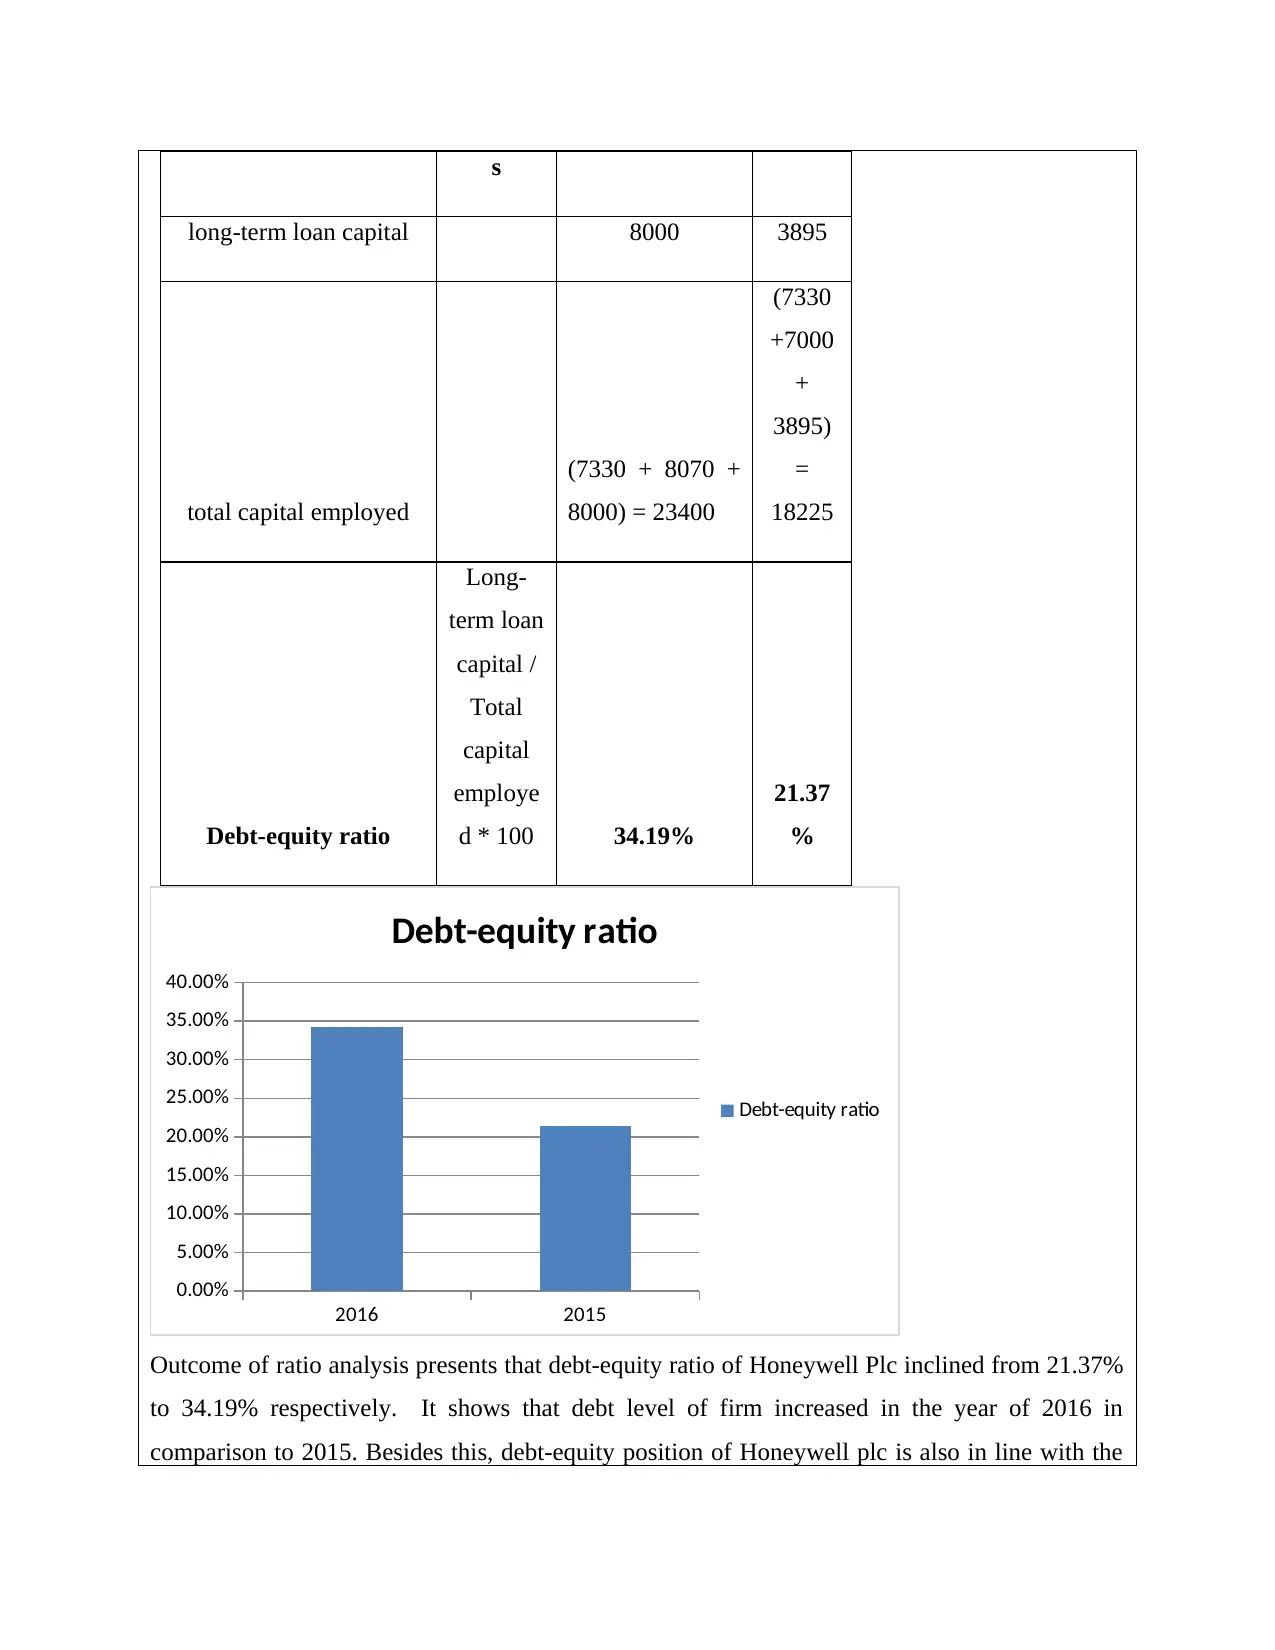
Outcome of ratio analysis presents that debt-equity ratio of Honeywell Plc inclined from 21.37%
to 34.19% respectively. It shows that debt level of firm increased in the year of 2016 in
comparison to 2015. Besides this, debt-equity position of Honeywell plc is also in line with the
long-term loan capital 8000 3895
total capital employed
(7330 + 8070 +
8000) = 23400
(7330
+7000
+
3895)
=
18225
Debt-equity ratio
Long-
term loan
capital /
Total
capital
employe
d * 100 34.19%
21.37
%
2016 2015
0.00%
5.00%
10.00%
15.00%
20.00%
25.00%
30.00%
35.00%
40.00%
Debt-equity ratio
Debt-equity ratio
Outcome of ratio analysis presents that debt-equity ratio of Honeywell Plc inclined from 21.37%
to 34.19% respectively. It shows that debt level of firm increased in the year of 2016 in
comparison to 2015. Besides this, debt-equity position of Honeywell plc is also in line with the
Paraphrase This Document
Need a fresh take? Get an instant paraphrase of this document with our AI Paraphraser
ideal ratio such as .5:1. Hence, it can be presented that solvency position and performance of
company is sound.
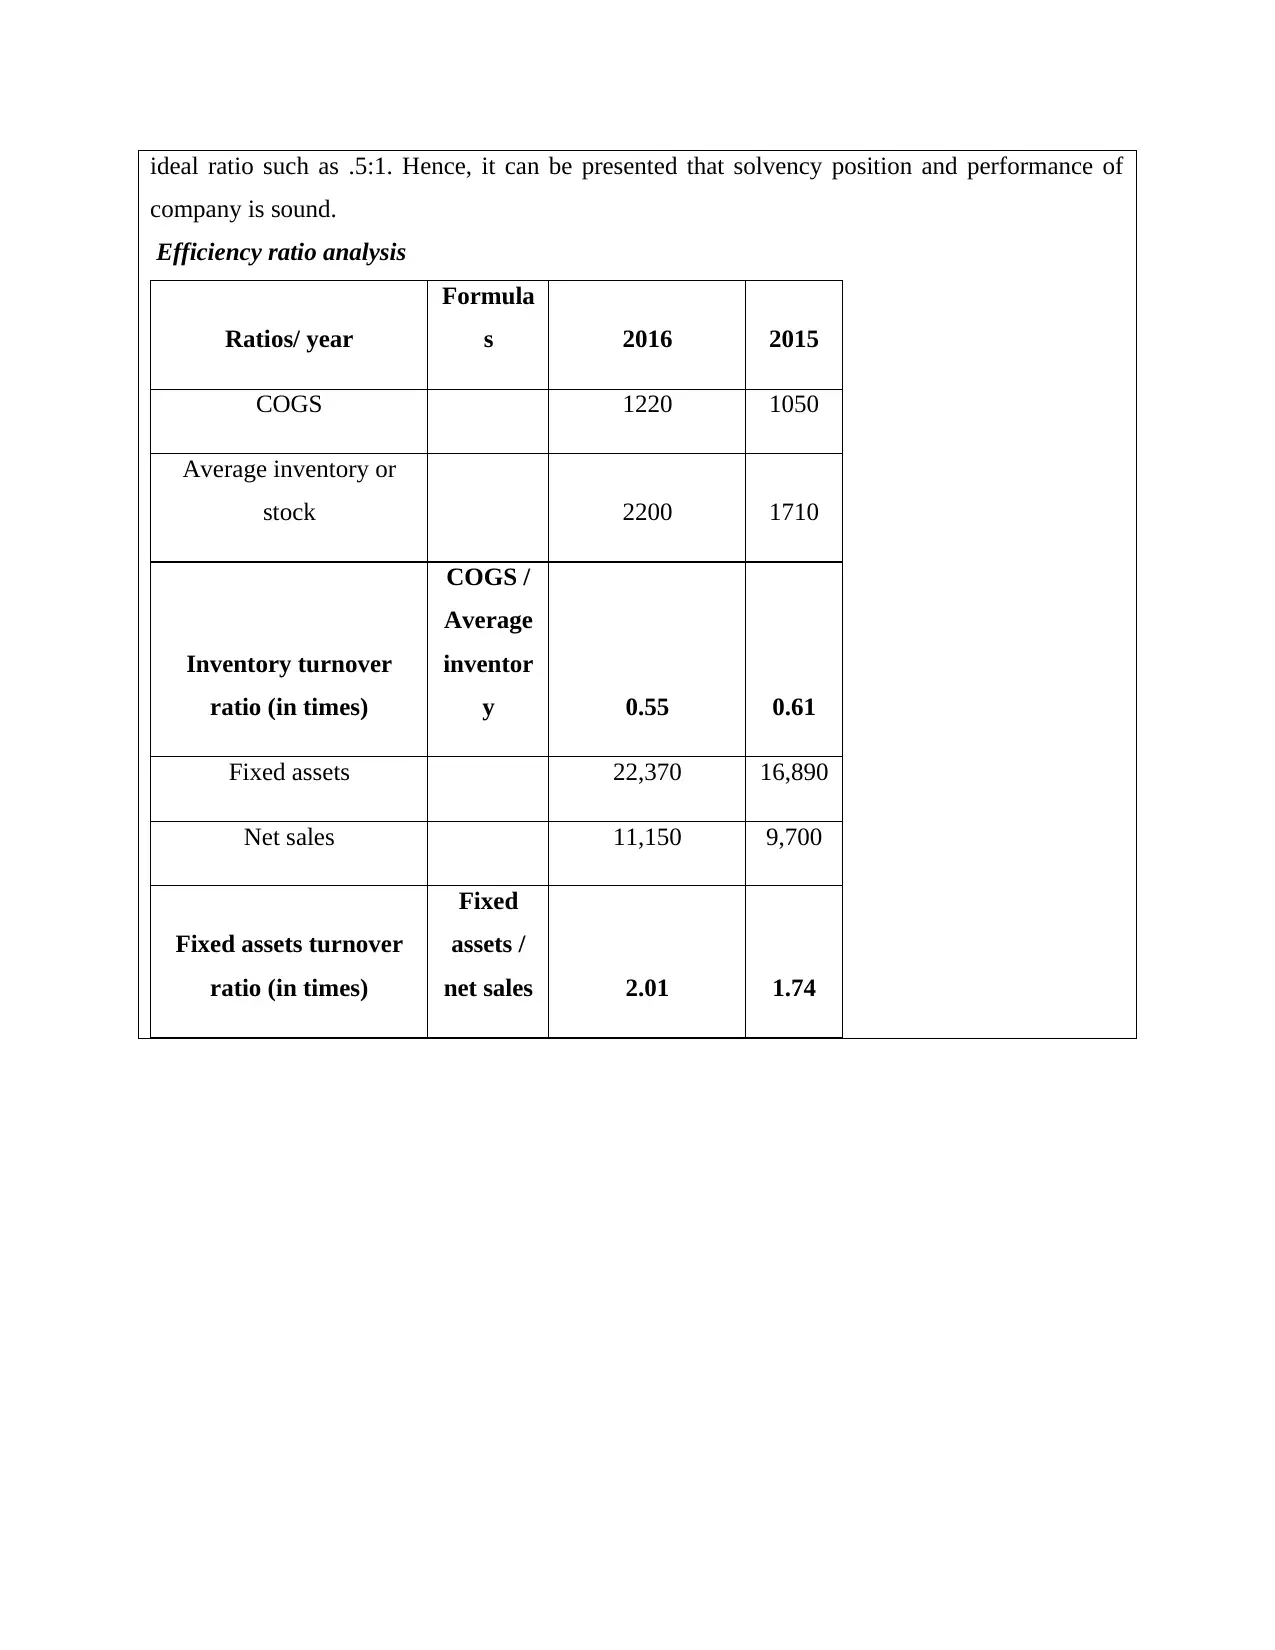
Efficiency ratio analysis
Ratios/ year
Formula
s 2016 2015
COGS 1220 1050
Average inventory or
stock 2200 1710
Inventory turnover
ratio (in times)
COGS /
Average
inventor
y 0.55 0.61
Fixed assets 22,370 16,890
Net sales 11,150 9,700
Fixed assets turnover
ratio (in times)
Fixed
assets /
net sales 2.01 1.74
company is sound.
Efficiency ratio analysis
Ratios/ year
Formula
s 2016 2015
COGS 1220 1050
Average inventory or
stock 2200 1710
Inventory turnover
ratio (in times)
COGS /
Average
inventor
y 0.55 0.61
Fixed assets 22,370 16,890
Net sales 11,150 9,700
Fixed assets turnover
ratio (in times)
Fixed
assets /
net sales 2.01 1.74
2016 2015
0
0.5
1
1.5
2
2.5
Inventory turnover ratio
Fixed assets turnover ratio
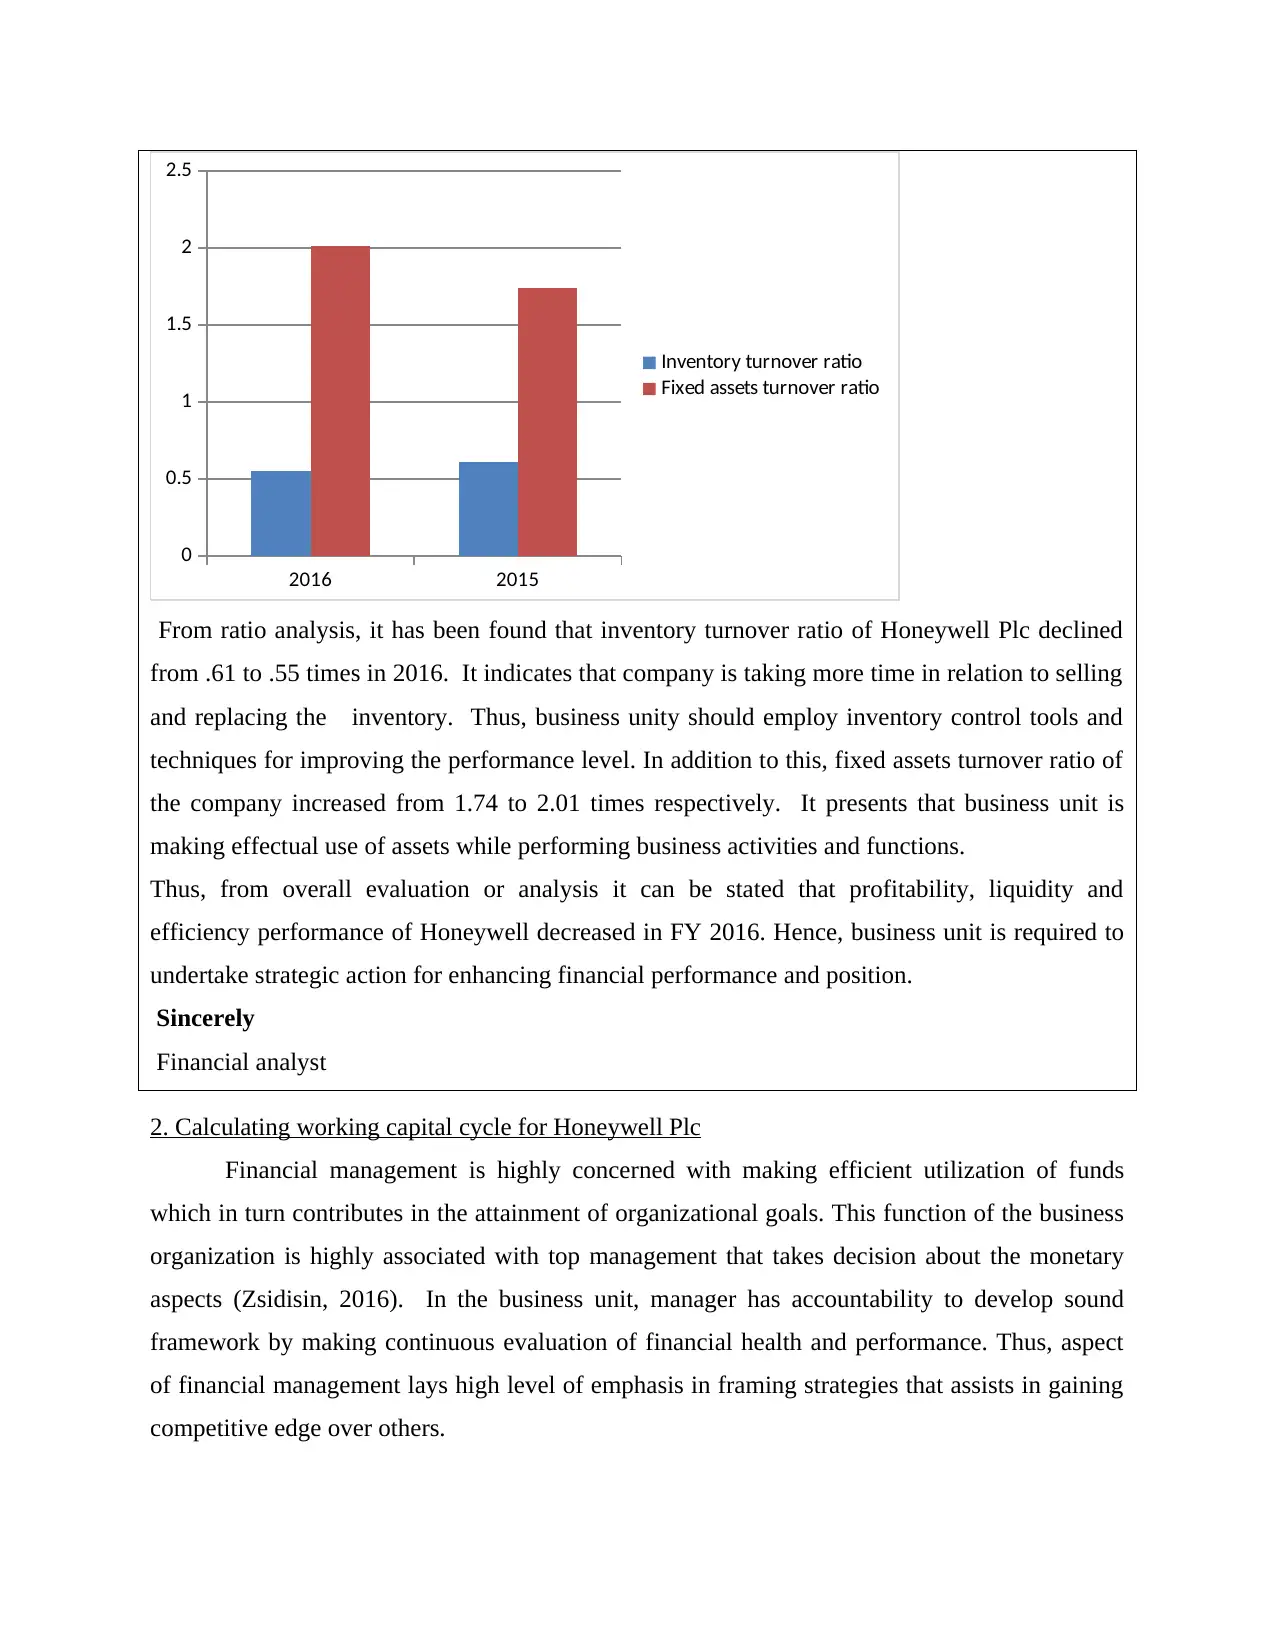
From ratio analysis, it has been found that inventory turnover ratio of Honeywell Plc declined
from .61 to .55 times in 2016. It indicates that company is taking more time in relation to selling
and replacing the inventory. Thus, business unity should employ inventory control tools and
techniques for improving the performance level. In addition to this, fixed assets turnover ratio of
the company increased from 1.74 to 2.01 times respectively. It presents that business unit is
making effectual use of assets while performing business activities and functions.
Thus, from overall evaluation or analysis it can be stated that profitability, liquidity and
efficiency performance of Honeywell decreased in FY 2016. Hence, business unit is required to
undertake strategic action for enhancing financial performance and position.
Sincerely
Financial analyst
2. Calculating working capital cycle for Honeywell Plc
Financial management is highly concerned with making efficient utilization of funds
which in turn contributes in the attainment of organizational goals. This function of the business
organization is highly associated with top management that takes decision about the monetary
aspects (Zsidisin, 2016). In the business unit, manager has accountability to develop sound
framework by making continuous evaluation of financial health and performance. Thus, aspect
of financial management lays high level of emphasis in framing strategies that assists in gaining
competitive edge over others.
0
0.5
1
1.5
2
2.5
Inventory turnover ratio
Fixed assets turnover ratio
From ratio analysis, it has been found that inventory turnover ratio of Honeywell Plc declined
from .61 to .55 times in 2016. It indicates that company is taking more time in relation to selling
and replacing the inventory. Thus, business unity should employ inventory control tools and
techniques for improving the performance level. In addition to this, fixed assets turnover ratio of
the company increased from 1.74 to 2.01 times respectively. It presents that business unit is
making effectual use of assets while performing business activities and functions.
Thus, from overall evaluation or analysis it can be stated that profitability, liquidity and
efficiency performance of Honeywell decreased in FY 2016. Hence, business unit is required to
undertake strategic action for enhancing financial performance and position.
Sincerely
Financial analyst
2. Calculating working capital cycle for Honeywell Plc
Financial management is highly concerned with making efficient utilization of funds
which in turn contributes in the attainment of organizational goals. This function of the business
organization is highly associated with top management that takes decision about the monetary
aspects (Zsidisin, 2016). In the business unit, manager has accountability to develop sound
framework by making continuous evaluation of financial health and performance. Thus, aspect
of financial management lays high level of emphasis in framing strategies that assists in gaining
competitive edge over others.
⊘ This is a preview!⊘
Do you want full access?
Subscribe today to unlock all pages.
Trusted by 1+ million students worldwide
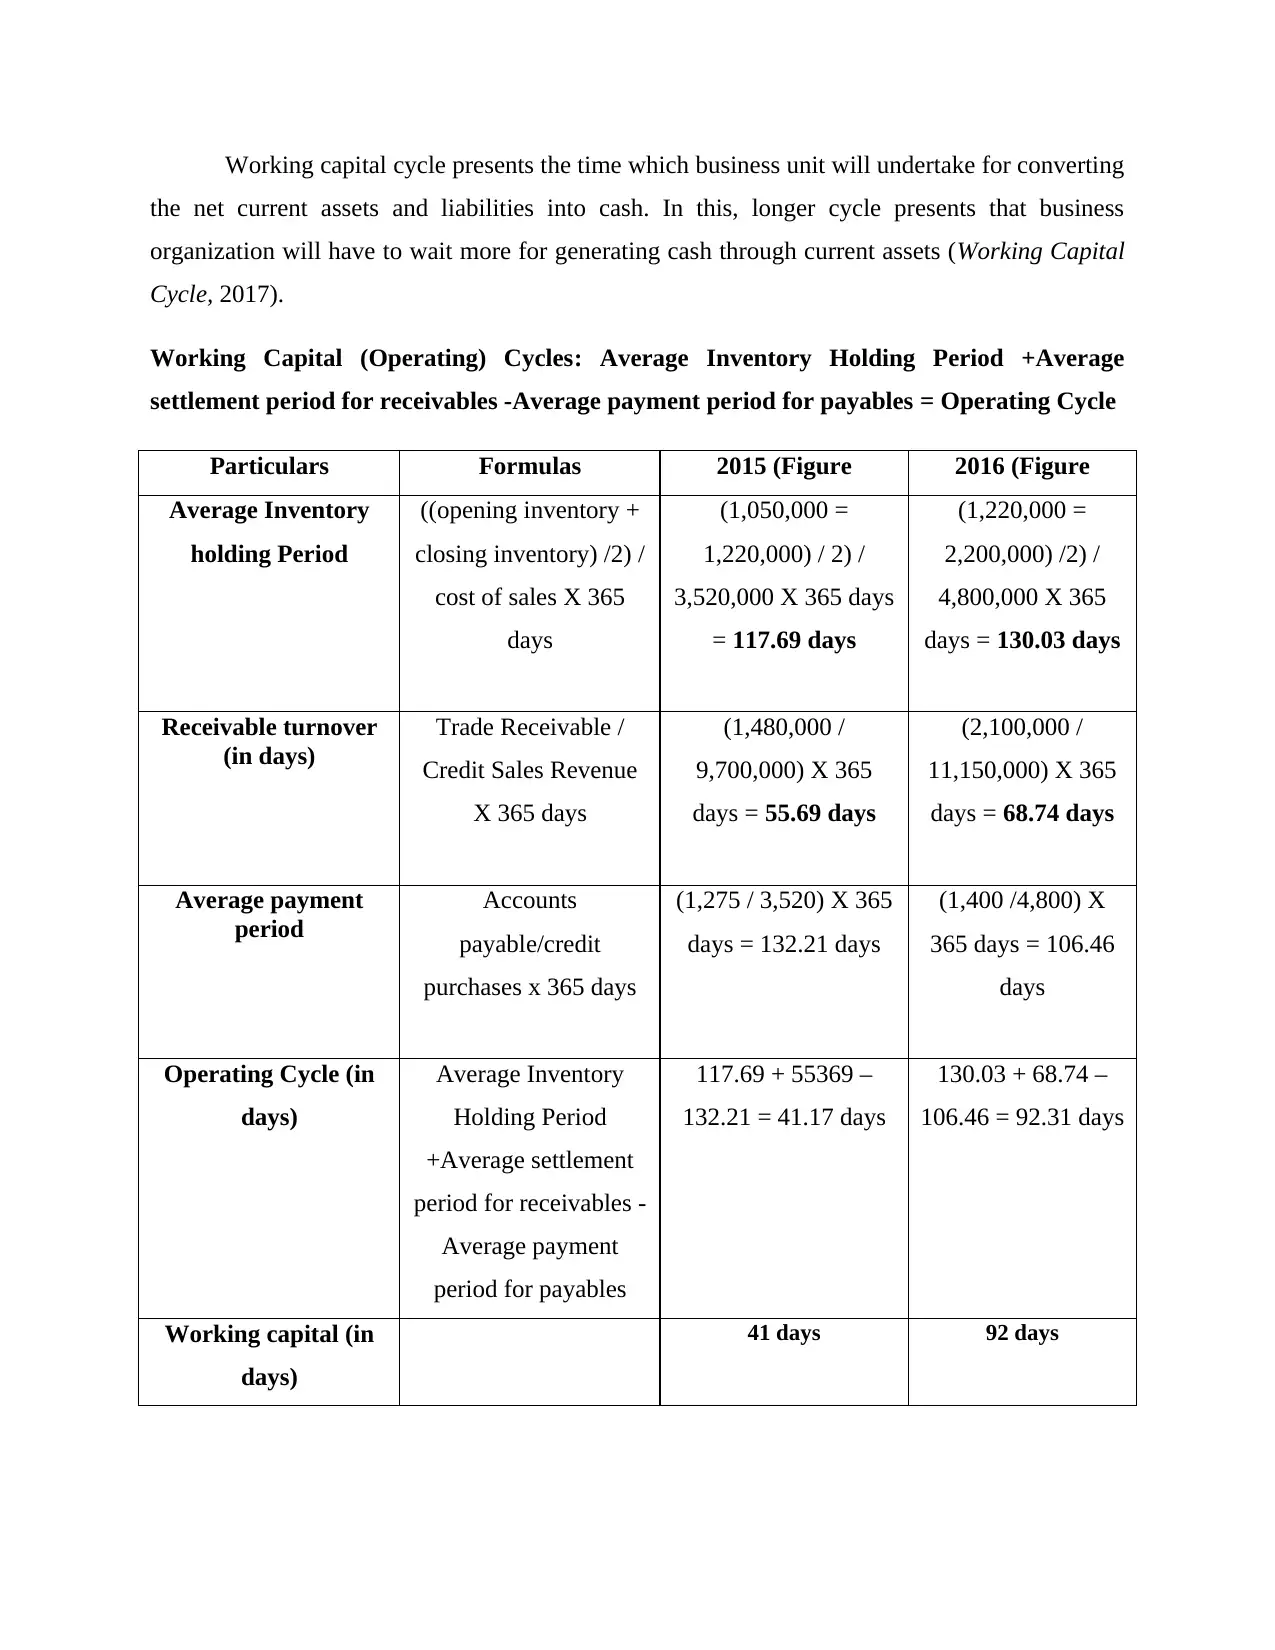
Working capital cycle presents the time which business unit will undertake for converting
the net current assets and liabilities into cash. In this, longer cycle presents that business
organization will have to wait more for generating cash through current assets (Working Capital
Cycle, 2017).
Working Capital (Operating) Cycles: Average Inventory Holding Period +Average
settlement period for receivables -Average payment period for payables = Operating Cycle
Particulars Formulas 2015 (Figure 2016 (Figure
Average Inventory
holding Period
((opening inventory +
closing inventory) /2) /
cost of sales X 365
days
(1,050,000 =
1,220,000) / 2) /
3,520,000 X 365 days
= 117.69 days
(1,220,000 =
2,200,000) /2) /
4,800,000 X 365
days = 130.03 days
Receivable turnover
(in days)
Trade Receivable /
Credit Sales Revenue
X 365 days
(1,480,000 /
9,700,000) X 365
days = 55.69 days
(2,100,000 /
11,150,000) X 365
days = 68.74 days
Average payment
period
Accounts
payable/credit
purchases x 365 days
(1,275 / 3,520) X 365
days = 132.21 days
(1,400 /4,800) X
365 days = 106.46
days
Operating Cycle (in
days)
Average Inventory
Holding Period
+Average settlement
period for receivables -
Average payment
period for payables
117.69 + 55369 –
132.21 = 41.17 days
130.03 + 68.74 –
106.46 = 92.31 days
Working capital (in
days)
41 days 92 days
Paraphrase This Document
Need a fresh take? Get an instant paraphrase of this document with our AI Paraphraser
Interpretation: By doing analysis, it has been assessed that, working capital days in the
year of 2015 and 2016 accounts for 41 & 92 respectively. Hence, in 2016, working capital days
of Honeywell Plc increased to the significant level. Thus, it can be presented that, in 2016,
company was not in position to convert its working capital into cash within the less time.
However, in 2016, company received money from debtors after more time as compared to 2015.
Further, in the accounting period 2016, business unit was obliged to make payment to creditors
earlier over 2015. Thus, to strengthen the liquidity position or performance Honeywell Plc is
required to revise credit policy pertaining to debtors. Along with this, firm is also needed to
approach the supplier who grants credit for long time or duration. From overall evaluation, it can
be said that liquidity position and performance of Honeywell Plc was not good in 2016. Thus,
business unit should make focus on developing highly strategic and policy framework that
strengthen the liquidity aspect.
PART B
1. Calculating BEP and margin of safety for Thompson Ltd
BEP: From evaluation, it has been identified that in 2014, BEP in sales and units account
for 1050 washing machines & £4020000 significantly. On the other side, in the financial year
2015, BEP level was 11902 units and £5474545.45 respectively. Thus, it can be stated that as per
the selling price and level of fixed cost BEP level is affected to a great extent. Higher BEP in
units are not good because it shows that company will take more time to attain profit.
Margin for safety: Table depicted in appendix clearly shows that margin of safety in the
year of 2014 accounts for 9950 unit & £3980000. In contrast to this, margin of safety was
£3725454.55. Hence, it can be entailed that as per the changes take place in the selling point and
cost level margin of safety is also getting highly influenced.
2. Critically evaluating the key assumptions that are associated with BEP model
Break even point analysis is highly significant which in turn provides high level of
assistance to the firm in determining relationship between cost, volume and profit. Moreover,
such analytical tool entails the point at which business unit will get the situation of no profit and
loss. In other words, it can be stated that BEP analysis helps Thomson Ltd in assessing the units
of washing machine which they need to offer for recovering all the expenses. BEP analysis is
based on several assumptions such as total costs can be distinguished into two types such as
fixed and variable (Break-Even Analysis: Introduction, Assumptions and Limitations, 2017).
Hence, it completely ignores semi-variable cost which is also one of the main parts of business.
For instance: Electricity expenses are come in the category of semi-variable expenses whose
some part is fixed and other is variable. Further, such method or model assumes that price of the
product is constant. However, on the critical note, it can be said that it is not possible to offer
products to the customers on fix price. Moreover, there are several factors that have direct impact
on the pricing of products or services such as competitor’s strategy, low demand etc (Van der
Stede, 2016). Hence, due to all such aspects it is not possible for Thomson Ltd to follow constant
pricing policy.
Further, BEP model is based on the assumption that volume of sales and production are
equal. It is one of the highly non-realistic approaches because company makes estimation of
production as well as sales on different basis. Besides this, sales level varies as per the changes
take place in the needs, wants and expectation level of customers. Along with this, BEP assumes
that technology is constant and no changes will take place in the efficiency of labour. However,
it is to be critically evaluated that efficiency of labour can be increased through the means of
training & development session (Jung, 2017). Besides this, now technological advancements also
take place with the very high pace. Thus, it can be presented that BEP assumptions are not highly
realistic as per the current business scenario.
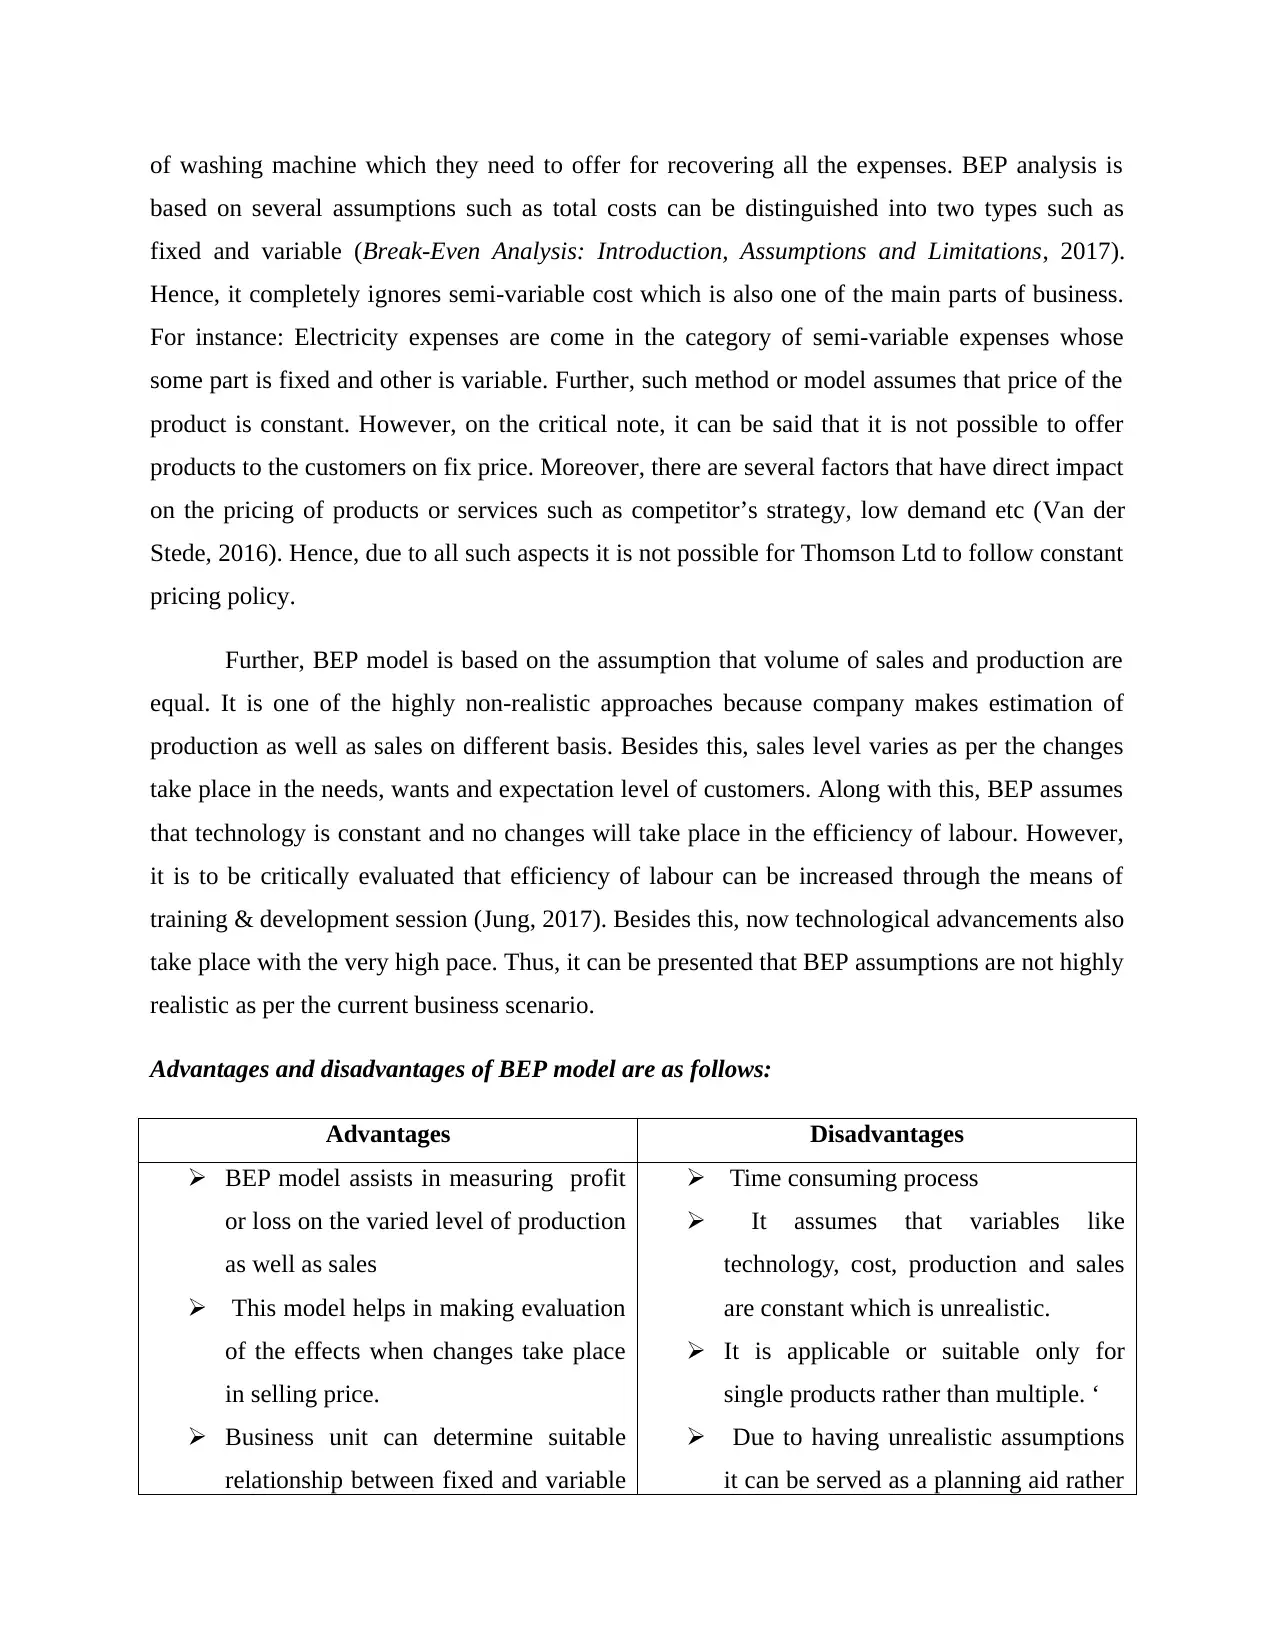
Advantages and disadvantages of BEP model are as follows:
Advantages Disadvantages
BEP model assists in measuring profit
or loss on the varied level of production
as well as sales
This model helps in making evaluation
of the effects when changes take place
in selling price.
Business unit can determine suitable
relationship between fixed and variable
Time consuming process
It assumes that variables like
technology, cost, production and sales
are constant which is unrealistic.
It is applicable or suitable only for
single products rather than multiple. ‘
Due to having unrealistic assumptions
it can be served as a planning aid rather
based on several assumptions such as total costs can be distinguished into two types such as
fixed and variable (Break-Even Analysis: Introduction, Assumptions and Limitations, 2017).
Hence, it completely ignores semi-variable cost which is also one of the main parts of business.
For instance: Electricity expenses are come in the category of semi-variable expenses whose
some part is fixed and other is variable. Further, such method or model assumes that price of the
product is constant. However, on the critical note, it can be said that it is not possible to offer
products to the customers on fix price. Moreover, there are several factors that have direct impact
on the pricing of products or services such as competitor’s strategy, low demand etc (Van der
Stede, 2016). Hence, due to all such aspects it is not possible for Thomson Ltd to follow constant
pricing policy.
Further, BEP model is based on the assumption that volume of sales and production are
equal. It is one of the highly non-realistic approaches because company makes estimation of
production as well as sales on different basis. Besides this, sales level varies as per the changes
take place in the needs, wants and expectation level of customers. Along with this, BEP assumes
that technology is constant and no changes will take place in the efficiency of labour. However,
it is to be critically evaluated that efficiency of labour can be increased through the means of
training & development session (Jung, 2017). Besides this, now technological advancements also
take place with the very high pace. Thus, it can be presented that BEP assumptions are not highly
realistic as per the current business scenario.
Advantages and disadvantages of BEP model are as follows:
Advantages Disadvantages
BEP model assists in measuring profit
or loss on the varied level of production
as well as sales
This model helps in making evaluation
of the effects when changes take place
in selling price.
Business unit can determine suitable
relationship between fixed and variable
Time consuming process
It assumes that variables like
technology, cost, production and sales
are constant which is unrealistic.
It is applicable or suitable only for
single products rather than multiple. ‘
Due to having unrealistic assumptions
it can be served as a planning aid rather
⊘ This is a preview!⊘
Do you want full access?
Subscribe today to unlock all pages.
Trusted by 1+ million students worldwide
1 out of 21
Related Documents


Your All-in-One AI-Powered Toolkit for Academic Success.
+13062052269
info@desklib.com
Available 24*7 on WhatsApp / Email
![[object Object]](/_next/static/media/star-bottom.7253800d.svg)
Unlock your academic potential
Copyright © 2020–2026 A2Z Services. All Rights Reserved. Developed and managed by ZUCOL.