ACC1AIS - Financial Analysis and Accounting Information System Report
VerifiedAdded on 2023/06/11
|10
|1380
|143
Report
AI Summary
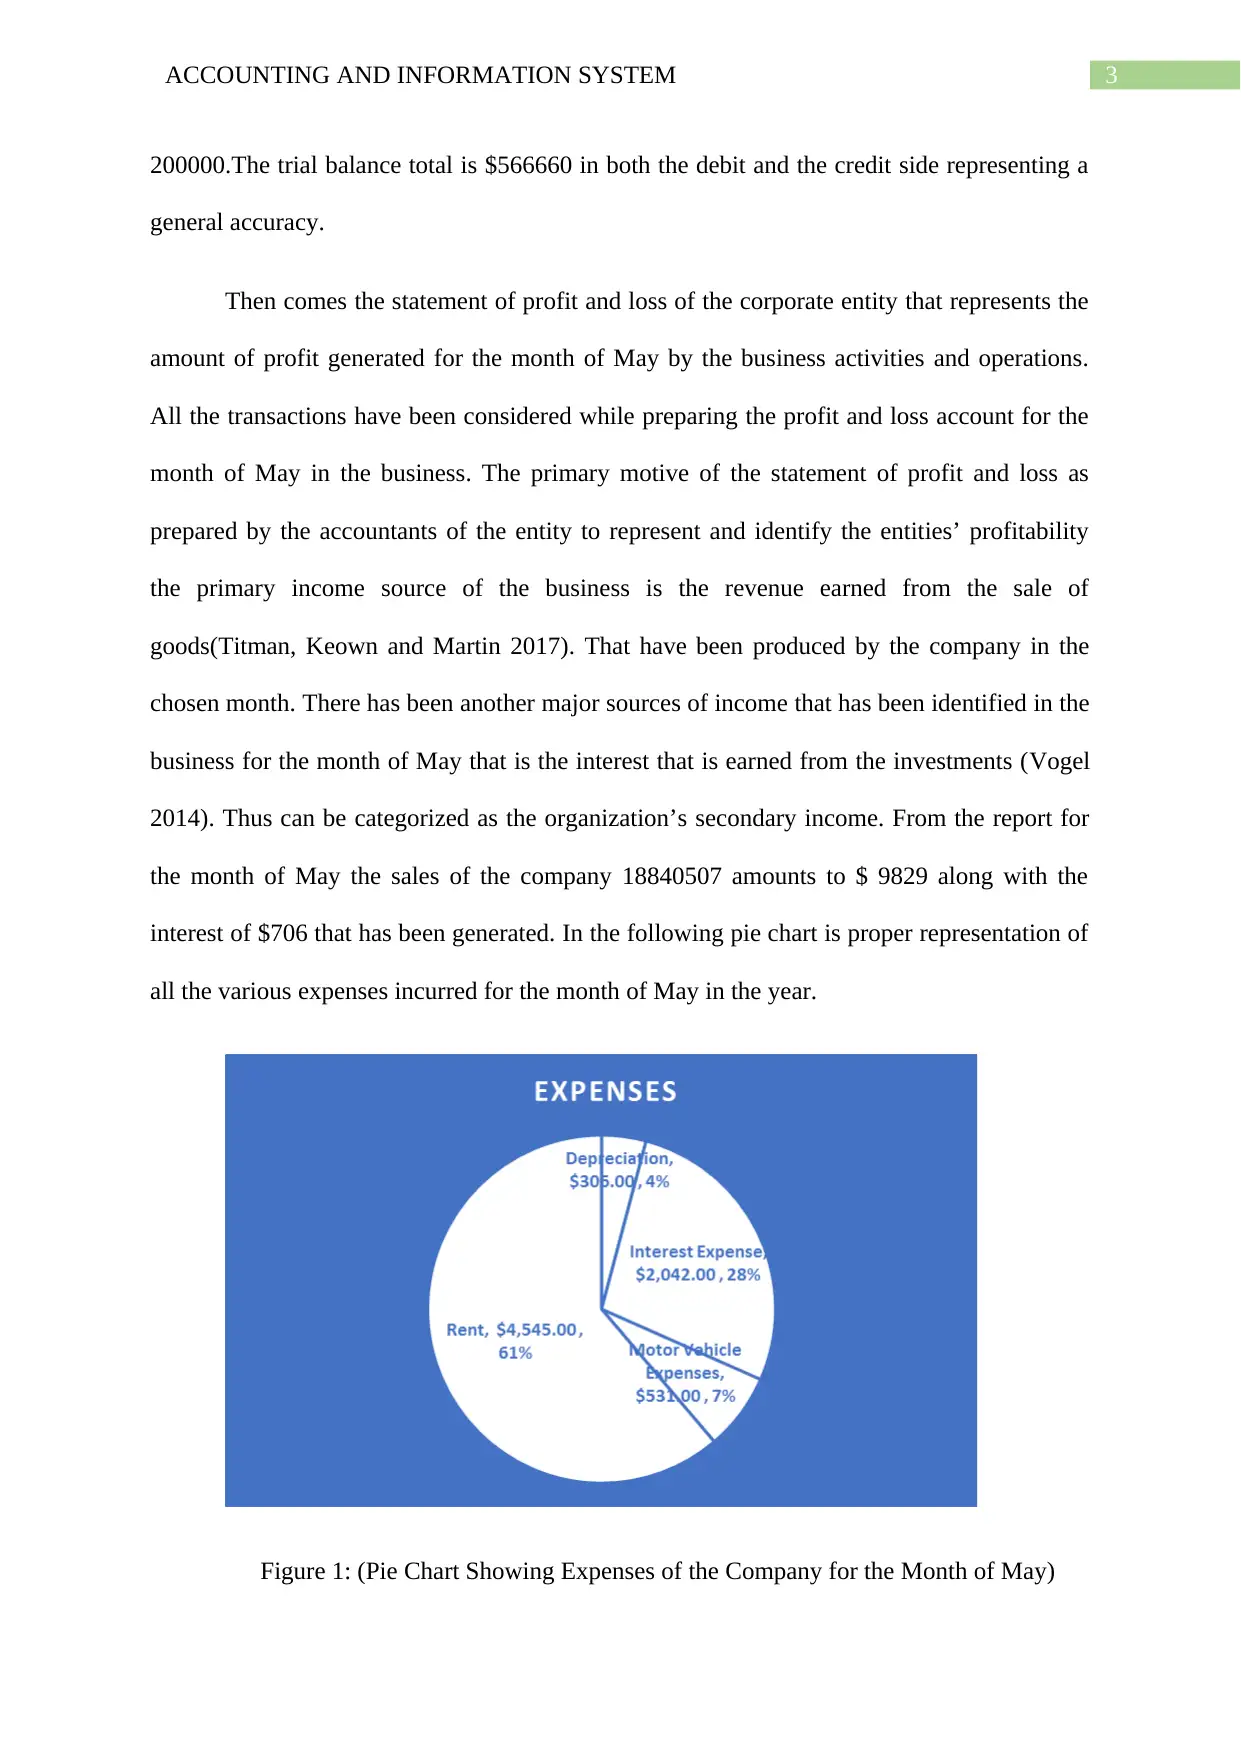
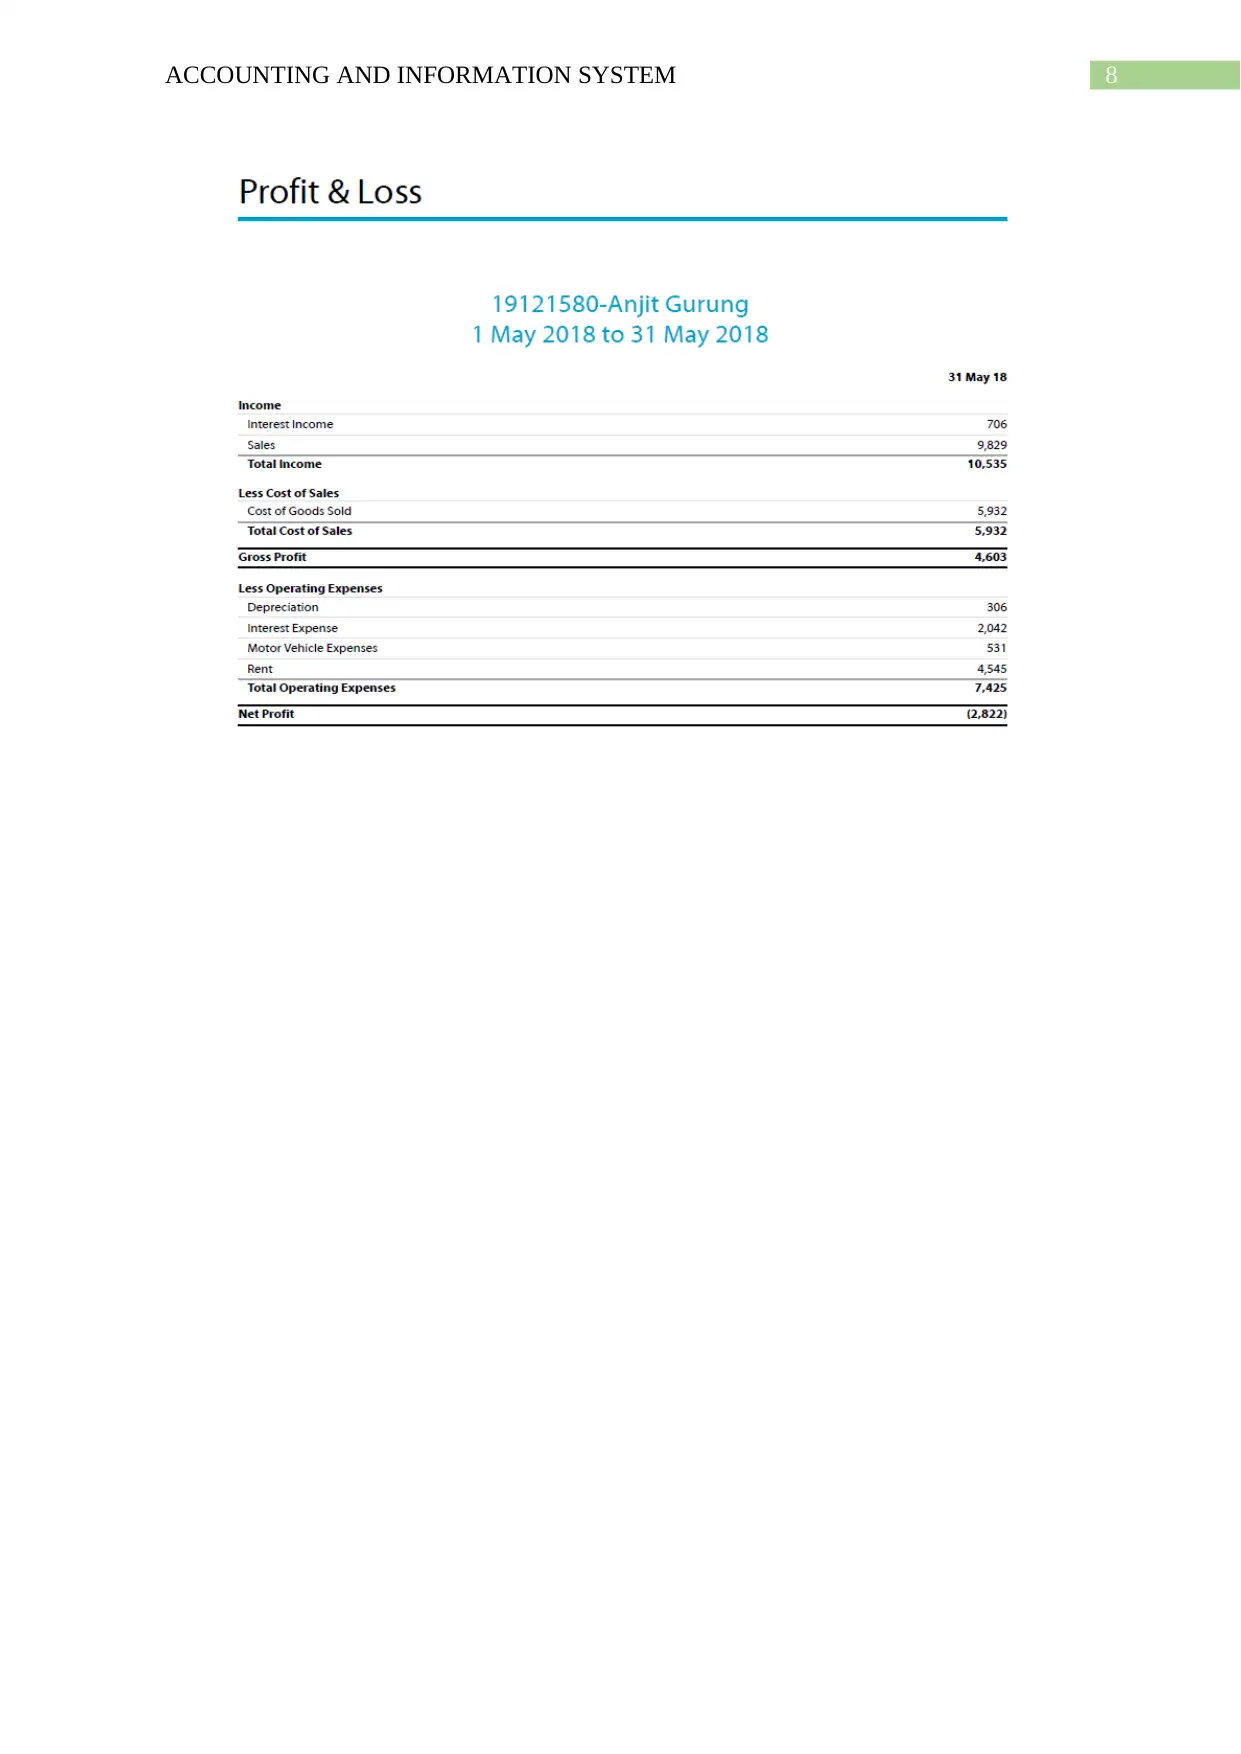
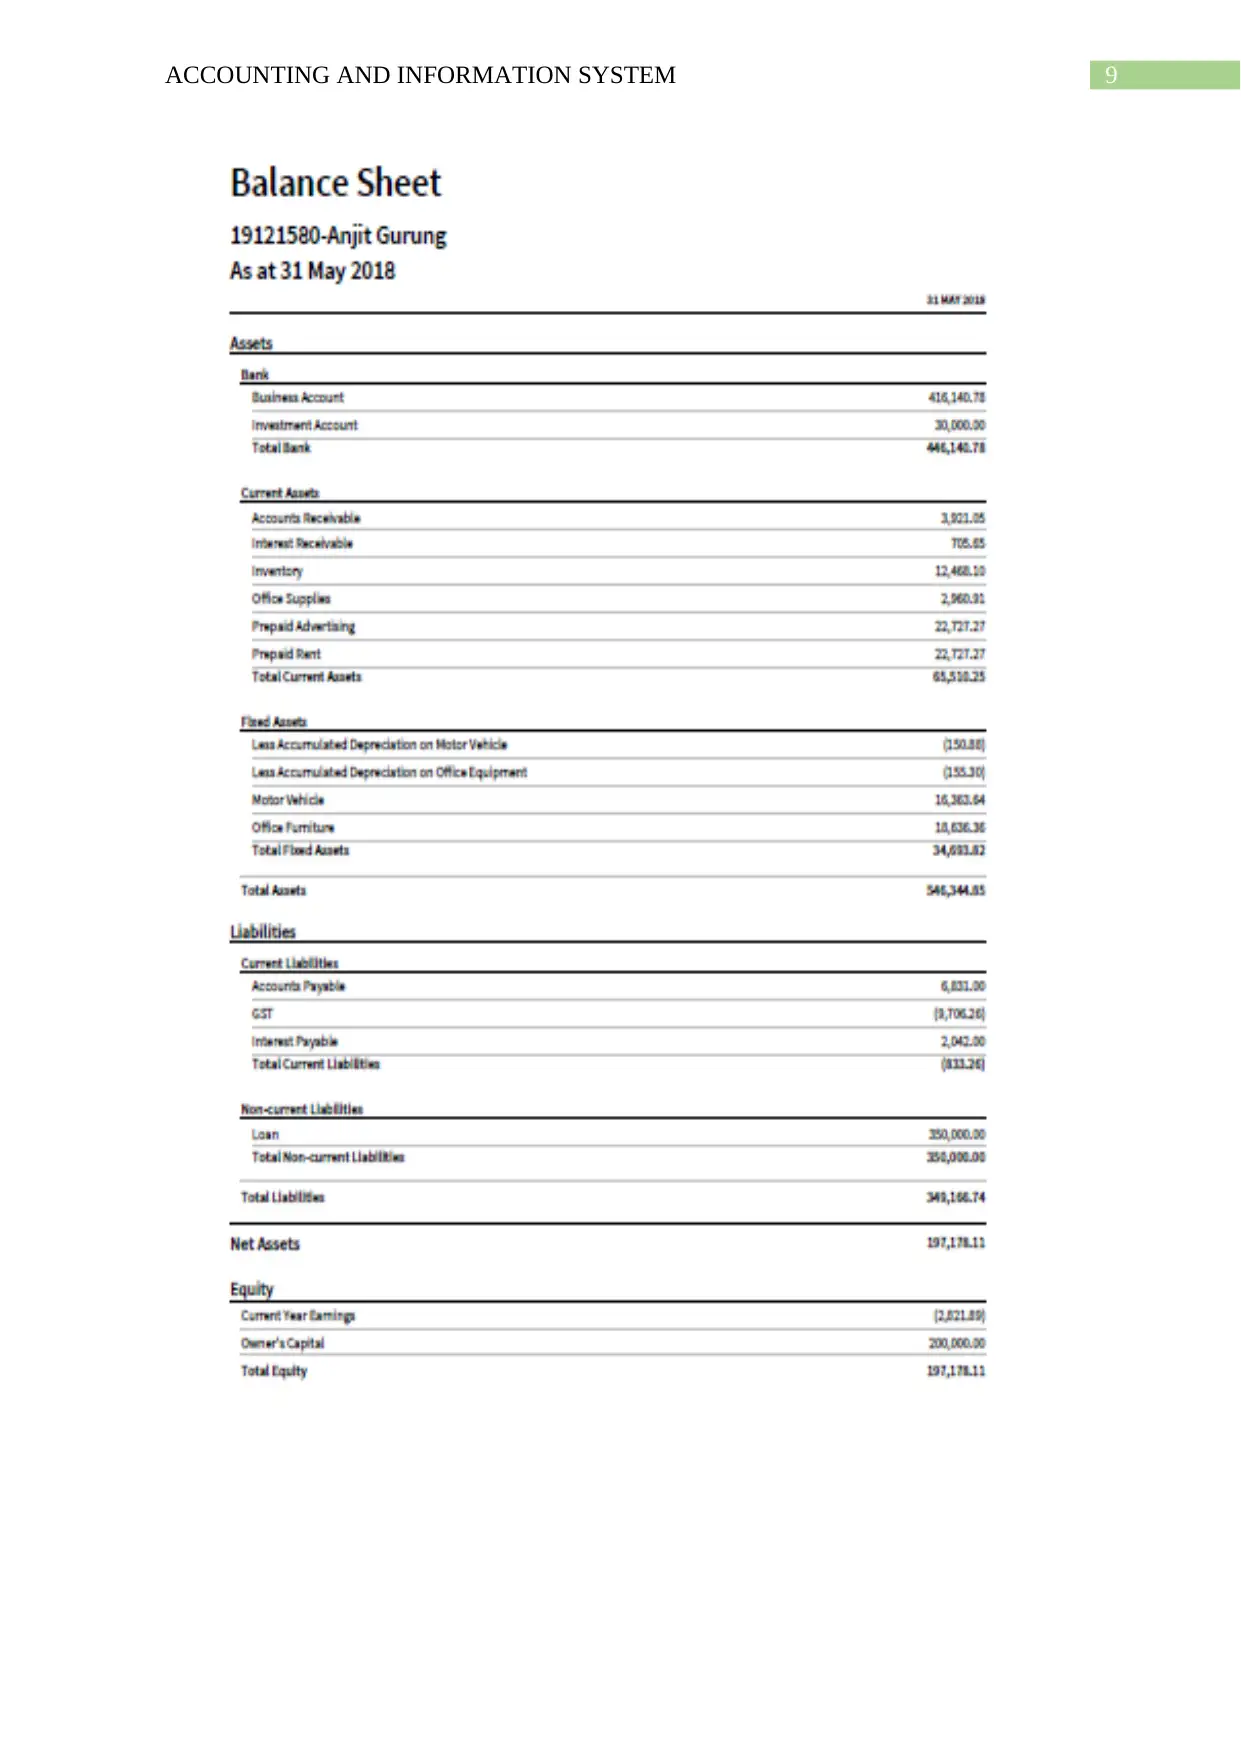
This report provides a detailed financial analysis of company 18840507 for May 2018, including journal entries, income statements, and a balance sheet. The company is involved in buying and selling inventories. The report includes a trial balance, profit and loss statement, and balance sheet, analyzing sales, expenses, and assets. A pie chart illustrates the distribution of operating expenses, highlighting rent, interest, depreciation, and motor vehicle expenses. The balance sheet details current and fixed assets, including prepaid rent, office supplies, inventory, office furniture, and motor vehicles, providing a comprehensive overview of the company's financial position and performance for the month.

Running head: ACCOUNTING AND INFORMATION SYSTEM
Accounting and Information System
Name of the Student:
Name of the University:
Author’s Note:
Accounting and Information System
Name of the Student:
Name of the University:
Author’s Note:
Paraphrase This Document
Need a fresh take? Get an instant paraphrase of this document with our AI Paraphraser

1ACCOUNTING AND INFORMATION SYSTEM
Table of Contents
Introduction................................................................................................................................2
Financial analysis.......................................................................................................................2
References..................................................................................................................................6
Appendix....................................................................................................................................7

2ACCOUNTING AND INFORMATION SYSTEM
Introduction
This motive of the following report is to make a vivid analysis and evaluation of the
financial performance of the company 18840507 for the month of May. It has been found that
the company had various transactions for the month of May and journal entries have been
passed along with the preparation of the income statements and the balance sheet. The
company of 18840507 has been engaged in the operation of selling and buying of inventories.
There has been preparation of the profit and loss account and a balance sheet for the month of
May in the organization (Levinson 2014). There is Trial Balance has also been also prepared
in the organization which are shown in the Appendix which is given below.
Financial analysis
During the year the record of the transactions that are made by necessary journal
entries passing in the month of May. After the journal entries the transactions are then
transferred to the various ledger accounts (Grant 2016). For confirming the mathematical
accuracy and balance of the debit and the credit side of the transactions of the organization
the trial balance has been prepared.
The trial balance which is the statement where the debit and the credit balances are
matched in order to find out the mathematical accuracy of the bookkeeping process. The trial
balance also helps in pointing out the errors of commission and omission that have been
occurred in the book keeping process (Rothaermel 2015). While analyzing the trial balance it
can be found out that amount of sales in the credit side is $9829. Following the sales there are
direct expenses that includes the cost of goods sold and the expensed related to the Motor
Vehicles that has taken place in the month of May. The amount of cost of goods sold is $
5,932 and the motor vehicle expense is $ 531.The owners capital equity amounts to $
⊘ This is a preview!⊘
Do you want full access?
Subscribe today to unlock all pages.

Trusted by 1+ million students worldwide

3ACCOUNTING AND INFORMATION SYSTEM
200000.The trial balance total is $566660 in both the debit and the credit side representing a
general accuracy.
Then comes the statement of profit and loss of the corporate entity that represents the
amount of profit generated for the month of May by the business activities and operations.
All the transactions have been considered while preparing the profit and loss account for the
month of May in the business. The primary motive of the statement of profit and loss as
prepared by the accountants of the entity to represent and identify the entities’ profitability
the primary income source of the business is the revenue earned from the sale of
goods(Titman, Keown and Martin 2017). That have been produced by the company in the
chosen month. There has been another major sources of income that has been identified in the
business for the month of May that is the interest that is earned from the investments (Vogel
2014). Thus can be categorized as the organization’s secondary income. From the report for
the month of May the sales of the company 18840507 amounts to $ 9829 along with the
interest of $706 that has been generated. In the following pie chart is proper representation of
all the various expenses incurred for the month of May in the year.
Figure 1: (Pie Chart Showing Expenses of the Company for the Month of May)
Paraphrase This Document
Need a fresh take? Get an instant paraphrase of this document with our AI Paraphraser

4ACCOUNTING AND INFORMATION SYSTEM
Source: (Created by Author)
In the above chart represents the various operating expenses of the business that has
taken place in the month of May. It can clearly be observed that the operating expenses major
part as been amounted to $ 4545. In the organization the amount of rent which is considered
as a fixed expenses part that the organization has to incur on a regular or a fixed basis
irrespective rate of the production of the commodities by the company (DeFusco et al. 2015).
There has been an amount of $ 2042 which is another major expenses that is the interest
amount of the loan. As shown in the balance sheet the interest amount is related to the loan
that the business has taken. Depreciation and the motor vehicle expenses has also been found
out in profit and loss statement that amounts to $ 306 and $ 531 respectively. The
depreciation is the expenses due to the regular wear and tear of the assets for the various
activities of the business during the month (Dale and Fortin 2014). There is also loss of $
2,822 due to the more amount of expenses in the company’s financial statements. This has
taken due to increased operating expenses.
The Balance sheet of the company represents the financial position of the company
for the month of May. The balance sheet consists of the all the assets and the liabilities
recorded for the month of May.in the graph represented below the there is a description of the
current assets:

5ACCOUNTING AND INFORMATION SYSTEM
Accounts
Receivable Interest
Receivable Inventory Office
Supplies Prepaid
Advertising Prepaid
Rent
0.00
5,000.00
10,000.00
15,000.00
20,000.00
25,000.00
Current Assets
Figure 2: (Chart Showing Current Assets of the Company for the Month of May)
Source: (Created by Author)
The above chart that consist if the elaboration of the current asset items of the balance
sheet that consists of the items like the prepaid rent, office supplies, advertisement prepaid,
interest and amounts receivables and inventories (Bardach and Patashnik, 2015). The current
assets covers the major parts that amounts to $22727.27 consists of the prepaid advertisement
and rent of the business fot the month of May. In addition to this in the balance sheet there
exists the inventory as represented in the graph amounts tp 12468.10. The inventory refers to
the closing stock for the month of May. Moreover there is the fixed assets that comprises of
the office furniture and the motor vehicles which makes the total side of the asset amounting
to $ 546,344.85. Also there is an amount of $200000 of the firm’s equity. The total equity the
amount of capital excluding the loss.
⊘ This is a preview!⊘
Do you want full access?
Subscribe today to unlock all pages.

Trusted by 1+ million students worldwide

6ACCOUNTING AND INFORMATION SYSTEM
References
Bardach, E. and Patashnik, E.M., 2015. A practical guide for policy analysis: The eightfold
path to more effective problem solving. CQ press.
Dale, M.R. and Fortin, M.J., 2014. Spatial analysis: a guide for ecologists. Cambridge
University Press.
DeFusco, R.A., McLeavey, D.W., Pinto, J.E., Anson, M.J. and Runkle, D.E.,
2015. Quantitative investment analysis. John Wiley & Sons.
Grant, R.M., 2016. Contemporary strategy analysis: Text and cases edition. John Wiley &
Sons.
Levinson, M., 2014. The Economist Guide to Financial Markets: Why they exist and how
they work. The Economist.
Rothaermel, F.T., 2015. Strategic management. McGraw-Hill Education.
Titman, S., Keown, A.J. and Martin, J.D., 2017. Financial management: Principles and
applications. Pearson.
Tsai, S.Q., Topkar, V.V., Joung, J.K. and Aryee, M.J., 2016. Open-source guideseq software
for analysis of GUIDE-seq data. Nature biotechnology, 34(5), p.483.
Vogel, H.L., 2014. Entertainment industry economics: A guide for financial analysis.
Cambridge University Press.
Paraphrase This Document
Need a fresh take? Get an instant paraphrase of this document with our AI Paraphraser

7ACCOUNTING AND INFORMATION SYSTEM
Appendix
Appendix

8ACCOUNTING AND INFORMATION SYSTEM
⊘ This is a preview!⊘
Do you want full access?
Subscribe today to unlock all pages.

Trusted by 1+ million students worldwide

9ACCOUNTING AND INFORMATION SYSTEM
1 out of 10
Related Documents

Your All-in-One AI-Powered Toolkit for Academic Success.
+13062052269
info@desklib.com
Available 24*7 on WhatsApp / Email
Unlock your academic potential
Copyright © 2020–2025 A2Z Services. All Rights Reserved. Developed and managed by ZUCOL.