Capital Budgeting and Investment Appraisal: Decision Analysis

Verified

Added on  2023/06/13

|13
|2442
|373
Report
AI Summary
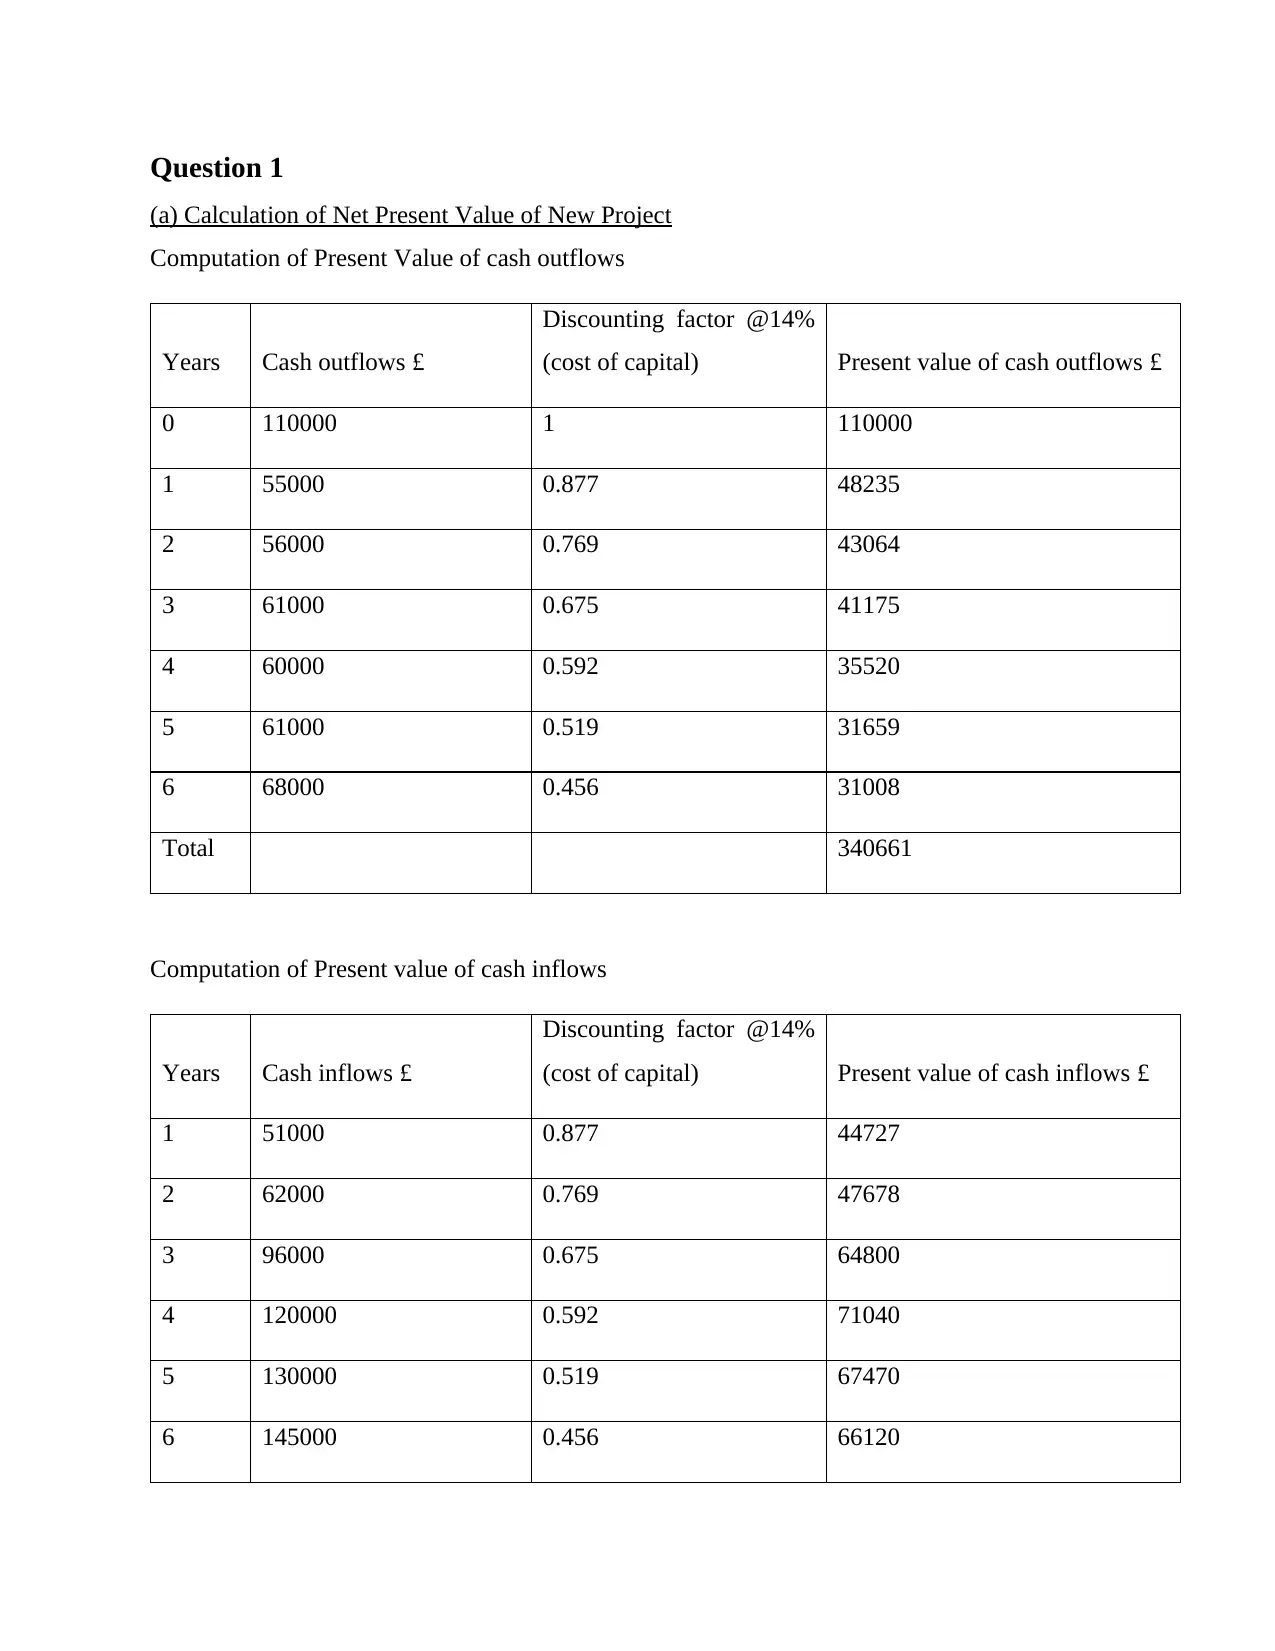
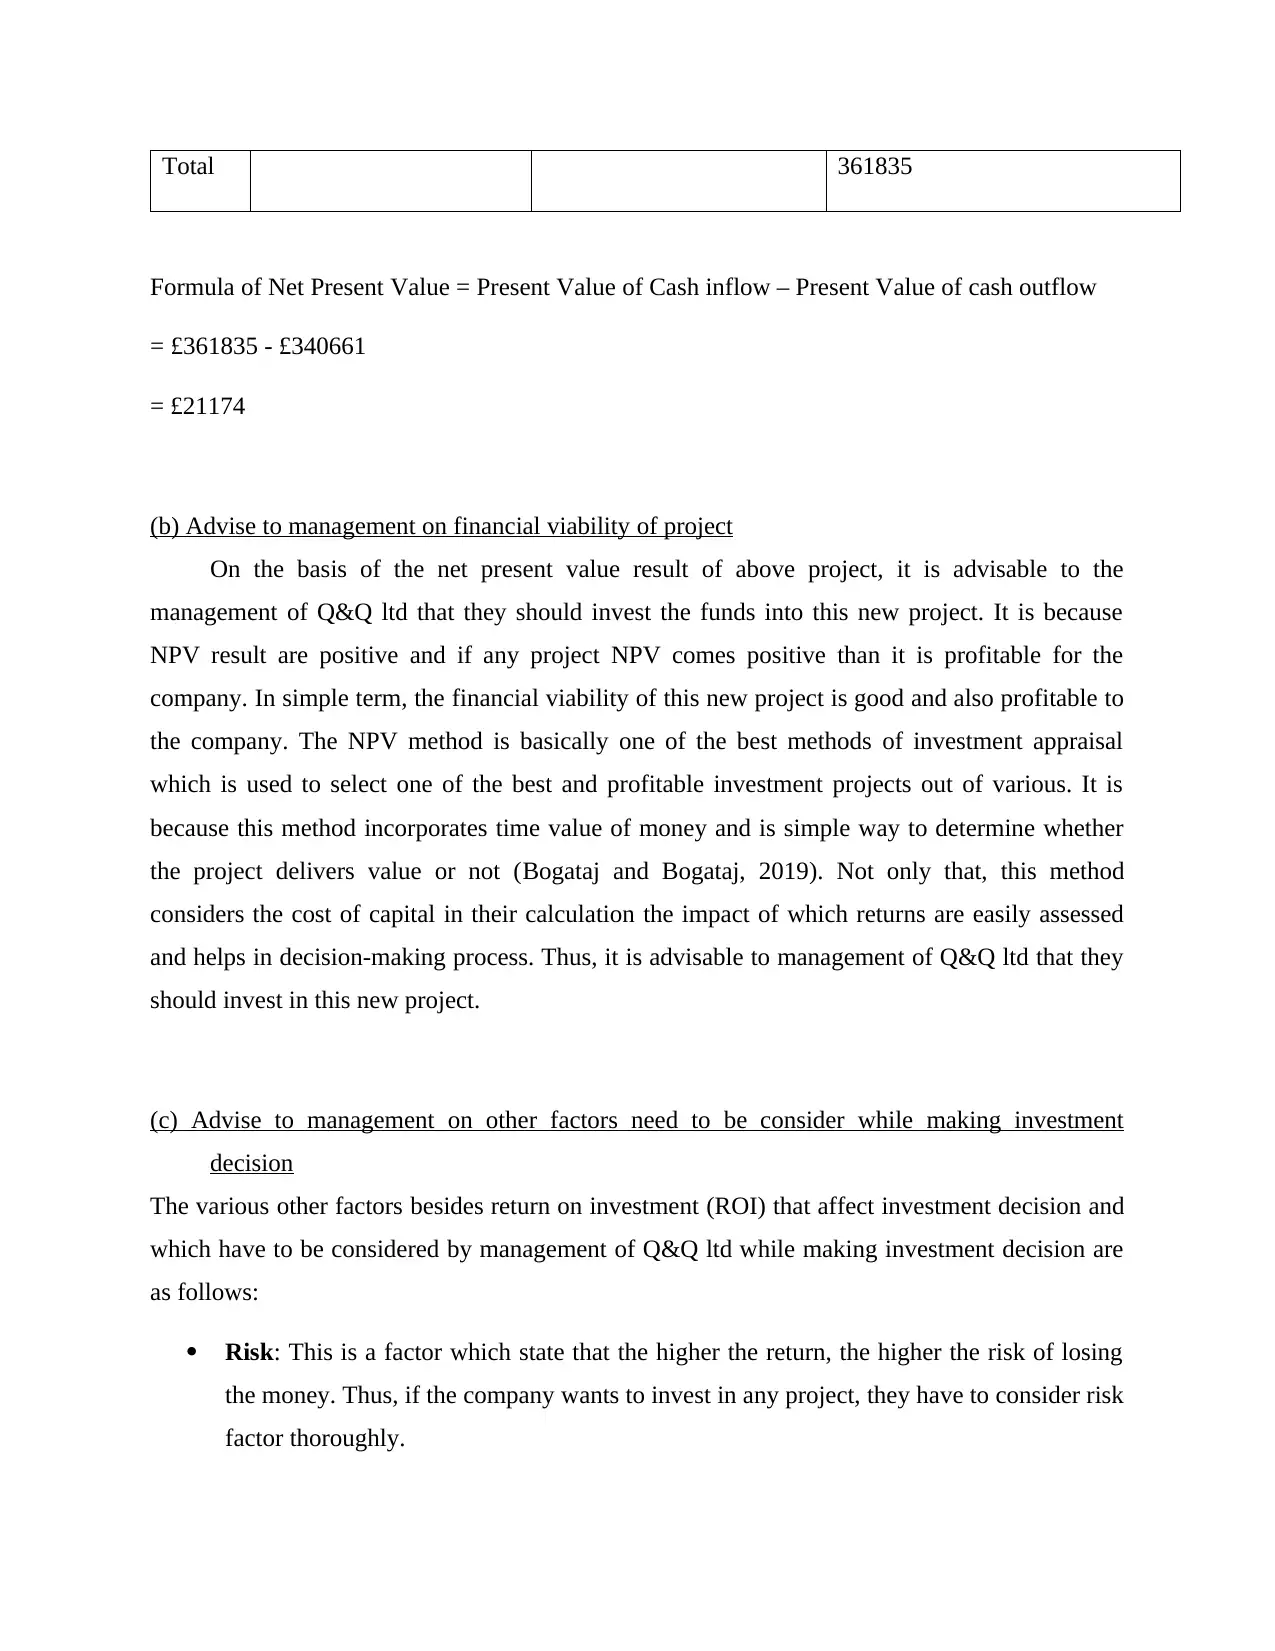
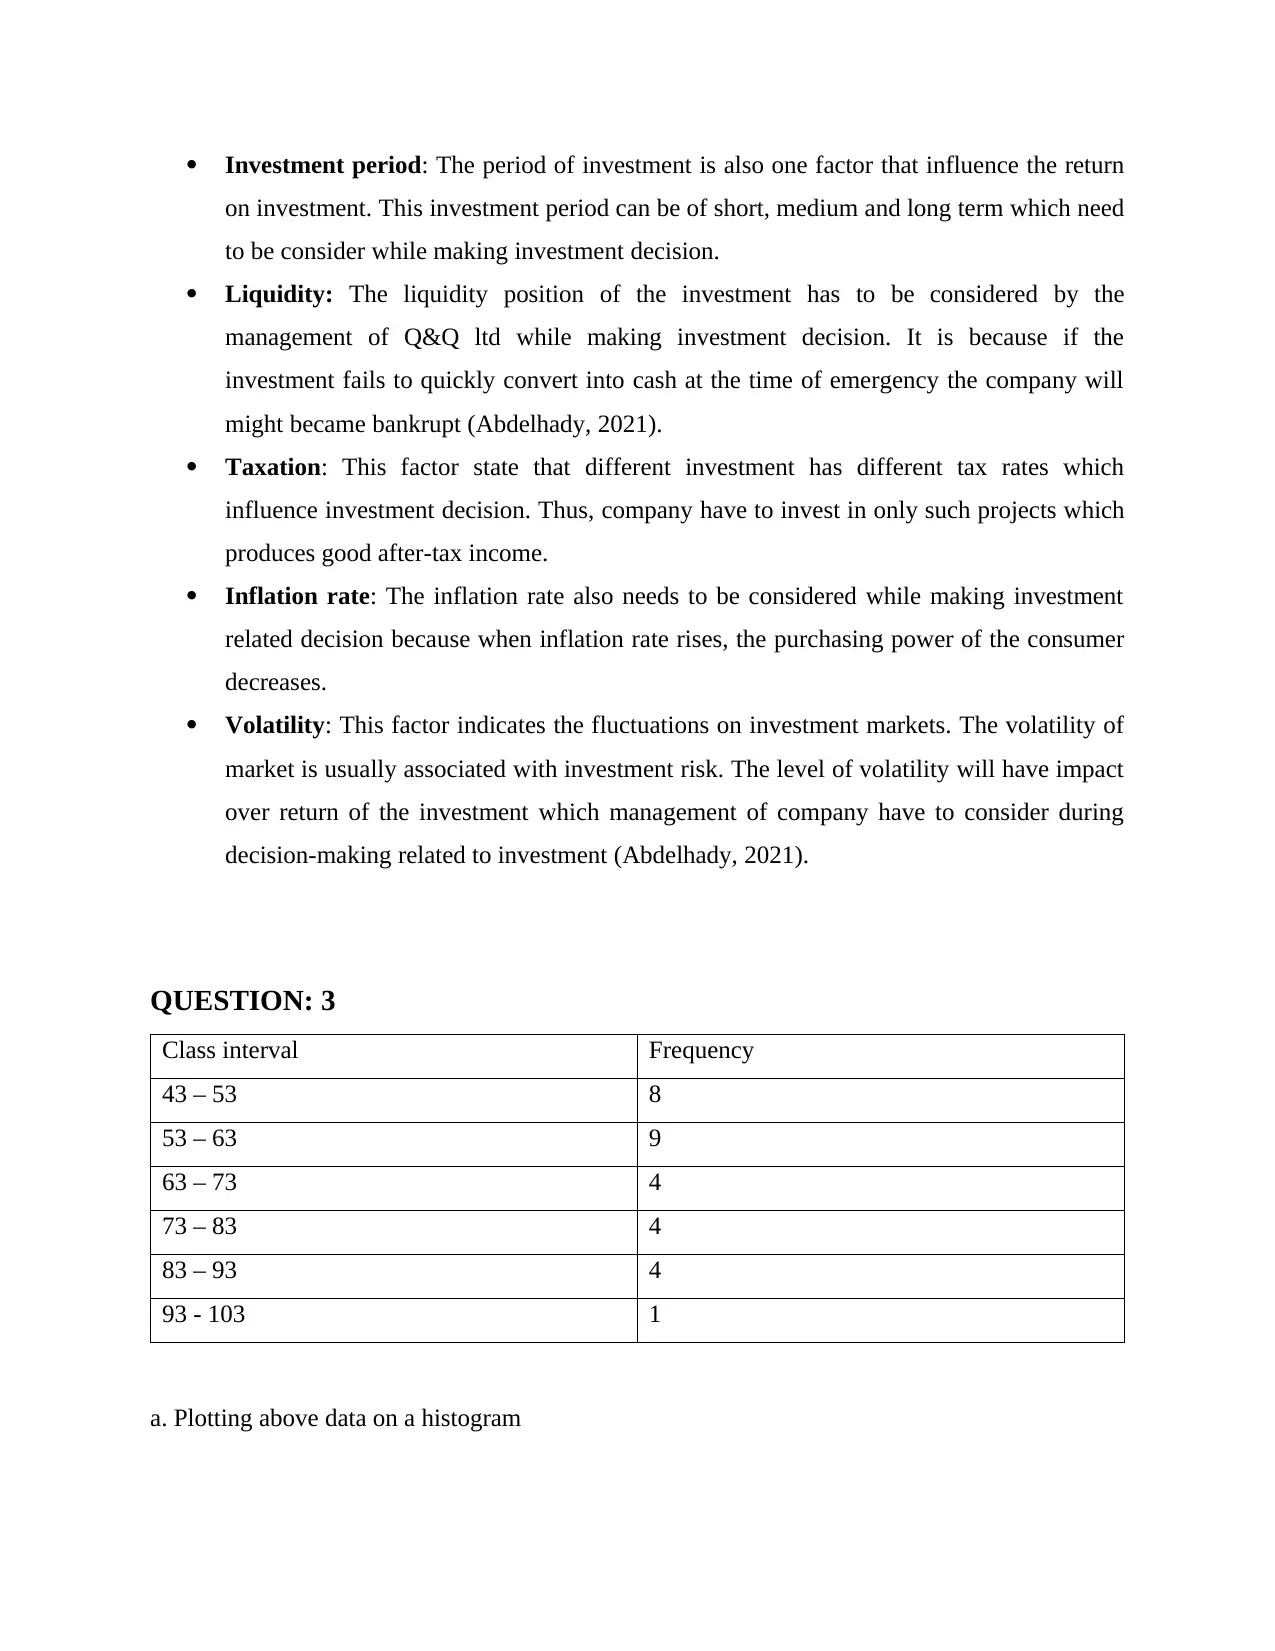
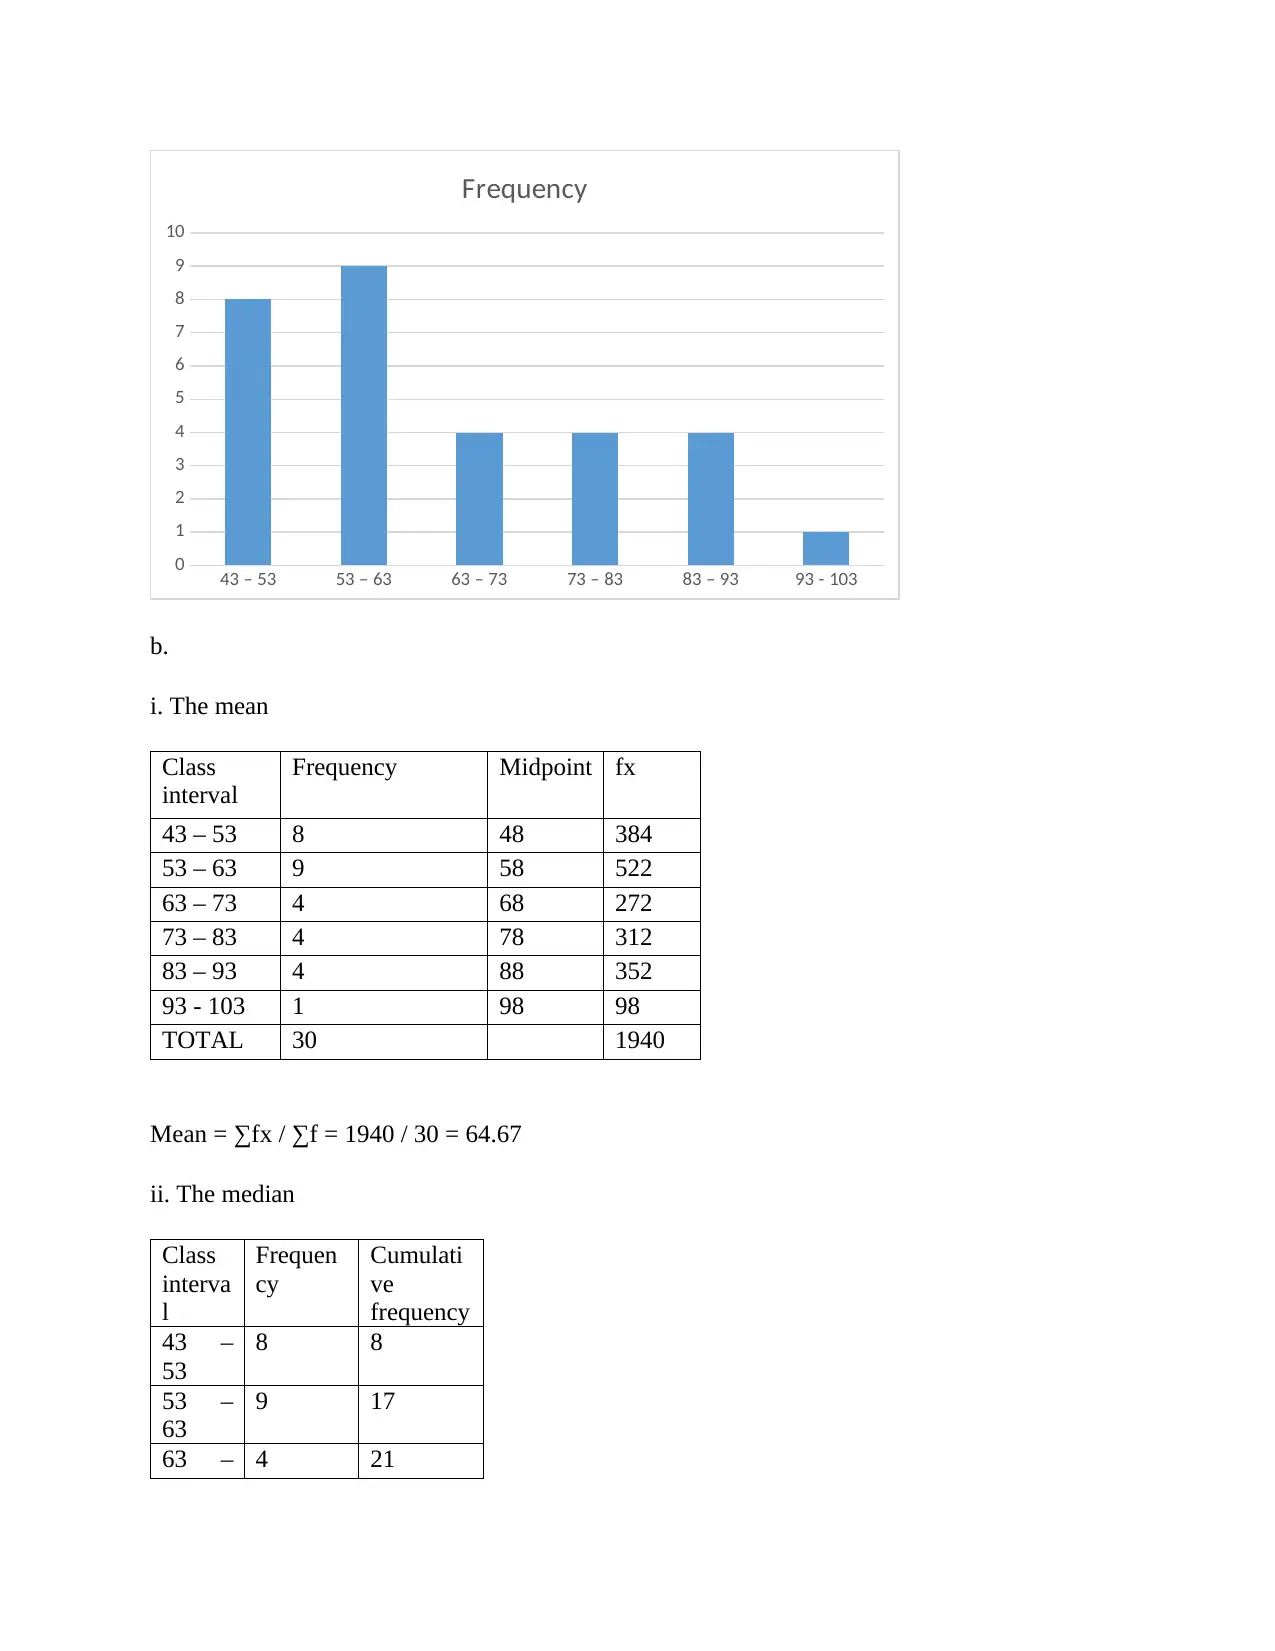
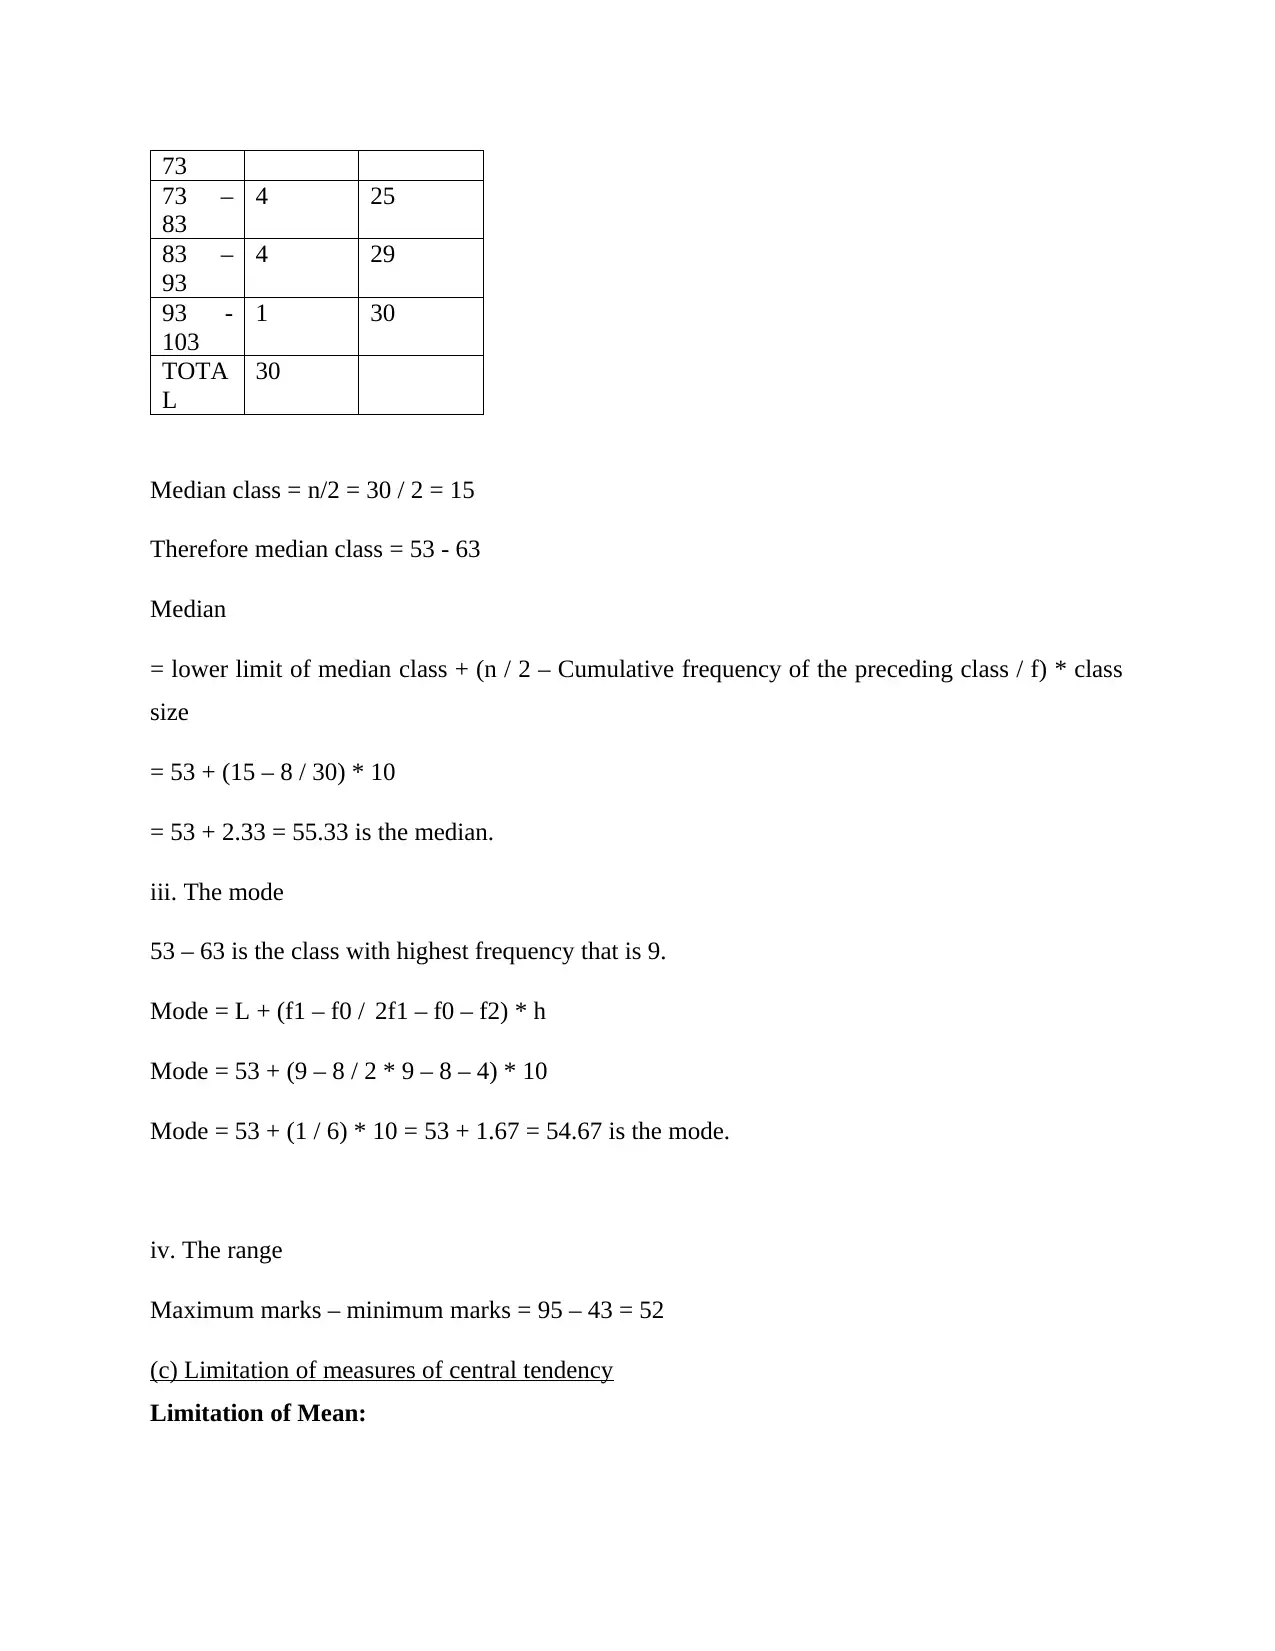
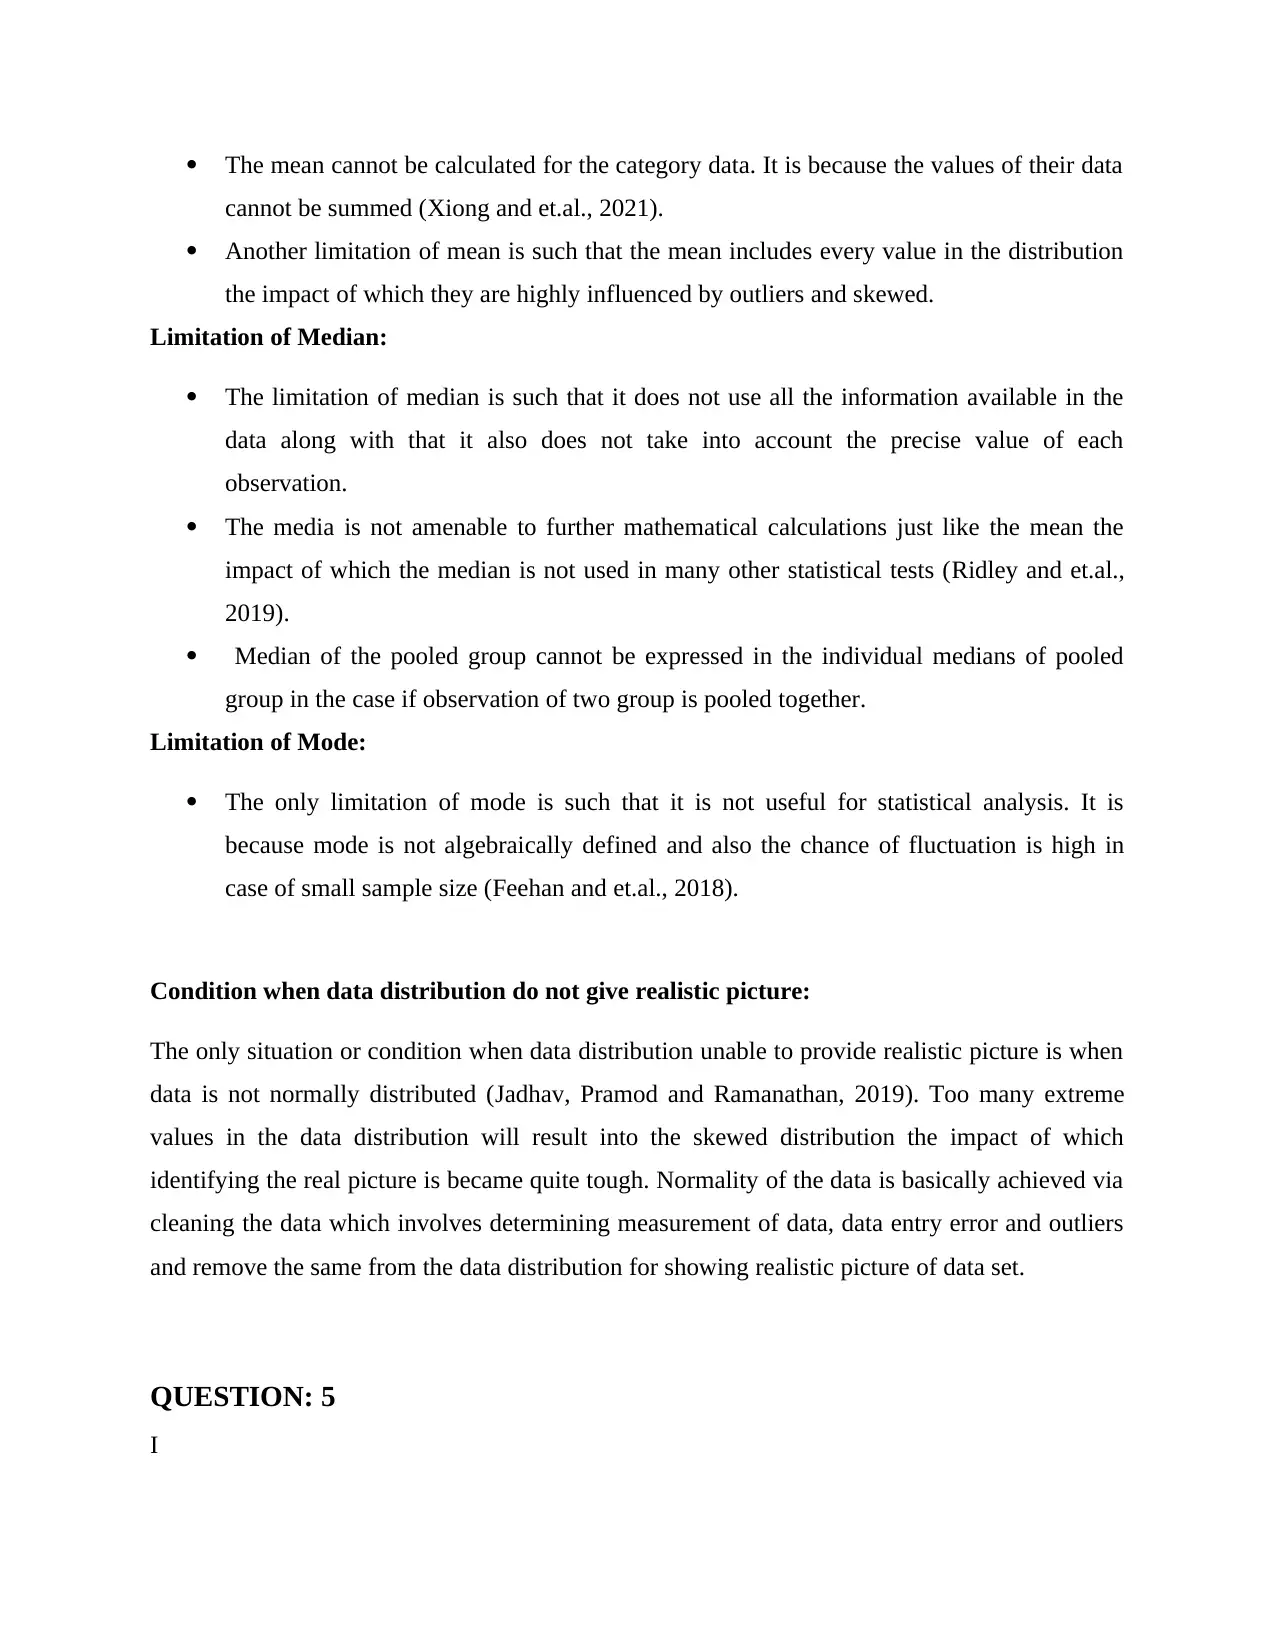
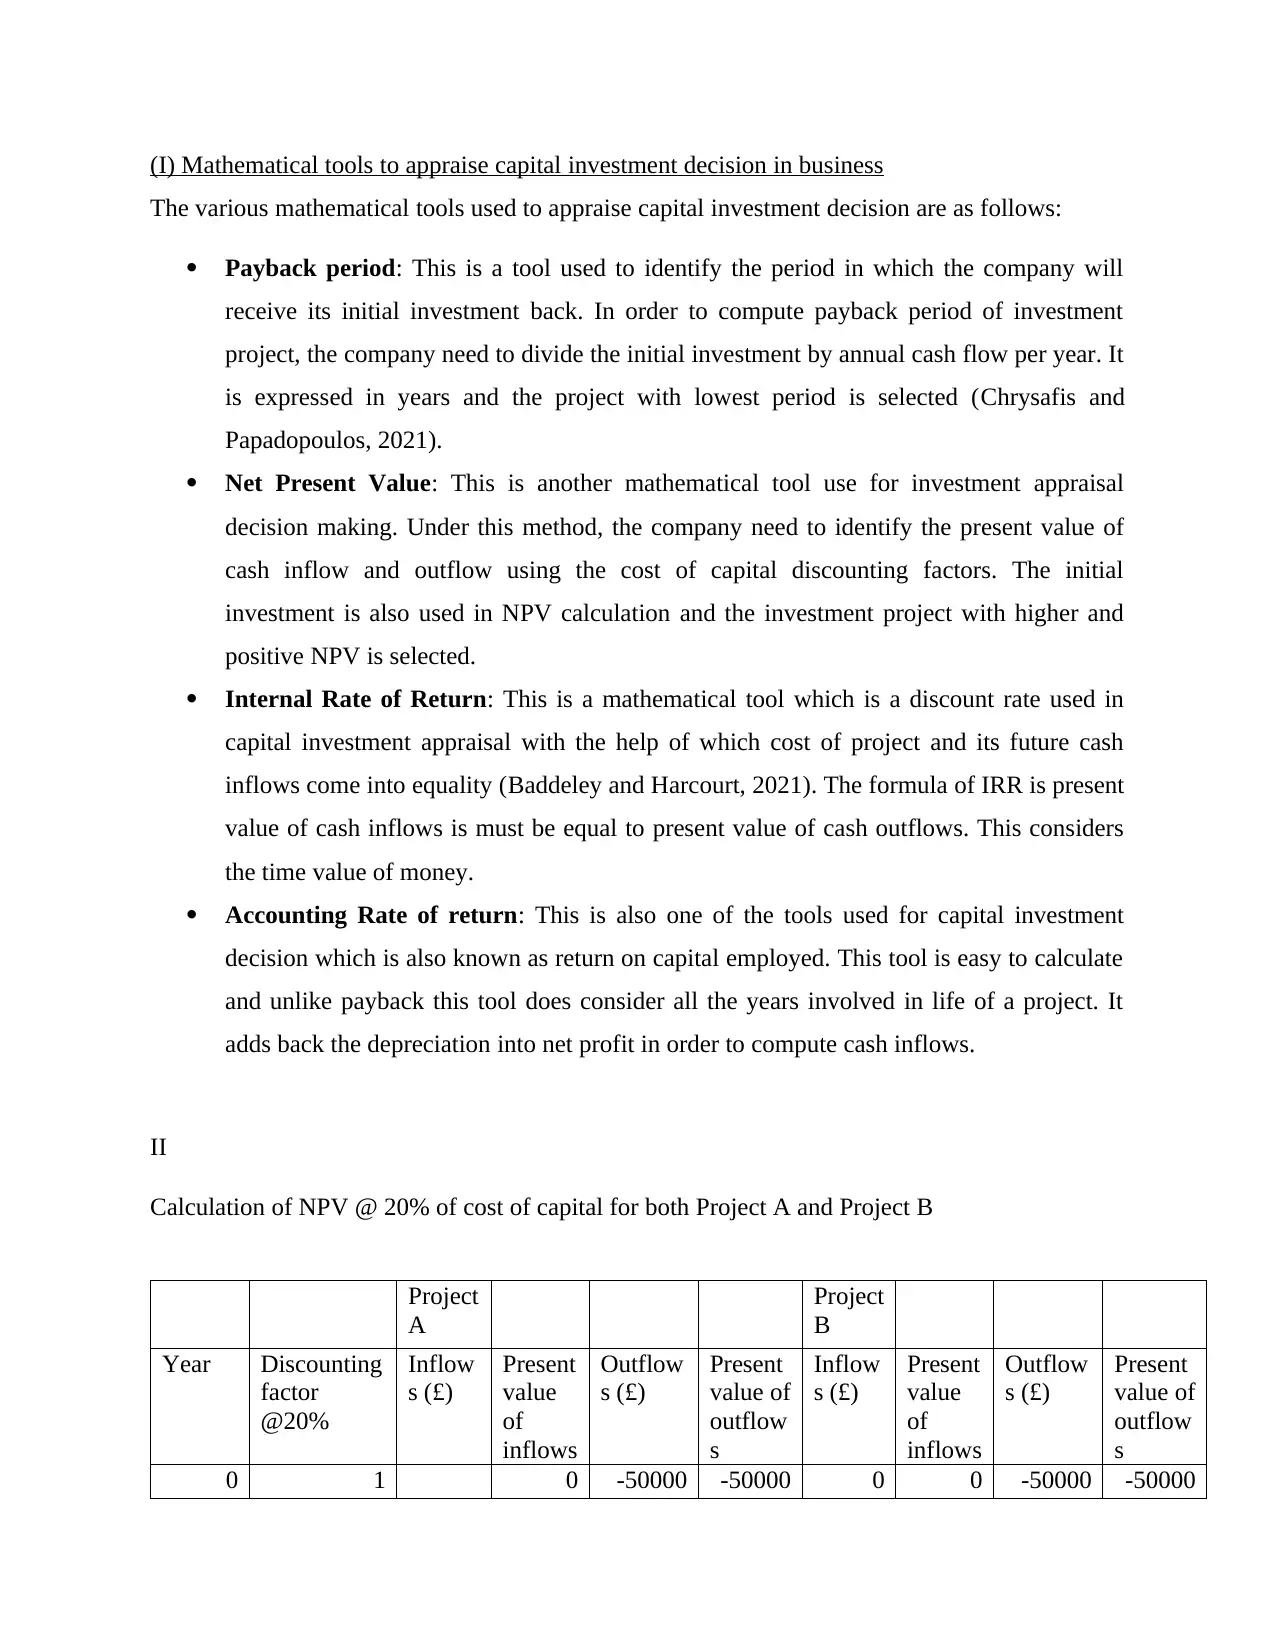
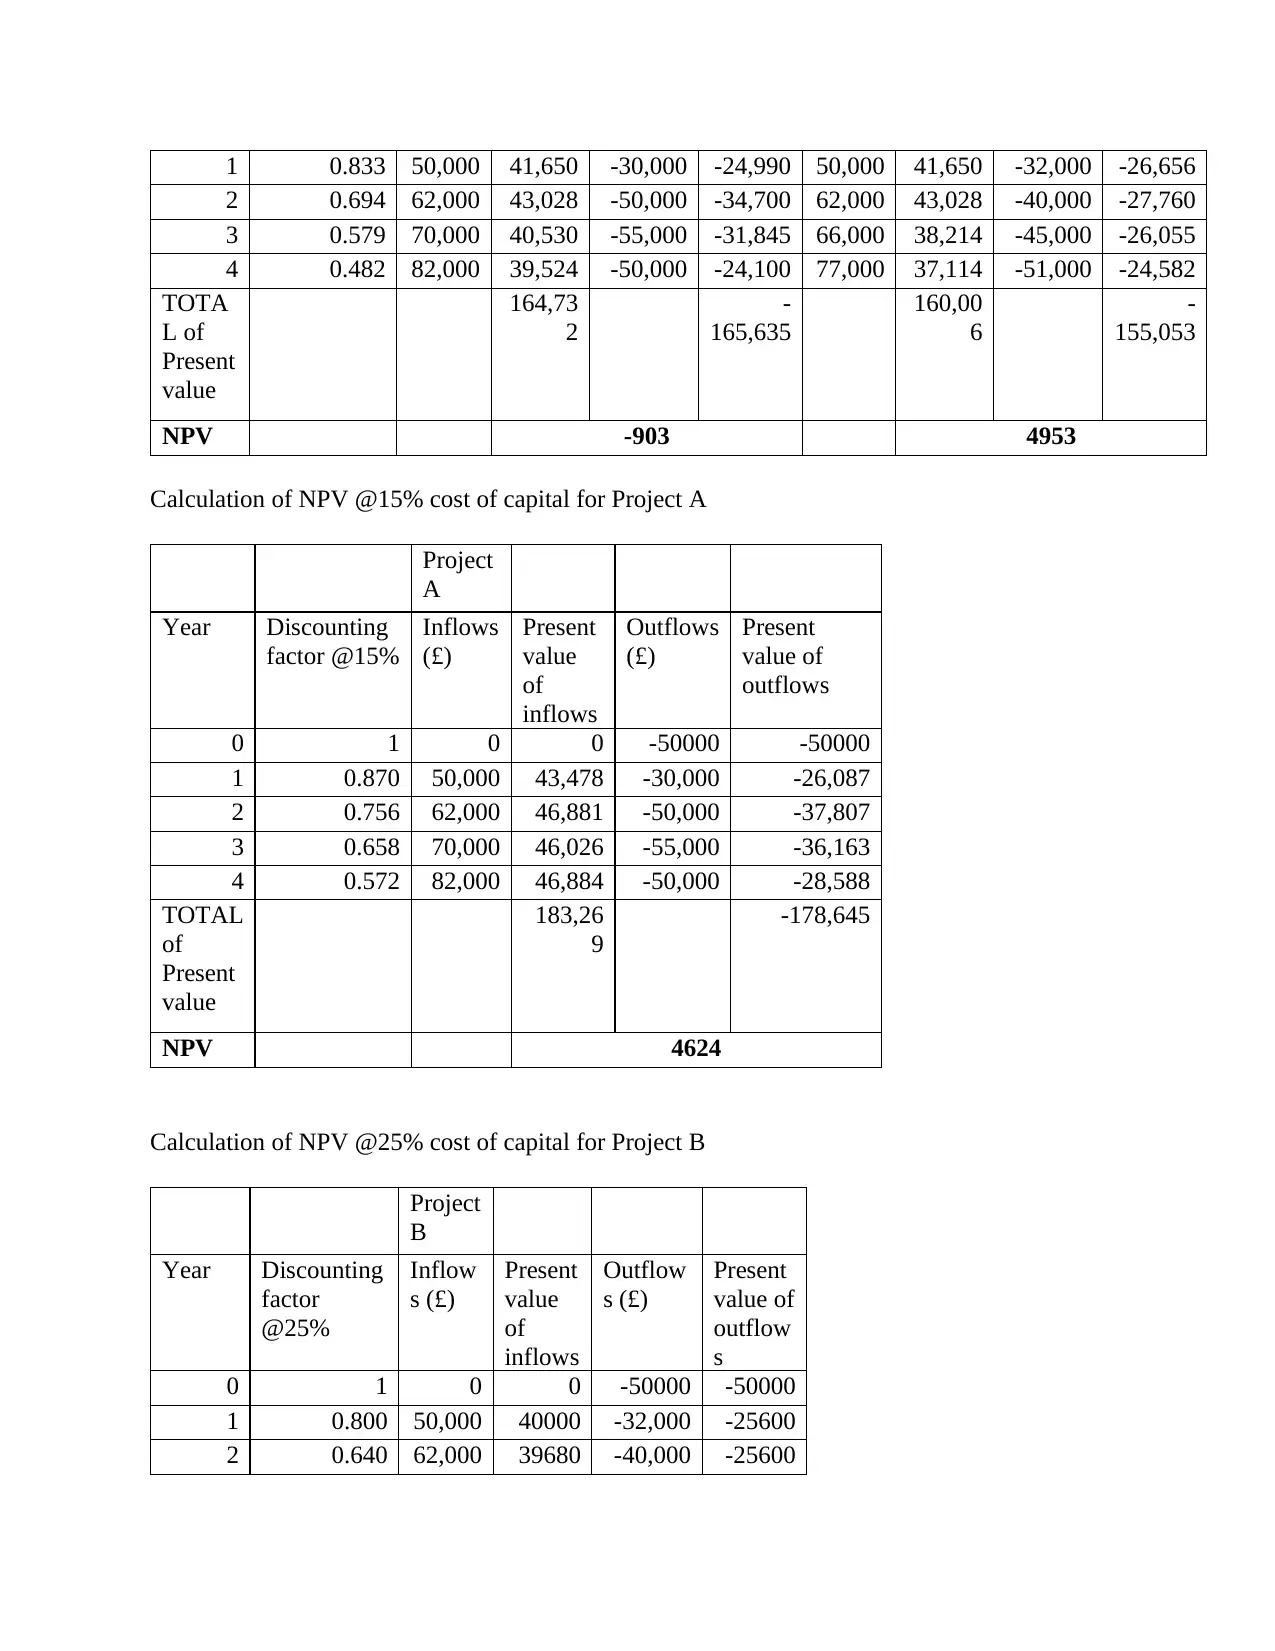
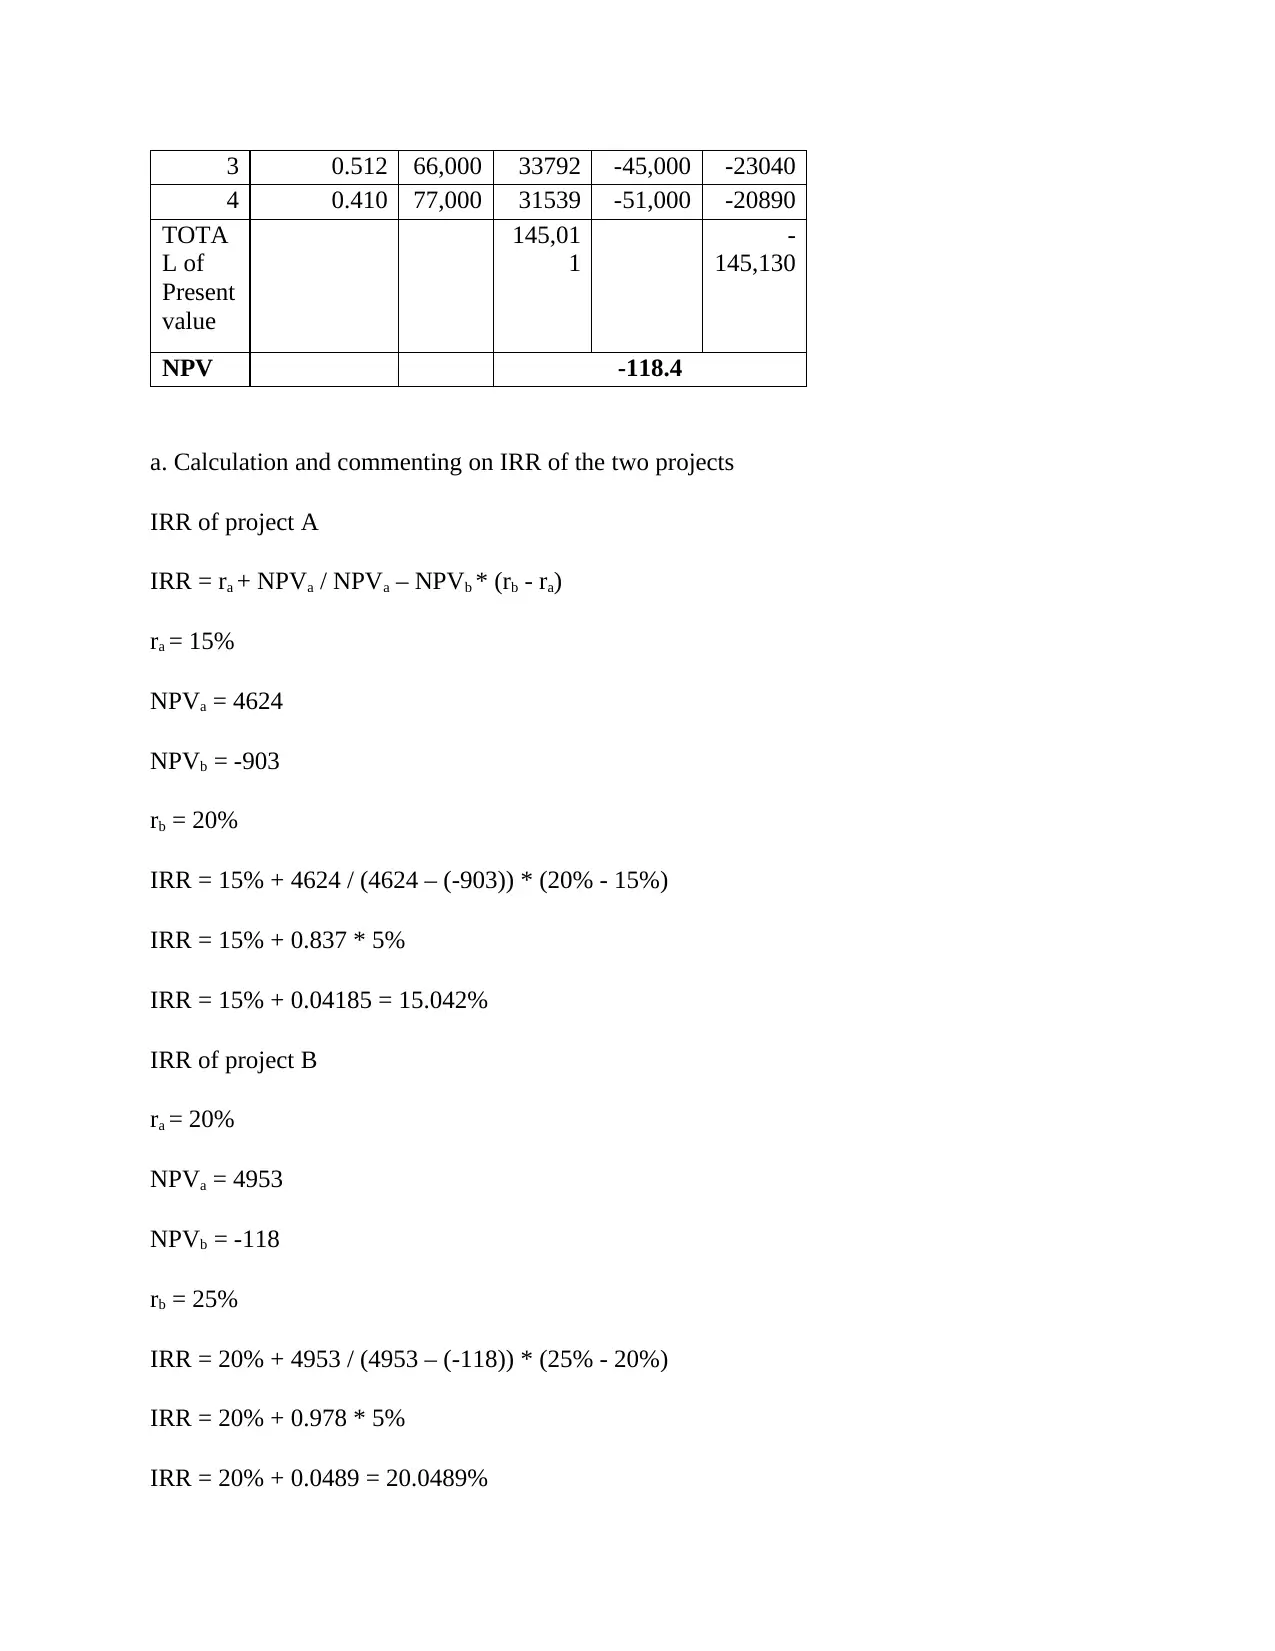
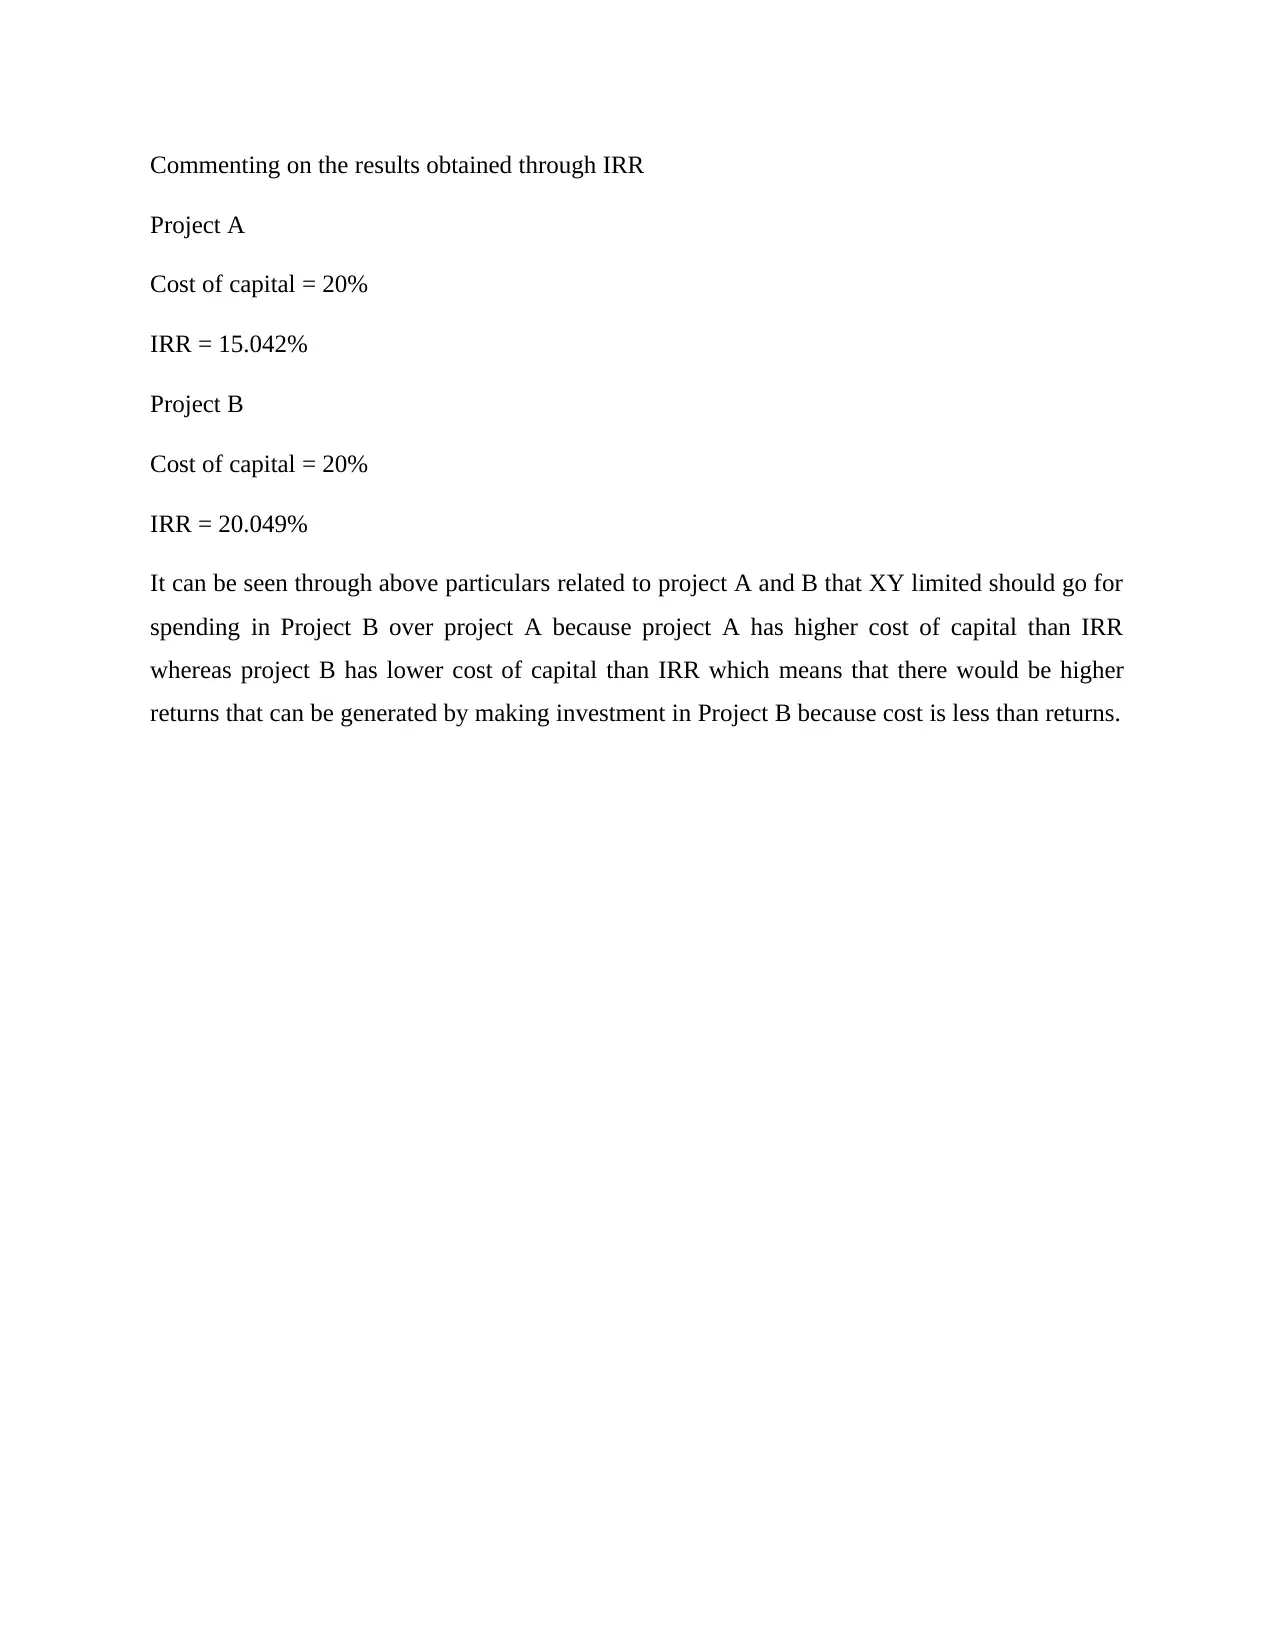
This assignment provides a detailed analysis of investment decision-making, focusing on Net Present Value (NPV) and Internal Rate of Return (IRR) calculations. It evaluates the financial viability of a new project for Q&Q Ltd, advising management on whether to invest based on the NPV result. The report also discusses other critical factors influencing investment decisions, such as risk, investment period, liquidity, taxation, inflation rate, and market volatility. Furthermore, the assignment includes statistical analysis, calculating the mean, median, mode, and range from a given data set, while also addressing the limitations of measures of central tendency and conditions where data distribution may not provide a realistic picture. Finally, it appraises capital investment decisions using mathematical tools like payback period, NPV, IRR, and accounting rate of return, along with calculations and commentary on IRR for two projects, ultimately recommending investment in Project B due to its higher IRR compared to the cost of capital. This document is available on Desklib, a platform offering a wide range of study resources for students.
Document Page
DECISION MAKING
tabler-icon-diamond-filled.svg

Secure Best Marks with AI Grader

Need help grading? Try our AI Grader for instant feedback on your assignments.
Document Page
Question 1
(a) Calculation of Net Present Value of New Project
Computation of Present Value of cash outflows
Years Cash outflows £
Discounting factor @14%
(cost of capital) Present value of cash outflows £
0 110000 1 110000
1 55000 0.877 48235
2 56000 0.769 43064
3 61000 0.675 41175
4 60000 0.592 35520
5 61000 0.519 31659
6 68000 0.456 31008
Total 340661
Computation of Present value of cash inflows
Years Cash inflows £
Discounting factor @14%
(cost of capital) Present value of cash inflows £
1 51000 0.877 44727
2 62000 0.769 47678
3 96000 0.675 64800
4 120000 0.592 71040
5 130000 0.519 67470
6 145000 0.456 66120
Document Page
Total 361835
Formula of Net Present Value = Present Value of Cash inflow – Present Value of cash outflow
= £361835 - £340661
= £21174
(b) Advise to management on financial viability of project
On the basis of the net present value result of above project, it is advisable to the
management of Q&Q ltd that they should invest the funds into this new project. It is because
NPV result are positive and if any project NPV comes positive than it is profitable for the
company. In simple term, the financial viability of this new project is good and also profitable to
the company. The NPV method is basically one of the best methods of investment appraisal
which is used to select one of the best and profitable investment projects out of various. It is
because this method incorporates time value of money and is simple way to determine whether
the project delivers value or not (Bogataj and Bogataj, 2019). Not only that, this method
considers the cost of capital in their calculation the impact of which returns are easily assessed
and helps in decision-making process. Thus, it is advisable to management of Q&Q ltd that they
should invest in this new project.
(c) Advise to management on other factors need to be consider while making investment
decision
The various other factors besides return on investment (ROI) that affect investment decision and
which have to be considered by management of Q&Q ltd while making investment decision are
as follows:
Risk: This is a factor which state that the higher the return, the higher the risk of losing
the money. Thus, if the company wants to invest in any project, they have to consider risk
factor thoroughly.
Document Page
Investment period: The period of investment is also one factor that influence the return
on investment. This investment period can be of short, medium and long term which need
to be consider while making investment decision.
Liquidity: The liquidity position of the investment has to be considered by the
management of Q&Q ltd while making investment decision. It is because if the
investment fails to quickly convert into cash at the time of emergency the company will
might became bankrupt (Abdelhady, 2021).
Taxation: This factor state that different investment has different tax rates which
influence investment decision. Thus, company have to invest in only such projects which
produces good after-tax income.
Inflation rate: The inflation rate also needs to be considered while making investment
related decision because when inflation rate rises, the purchasing power of the consumer
decreases.
Volatility: This factor indicates the fluctuations on investment markets. The volatility of
market is usually associated with investment risk. The level of volatility will have impact
over return of the investment which management of company have to consider during
decision-making related to investment (Abdelhady, 2021).
QUESTION: 3
Class interval Frequency
43 – 53 8
53 – 63 9
63 – 73 4
73 – 83 4
83 – 93 4
93 - 103 1
a. Plotting above data on a histogram
tabler-icon-diamond-filled.svg

Secure Best Marks with AI Grader

Need help grading? Try our AI Grader for instant feedback on your assignments.
Document Page
43 – 53 53 – 63 63 – 73 73 – 83 83 – 93 93 - 103
0
1
2
3
4
5
6
7
8
9
10
Frequency
b.
i. The mean
Class
interval
Frequency Midpoint fx
43 – 53 8 48 384
53 – 63 9 58 522
63 – 73 4 68 272
73 – 83 4 78 312
83 – 93 4 88 352
93 - 103 1 98 98
TOTAL 30 1940
Mean = ∑fx / ∑f = 1940 / 30 = 64.67
ii. The median
Class
interva
l
Frequen
cy
Cumulati
ve
frequency
43
53
8 8
53
63
9 17
63 4 21
Document Page
73
73
83
4 25
83
93
4 29
93 -
103
1 30
TOTA
L
30
Median class = n/2 = 30 / 2 = 15
Therefore median class = 53 - 63
Median
= lower limit of median class + (n / 2 – Cumulative frequency of the preceding class / f) * class
size
= 53 + (15 – 8 / 30) * 10
= 53 + 2.33 = 55.33 is the median.
iii. The mode
53 – 63 is the class with highest frequency that is 9.
Mode = L + (f1 – f0 / 2f1 – f0 – f2) * h
Mode = 53 + (9 – 8 / 2 * 9 – 8 – 4) * 10
Mode = 53 + (1 / 6) * 10 = 53 + 1.67 = 54.67 is the mode.
iv. The range
Maximum marks – minimum marks = 95 – 43 = 52
(c) Limitation of measures of central tendency
Limitation of Mean:
Document Page
The mean cannot be calculated for the category data. It is because the values of their data
cannot be summed (Xiong and et.al., 2021).
Another limitation of mean is such that the mean includes every value in the distribution
the impact of which they are highly influenced by outliers and skewed.
Limitation of Median:
The limitation of median is such that it does not use all the information available in the
data along with that it also does not take into account the precise value of each
observation.
The media is not amenable to further mathematical calculations just like the mean the
impact of which the median is not used in many other statistical tests (Ridley and et.al.,
2019).
Median of the pooled group cannot be expressed in the individual medians of pooled
group in the case if observation of two group is pooled together.
Limitation of Mode:
The only limitation of mode is such that it is not useful for statistical analysis. It is
because mode is not algebraically defined and also the chance of fluctuation is high in
case of small sample size (Feehan and et.al., 2018).
Condition when data distribution do not give realistic picture:
The only situation or condition when data distribution unable to provide realistic picture is when
data is not normally distributed (Jadhav, Pramod and Ramanathan, 2019). Too many extreme
values in the data distribution will result into the skewed distribution the impact of which
identifying the real picture is became quite tough. Normality of the data is basically achieved via
cleaning the data which involves determining measurement of data, data entry error and outliers
and remove the same from the data distribution for showing realistic picture of data set.
QUESTION: 5
I
tabler-icon-diamond-filled.svg

Paraphrase This Document

Need a fresh take? Get an instant paraphrase of this document with our AI Paraphraser
Document Page
(I) Mathematical tools to appraise capital investment decision in business
The various mathematical tools used to appraise capital investment decision are as follows:
Payback period: This is a tool used to identify the period in which the company will
receive its initial investment back. In order to compute payback period of investment
project, the company need to divide the initial investment by annual cash flow per year. It
is expressed in years and the project with lowest period is selected (Chrysafis and
Papadopoulos, 2021).
Net Present Value: This is another mathematical tool use for investment appraisal
decision making. Under this method, the company need to identify the present value of
cash inflow and outflow using the cost of capital discounting factors. The initial
investment is also used in NPV calculation and the investment project with higher and
positive NPV is selected.
Internal Rate of Return: This is a mathematical tool which is a discount rate used in
capital investment appraisal with the help of which cost of project and its future cash
inflows come into equality (Baddeley and Harcourt, 2021). The formula of IRR is present
value of cash inflows is must be equal to present value of cash outflows. This considers
the time value of money.
Accounting Rate of return: This is also one of the tools used for capital investment
decision which is also known as return on capital employed. This tool is easy to calculate
and unlike payback this tool does consider all the years involved in life of a project. It
adds back the depreciation into net profit in order to compute cash inflows.
II
Calculation of NPV @ 20% of cost of capital for both Project A and Project B
Project
A
Project
B
Year Discounting
factor
@20%
Inflow
s (£)
Present
value
of
inflows
Outflow
s (£)
Present
value of
outflow
s
Inflow
s (£)
Present
value
of
inflows
Outflow
s (£)
Present
value of
outflow
s
0 1 0 -50000 -50000 0 0 -50000 -50000
Document Page
1 0.833 50,000 41,650 -30,000 -24,990 50,000 41,650 -32,000 -26,656
2 0.694 62,000 43,028 -50,000 -34,700 62,000 43,028 -40,000 -27,760
3 0.579 70,000 40,530 -55,000 -31,845 66,000 38,214 -45,000 -26,055
4 0.482 82,000 39,524 -50,000 -24,100 77,000 37,114 -51,000 -24,582
TOTA
L of
Present
value
164,73
2
-
165,635
160,00
6
-
155,053
NPV -903 4953
Calculation of NPV @15% cost of capital for Project A
Project
A
Year Discounting
factor @15%
Inflows
(£)
Present
value
of
inflows
Outflows
(£)
Present
value of
outflows
0 1 0 0 -50000 -50000
1 0.870 50,000 43,478 -30,000 -26,087
2 0.756 62,000 46,881 -50,000 -37,807
3 0.658 70,000 46,026 -55,000 -36,163
4 0.572 82,000 46,884 -50,000 -28,588
TOTAL
of
Present
value
183,26
9
-178,645
NPV 4624
Calculation of NPV @25% cost of capital for Project B
Project
B
Year Discounting
factor
@25%
Inflow
s (£)
Present
value
of
inflows
Outflow
s (£)
Present
value of
outflow
s
0 1 0 0 -50000 -50000
1 0.800 50,000 40000 -32,000 -25600
2 0.640 62,000 39680 -40,000 -25600
Document Page
3 0.512 66,000 33792 -45,000 -23040
4 0.410 77,000 31539 -51,000 -20890
TOTA
L of
Present
value
145,01
1
-
145,130
NPV -118.4
a. Calculation and commenting on IRR of the two projects
IRR of project A
IRR = ra + NPVa / NPVa – NPVb * (rb - ra)
ra = 15%
NPVa = 4624
NPVb = -903
rb = 20%
IRR = 15% + 4624 / (4624 – (-903)) * (20% - 15%)
IRR = 15% + 0.837 * 5%
IRR = 15% + 0.04185 = 15.042%
IRR of project B
ra = 20%
NPVa = 4953
NPVb = -118
rb = 25%
IRR = 20% + 4953 / (4953 – (-118)) * (25% - 20%)
IRR = 20% + 0.978 * 5%
IRR = 20% + 0.0489 = 20.0489%
tabler-icon-diamond-filled.svg

Secure Best Marks with AI Grader

Need help grading? Try our AI Grader for instant feedback on your assignments.
Document Page
Commenting on the results obtained through IRR
Project A
Cost of capital = 20%
IRR = 15.042%
Project B
Cost of capital = 20%
IRR = 20.049%
It can be seen through above particulars related to project A and B that XY limited should go for
spending in Project B over project A because project A has higher cost of capital than IRR
whereas project B has lower cost of capital than IRR which means that there would be higher
returns that can be generated by making investment in Project B because cost is less than returns.
Document Page
REFERENCES
Books and journals
Baddeley, M. and Harcourt, G., 2021. A Behavioural Model of Investment Appraisal and its
Implications for the Macroeconomy (No. 2021/05).
Chrysafis, K. A. and Papadopoulos, B. K., 2021. Decision making for project appraisal in
uncertain environments: A fuzzy-possibilistic approach of the expanded NPV
method. Symmetry. 13(1). p.27.
Jadhav, A., Pramod, D. and Ramanathan, K., 2019. Comparison of performance of data
imputation methods for numeric dataset. Applied Artificial Intelligence. 33(10). pp.913-
933.
Feehan, L. M. and et.al., 2018. Accuracy of Fitbit devices: systematic review and narrative
syntheses of quantitative data. JMIR mHealth and uHealth. 6(8). p.e10527.
Ridley, E. J. and et.al., 2019. What happens to nutrition intake in the post–intensive care unit
hospitalization period? An observational cohort study in critically ill adults. Journal of
Parenteral and Enteral Nutrition. 43(1). pp.88-95.
Xiong, Z. Y. and et.al., 2021. ADD: a new average divergence difference-based outlier detection
method with skewed distribution of data objects. Applied Intelligence, pp.1-25.
Abdelhady, S., 2021. Performance and cost evaluation of solar dish power plant: sensitivity
analysis of levelized cost of electricity (LCOE) and net present value (NPV). Renewable
Energy. 168. pp.332-342.
Bogataj, D. and Bogataj, M., 2019. NPV approach to material requirements planning theory–a
50-year review of these research achievements. International Journal of Production
Research, 57(15-16), pp.5137-5153.
Document Page
chevron_up_icon
1 out of 13
circle_padding
hide_on_mobile
zoom_out_icon
logo.png

Your All-in-One AI-Powered Toolkit for Academic Success.

Available 24*7 on WhatsApp / Email

[object Object]