Financial Analysis, Investment Appraisal and Strategy Report - FIN4001
VerifiedAdded on 2023/06/04
|17
|4066
|229
Report
AI Summary
This report provides a comprehensive financial analysis of a business, encompassing various aspects of financial management. It begins with an introduction to finance and then delves into the calculation and interpretation of key financial ratios, such as gross profit margin, asset usage ratio, current ratio, and debt-to-equity ratio, using data from 2018 and 2019. The report also examines the significance of considering financial statement users during analysis. Furthermore, the report includes a cash flow forecast, break-even point calculations, and margin of safety analysis for two different business strategies. Finally, the report utilizes capital investment appraisal techniques, including payback period, net present value, and average rate of return, to evaluate and compare investment projects, concluding with a discussion of investment appraisal approaches and the most efficient investment option. The report aims to assess the financial health, performance, and investment potential of the business, offering insights into its strengths, weaknesses, and strategic decisions.

FIN4001 Introduction
to Finance
to Finance
Paraphrase This Document
Need a fresh take? Get an instant paraphrase of this document with our AI Paraphraser
Contents
INTRODUCTION...........................................................................................................................3
MAIN BODY...................................................................................................................................3
Question 1........................................................................................................................................3
1.Calculation of ratios for year 2019 and year 2018....................................................................3
2.Significance of taking the users of the financial statements into consideration when
analysing the financials................................................................................................................5
Question 2........................................................................................................................................6
1.The Opening financial position at the start of July 20X5.........................................................6
2.Monthly cash flow forecast.......................................................................................................6
3.Explain the type of additive expenses that the owners of the business should take into
consideration for acquiring the needed financial assistance of overdraft....................................7
Question 3 .......................................................................................................................................8
1. Compute the Break even point (BEP) in units and in sales.....................................................8
2.Margin of safety (MOS) for the year ended 2019 and 2020.....................................................9
3. Critically evaluate and assess the strategy formulated by Jessica.........................................11
Question 4......................................................................................................................................11
1. Compute the Pay back period, Net present value and Average rate of return for every
potential investment project of the business..............................................................................11
2. Determine the most efficient investment as per the computations presented above.............14
3.Critically discuss the approaches to investment appraisal......................................................14
CONCLUSION .............................................................................................................................16
REFERENCES..............................................................................................................................17
INTRODUCTION
Finance which is also termed as financial economics refers to the discipline and study of
money in a financial stable system. It primarily involves dealings of financial funds in between
the borrowers, investors and lenders of the money. The process of finance is attached to
channelling the huge funds that are available in various different forms such as credits, loans or
capital to be invested to businesses and firms which need the finances the most or can utilise
them most efficiently (Bals, 2019). In this report, the financial statements, accounting ratios such
as gross profit margin, assets usage, acid test ratio, inventories holding period, current ratio and
debt to equity ratio and the cash budget of respective businesses have been computed to evaluate
and assess the financial positioning and financial strength of the businesses. The report also
involves computing three different investments of an enterprise to evaluate the most efficient
among the three by utilising the capital investment appraisal techniques.
MAIN BODY
Question 1
1.Calculation of ratios for year 2019 and year 2018.
Gross profit margin = ( Sales - Cost of goods sold ) * 100 / Sales
=(3495 – 2182 ) *100 / 3495
=(1313 / 3495 ) *100
=
Interpretation- The gross profit ratio helps in analysing the gross profitable efficiency of the
business enterprise. This ratio shows the relationship between the gross sales of the business and
the profit of the enterprise. The ideal gross profit ratio stands somewhere between 50-70%, here
the gross profit of the company is 37.57 % which shows that the business profits being generated
are not very good and the company requires to boost its sales and the profits generated therefore
(Hirst, 2020).
Asset Usage Ratio= Total Sales / Average Total Assets
= 3495 / [( 3812 + 2503 ) / 2]
= 3495 / 3157.5
= 1.10 times
⊘ This is a preview!⊘
Do you want full access?
Subscribe today to unlock all pages.
Trusted by 1+ million students worldwide
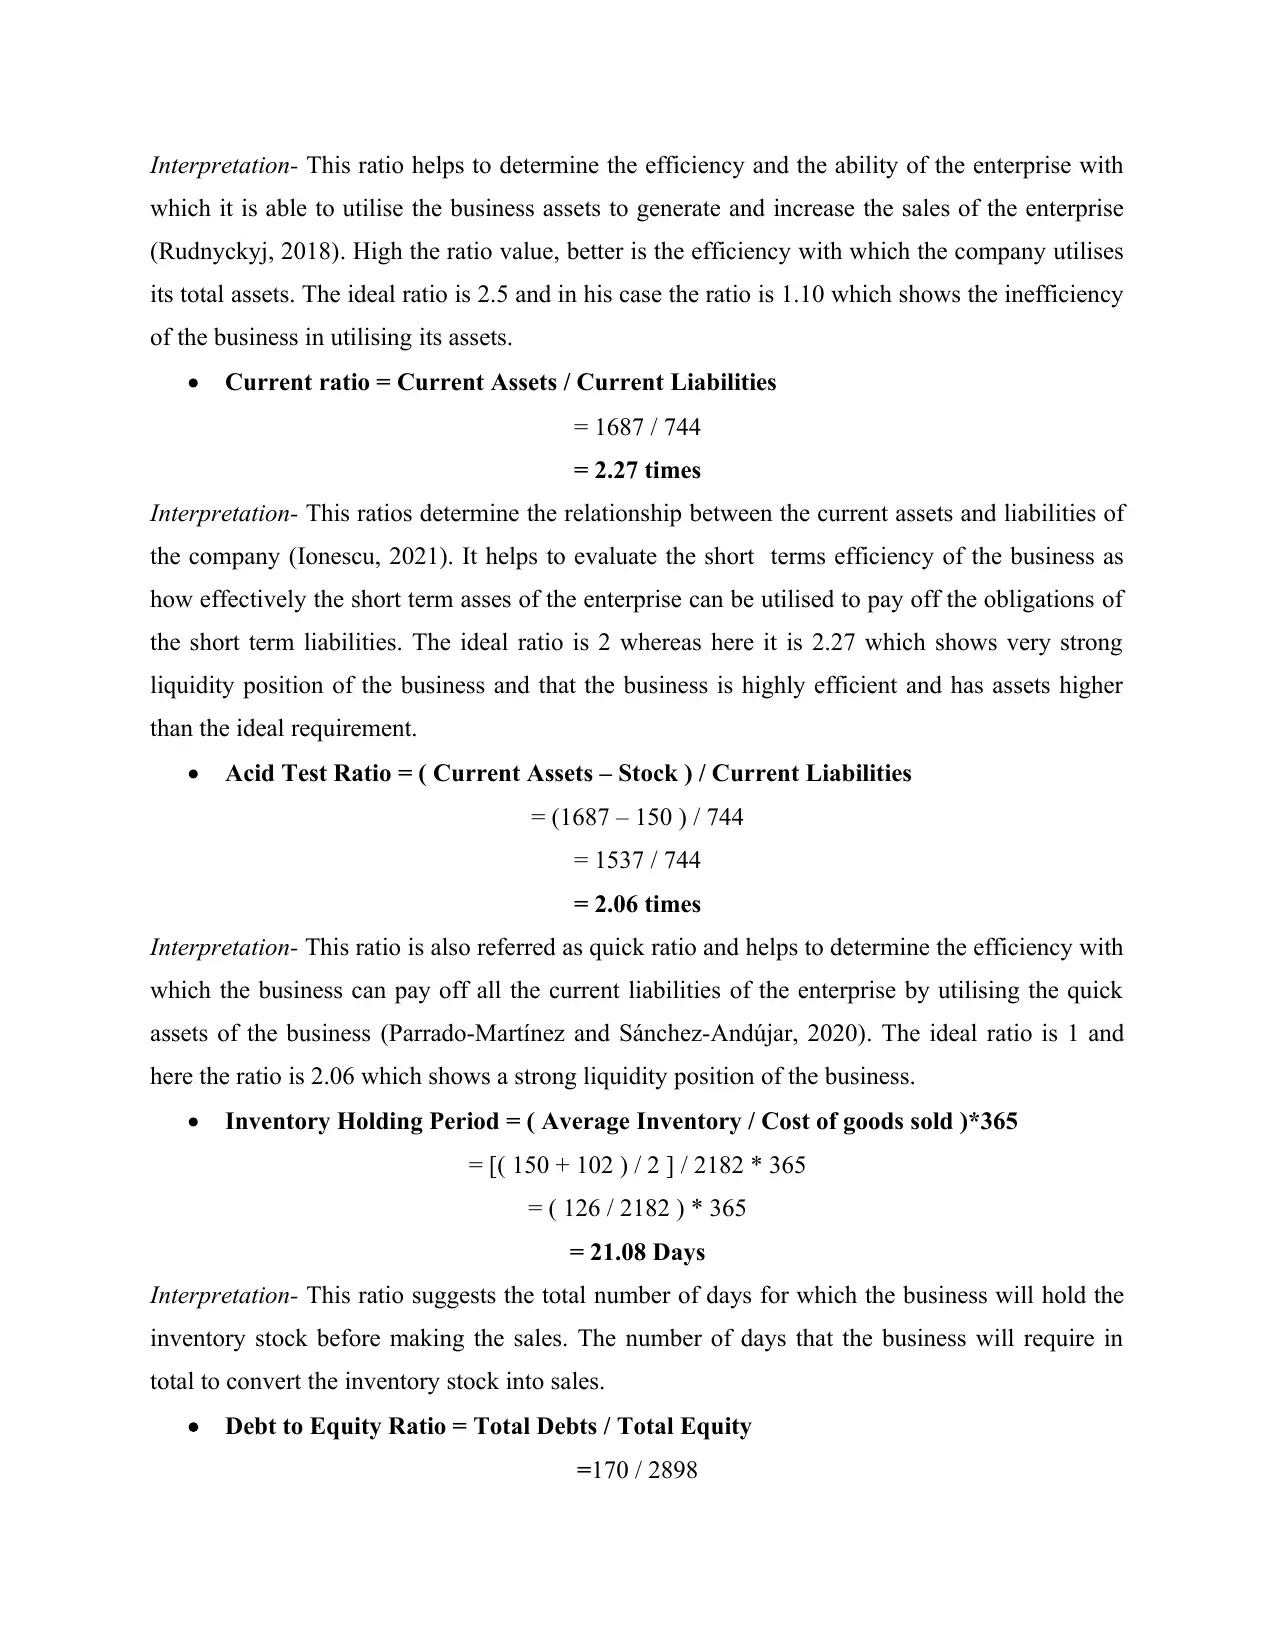
Interpretation- This ratio helps to determine the efficiency and the ability of the enterprise with
which it is able to utilise the business assets to generate and increase the sales of the enterprise
(Rudnyckyj, 2018). High the ratio value, better is the efficiency with which the company utilises
its total assets. The ideal ratio is 2.5 and in his case the ratio is 1.10 which shows the inefficiency
of the business in utilising its assets.
Current ratio = Current Assets / Current Liabilities
= 1687 / 744
= 2.27 times
Interpretation- This ratios determine the relationship between the current assets and liabilities of
the company (Ionescu, 2021). It helps to evaluate the short terms efficiency of the business as
how effectively the short term asses of the enterprise can be utilised to pay off the obligations of
the short term liabilities. The ideal ratio is 2 whereas here it is 2.27 which shows very strong
liquidity position of the business and that the business is highly efficient and has assets higher
than the ideal requirement.
Acid Test Ratio = ( Current Assets – Stock ) / Current Liabilities
= (1687 – 150 ) / 744
= 1537 / 744
= 2.06 times
Interpretation- This ratio is also referred as quick ratio and helps to determine the efficiency with
which the business can pay off all the current liabilities of the enterprise by utilising the quick
assets of the business (Parrado-Martínez and Sánchez-Andújar, 2020). The ideal ratio is 1 and
here the ratio is 2.06 which shows a strong liquidity position of the business.
Inventory Holding Period = ( Average Inventory / Cost of goods sold )*365
= [( 150 + 102 ) / 2 ] / 2182 * 365
= ( 126 / 2182 ) * 365
= 21.08 Days
Interpretation- This ratio suggests the total number of days for which the business will hold the
inventory stock before making the sales. The number of days that the business will require in
total to convert the inventory stock into sales.
Debt to Equity Ratio = Total Debts / Total Equity
=170 / 2898
Paraphrase This Document
Need a fresh take? Get an instant paraphrase of this document with our AI Paraphraser
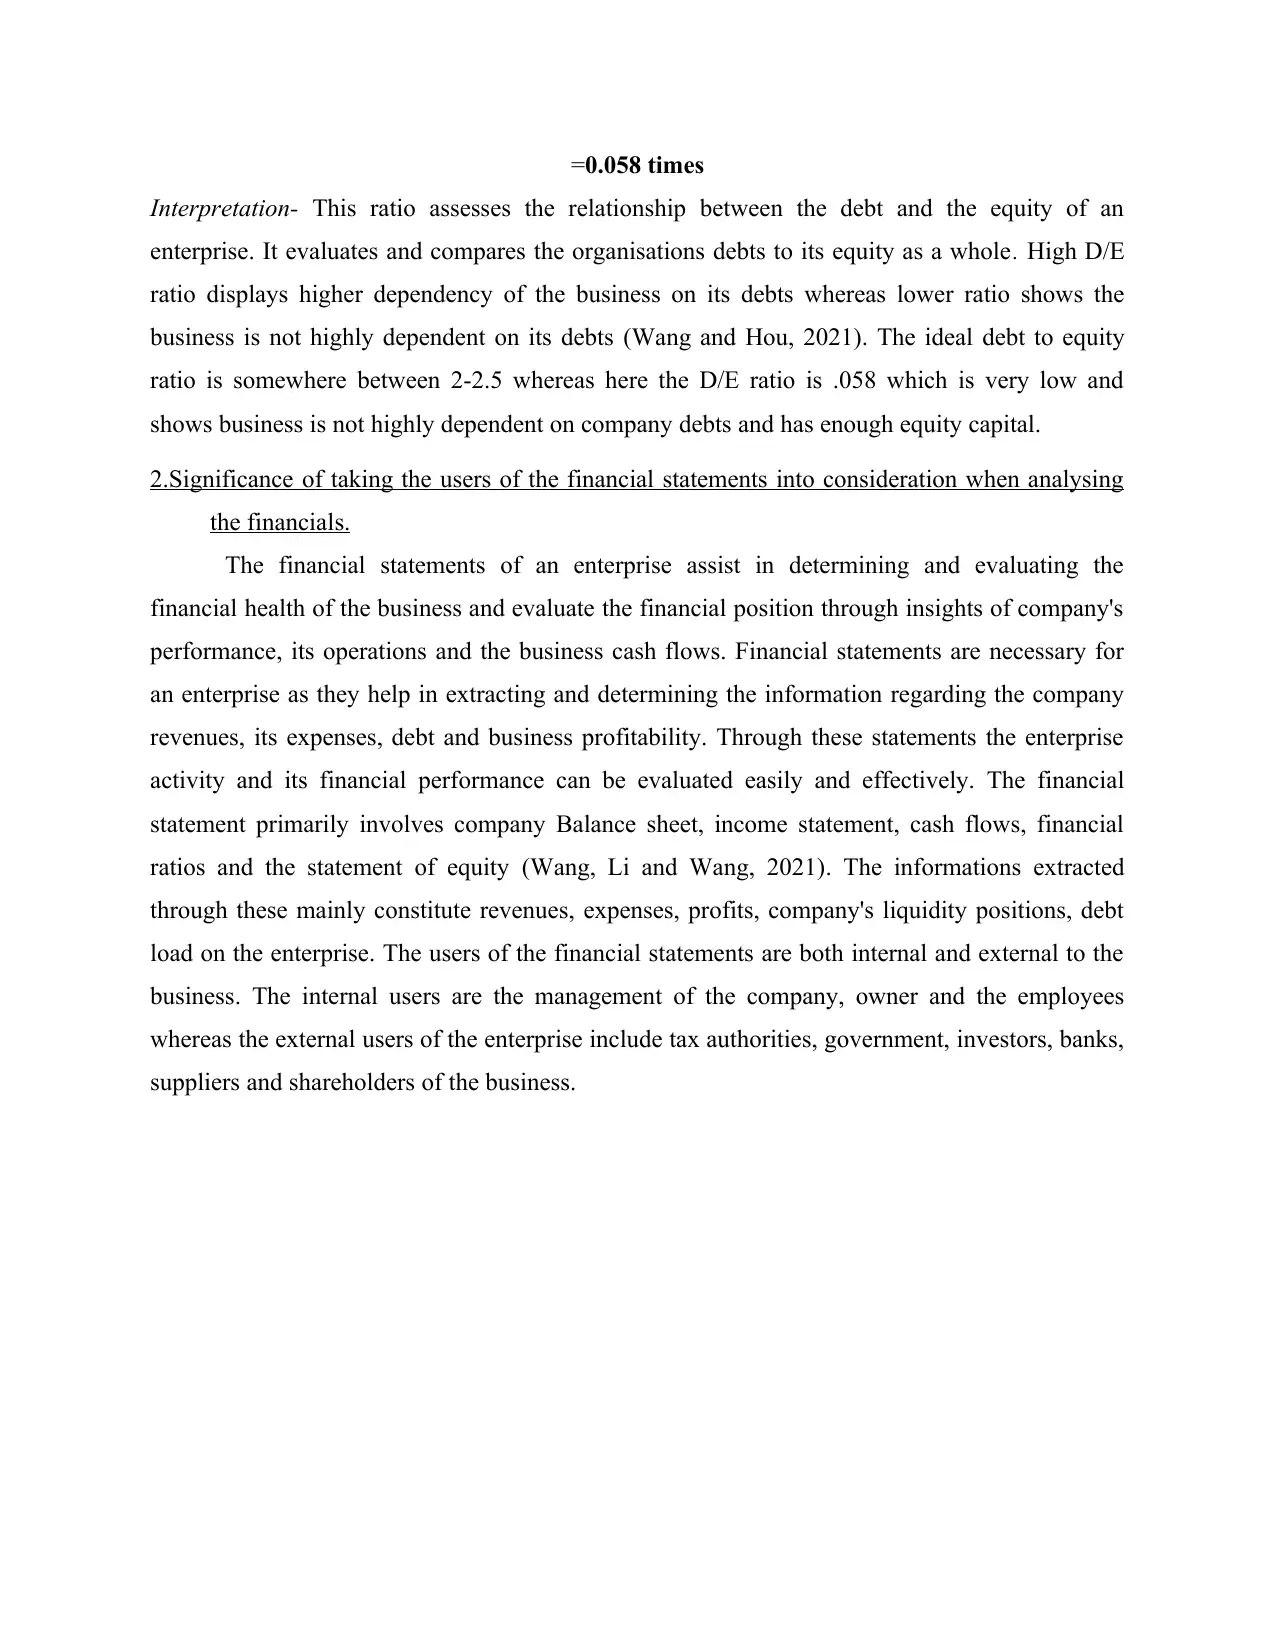
=0.058 times
Interpretation- This ratio assesses the relationship between the debt and the equity of an
enterprise. It evaluates and compares the organisations debts to its equity as a whole. High D/E
ratio displays higher dependency of the business on its debts whereas lower ratio shows the
business is not highly dependent on its debts (Wang and Hou, 2021). The ideal debt to equity
ratio is somewhere between 2-2.5 whereas here the D/E ratio is .058 which is very low and
shows business is not highly dependent on company debts and has enough equity capital.
2.Significance of taking the users of the financial statements into consideration when analysing
the financials.
The financial statements of an enterprise assist in determining and evaluating the
financial health of the business and evaluate the financial position through insights of company's
performance, its operations and the business cash flows. Financial statements are necessary for
an enterprise as they help in extracting and determining the information regarding the company
revenues, its expenses, debt and business profitability. Through these statements the enterprise
activity and its financial performance can be evaluated easily and effectively. The financial
statement primarily involves company Balance sheet, income statement, cash flows, financial
ratios and the statement of equity (Wang, Li and Wang, 2021). The informations extracted
through these mainly constitute revenues, expenses, profits, company's liquidity positions, debt
load on the enterprise. The users of the financial statements are both internal and external to the
business. The internal users are the management of the company, owner and the employees
whereas the external users of the enterprise include tax authorities, government, investors, banks,
suppliers and shareholders of the business.
Question 2
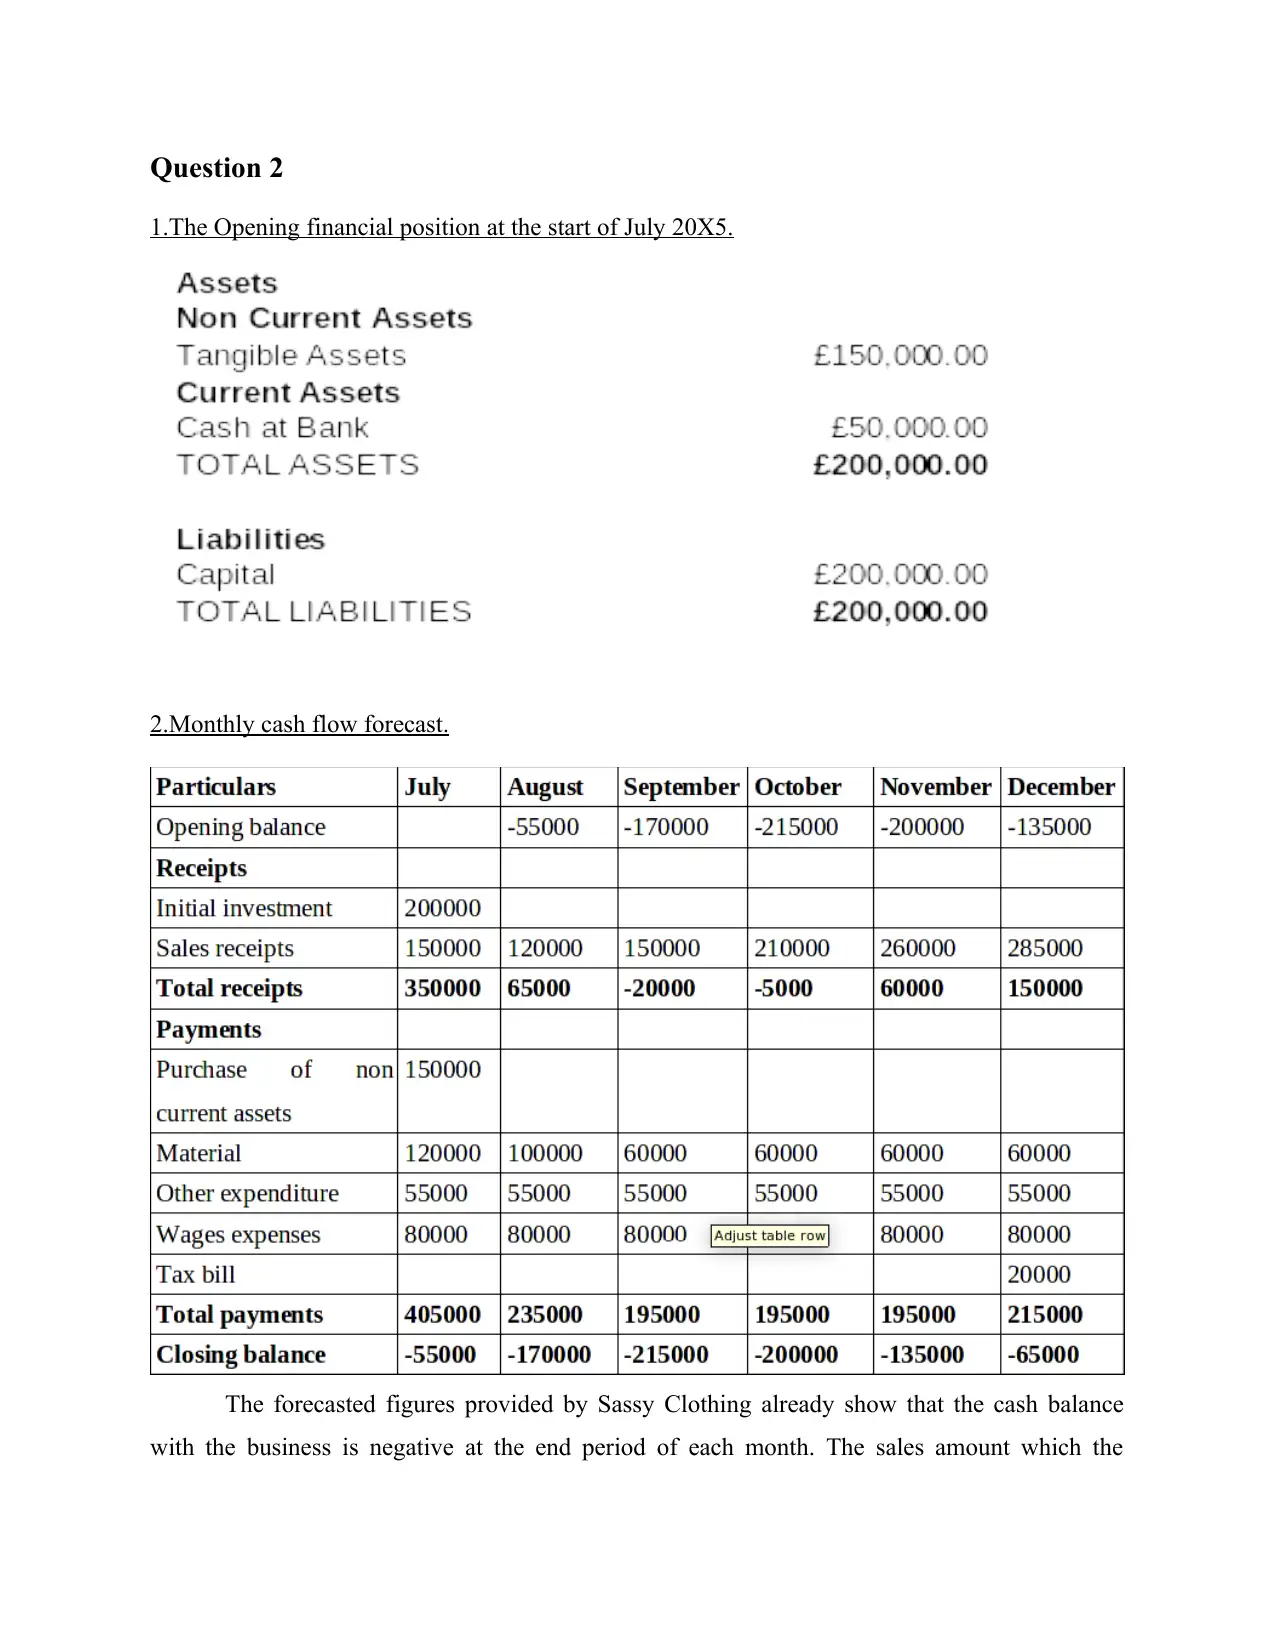
1.The Opening financial position at the start of July 20X5.
2.Monthly cash flow forecast.
The forecasted figures provided by Sassy Clothing already show that the cash balance
with the business is negative at the end period of each month. The sales amount which the
1.The Opening financial position at the start of July 20X5.
2.Monthly cash flow forecast.
The forecasted figures provided by Sassy Clothing already show that the cash balance
with the business is negative at the end period of each month. The sales amount which the
⊘ This is a preview!⊘
Do you want full access?
Subscribe today to unlock all pages.
Trusted by 1+ million students worldwide
business expects after 6 months of its working is expected to be £1,175,000. It can be evaluated
that the business has had higher expenses that the revenue earned in the months of August,
September, October, November due to which they had to avail the overdraft facilities from the
banks (Berrou, Dessertine and Migliorelli, 2019). The business requires to improve their internal
as well as external performance and operations so that it can utilise the maximum capabilities of
the enterprise and achieve maximum optimisation and effectiveness in the business performance.
The business is required to negotiate with the bank manger for short term loans, approval of the
credit limit desired by the business to avail the loans in shorter times durations also and acquire
loans at lower interest rates. This will help Sassy Clothing to accelerate and improve their
revenues which will then better their cash balances in each month. The cash balances in the
business will be maintained successfully when the business continues to earn high revenues and
make lesser expenses with regards to the business raw materials, reducing unwanted experiences.
3.Explain the type of additive expenses that the owners of the business should take into
consideration for acquiring the needed financial assistance of overdraft.
The company is required to consider the expenses incurred in the months of July and
December which include utility bills, rents, operating expenses and the payment made to the
suppliers of the business. The overdraft facility of the loan helps to furnish the facility of
immediate access to additional financial funds to the enterprise. It also assists to handle any such
mismatch between the timings where the business suffered with unavailability of cash to
continue the business operations and hence maintain effective cash records (Shao and et.al.,
2022). By utilising the bank overdrafts the business can make the necessary organisational
payments and pay off the essential expenses on time avoiding any payment defaults.
Paraphrase This Document
Need a fresh take? Get an instant paraphrase of this document with our AI Paraphraser
Question 3
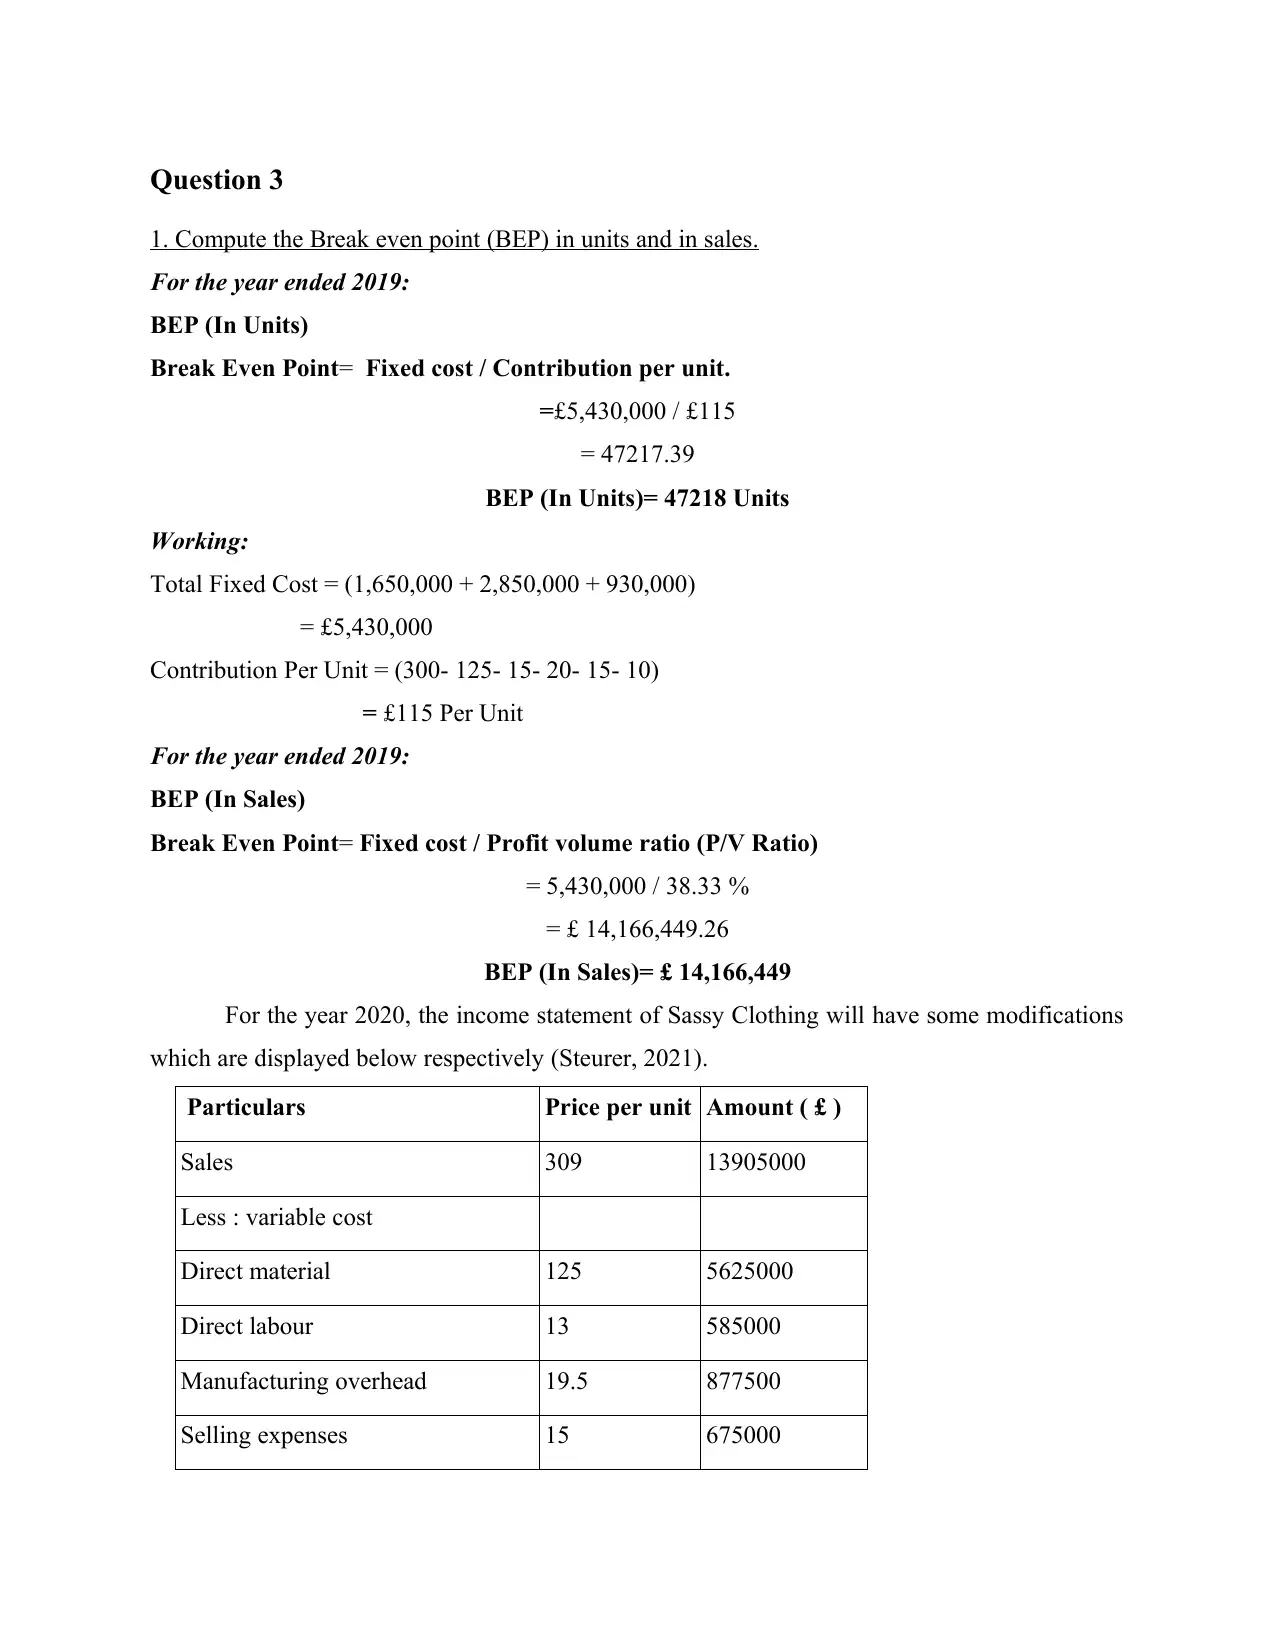
1. Compute the Break even point (BEP) in units and in sales.
For the year ended 2019:
BEP (In Units)
Break Even Point= Fixed cost / Contribution per unit.
=£5,430,000 / £115
= 47217.39
BEP (In Units)= 47218 Units
Working:
Total Fixed Cost = (1,650,000 + 2,850,000 + 930,000)
= £5,430,000
Contribution Per Unit = (300- 125- 15- 20- 15- 10)
= £115 Per Unit
For the year ended 2019:
BEP (In Sales)
Break Even Point= Fixed cost / Profit volume ratio (P/V Ratio)
= 5,430,000 / 38.33 %
= £ 14,166,449.26
BEP (In Sales)= £ 14,166,449
For the year 2020, the income statement of Sassy Clothing will have some modifications
which are displayed below respectively (Steurer, 2021).
Particulars Price per unit Amount ( £ )
Sales 309 13905000
Less : variable cost
Direct material 125 5625000
Direct labour 13 585000
Manufacturing overhead 19.5 877500
Selling expenses 15 675000
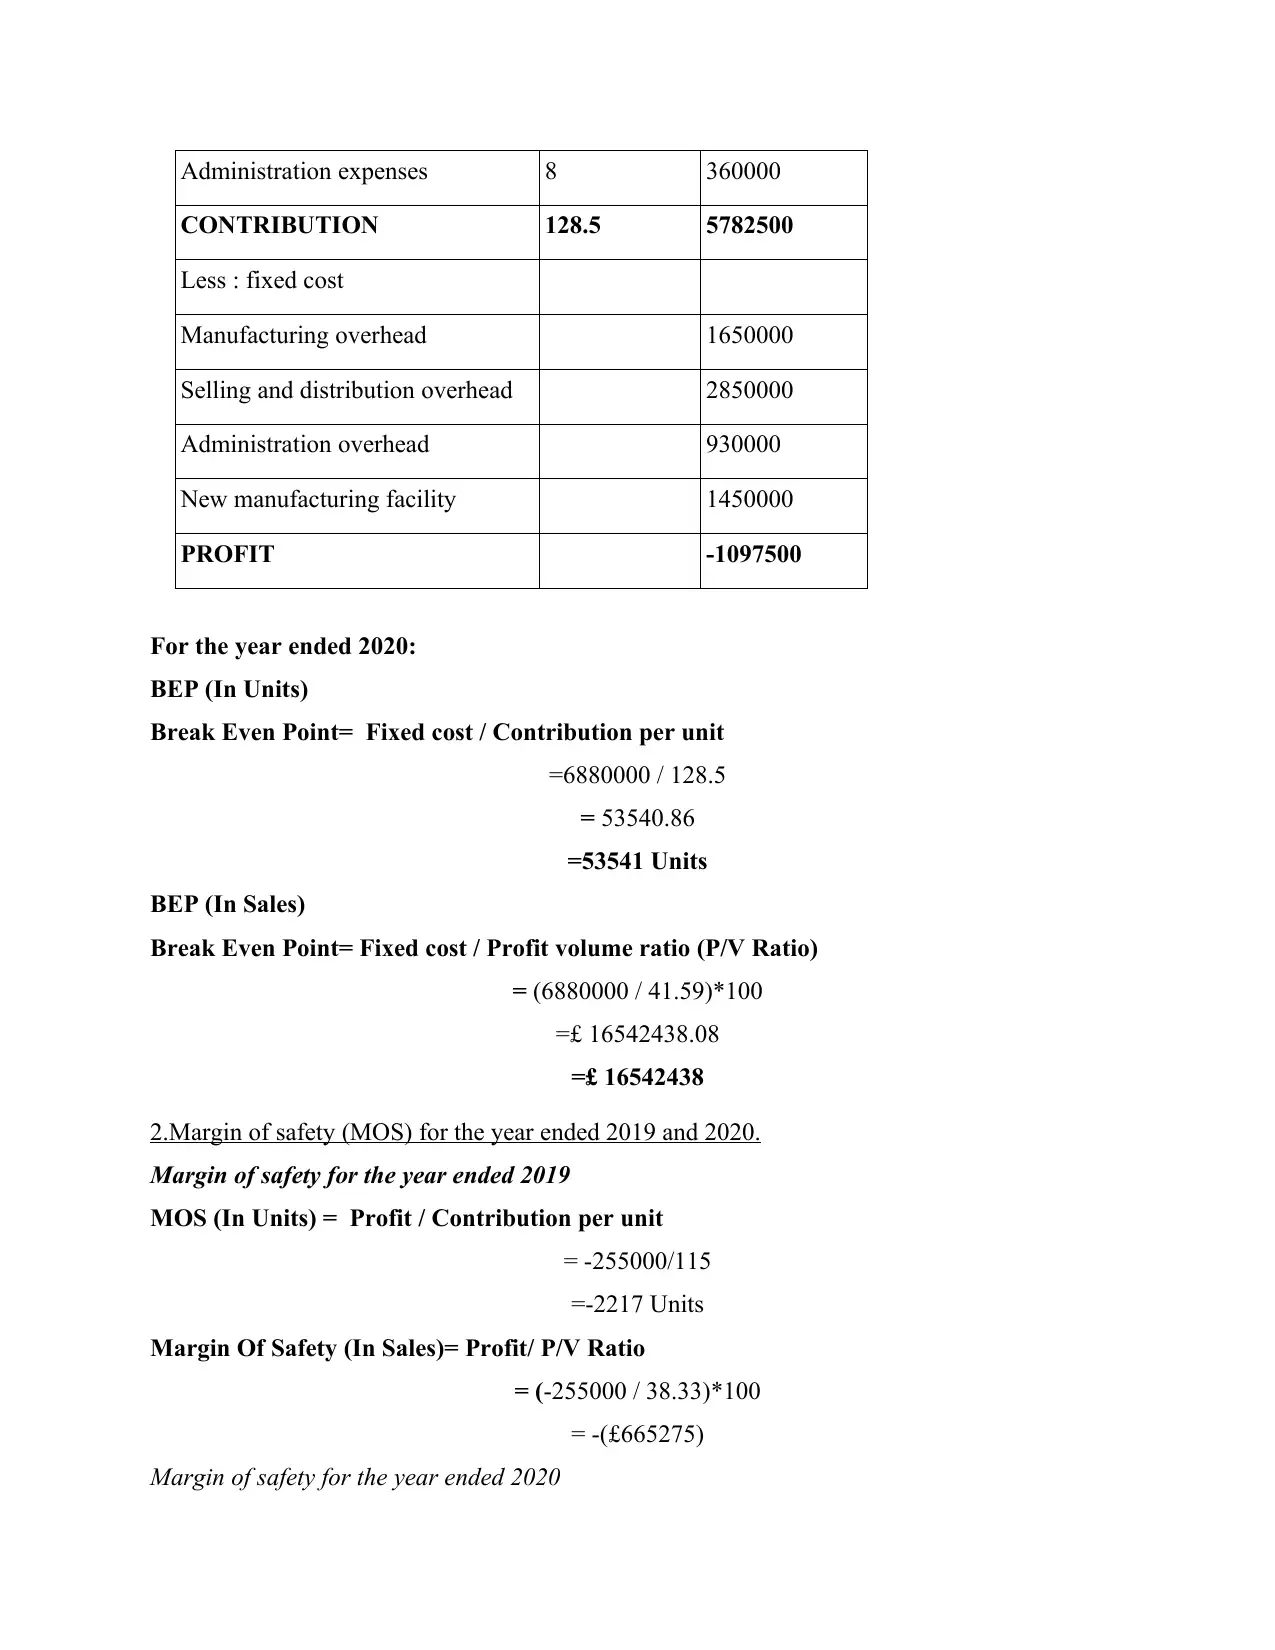
Administration expenses 8 360000
CONTRIBUTION 128.5 5782500
Less : fixed cost
Manufacturing overhead 1650000
Selling and distribution overhead 2850000
Administration overhead 930000
New manufacturing facility 1450000
PROFIT -1097500
For the year ended 2020:
BEP (In Units)
Break Even Point= Fixed cost / Contribution per unit
=6880000 / 128.5
= 53540.86
=53541 Units
BEP (In Sales)
Break Even Point= Fixed cost / Profit volume ratio (P/V Ratio)
= (6880000 / 41.59)*100
=£ 16542438.08
=£ 16542438
2.Margin of safety (MOS) for the year ended 2019 and 2020.
Margin of safety for the year ended 2019
MOS (In Units) = Profit / Contribution per unit
= -255000/115
=-2217 Units
Margin Of Safety (In Sales)= Profit/ P/V Ratio
= (-255000 / 38.33)*100
= -(£665275)
Margin of safety for the year ended 2020
⊘ This is a preview!⊘
Do you want full access?
Subscribe today to unlock all pages.
Trusted by 1+ million students worldwide
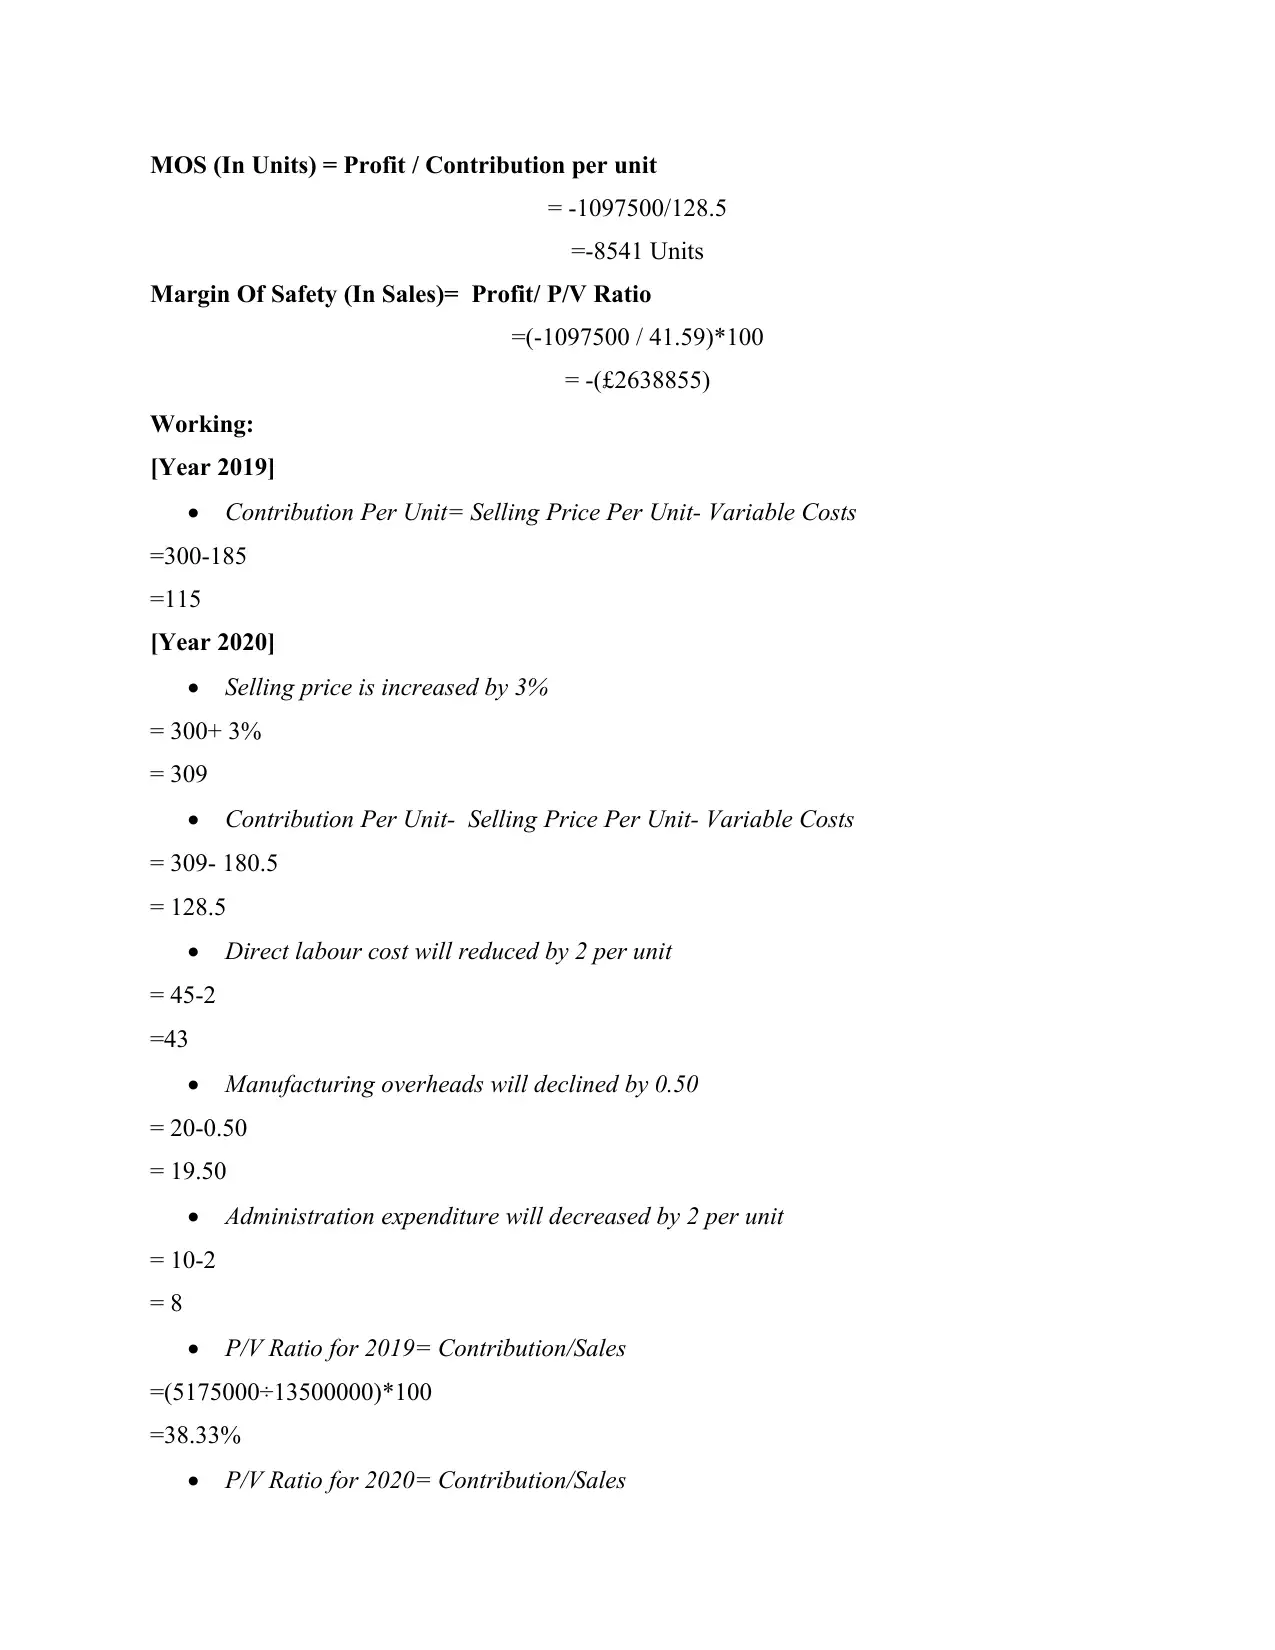
MOS (In Units) = Profit / Contribution per unit
= -1097500/128.5
=-8541 Units
Margin Of Safety (In Sales)= Profit/ P/V Ratio
=(-1097500 / 41.59)*100
= -(£2638855)
Working:
[Year 2019]
Contribution Per Unit= Selling Price Per Unit- Variable Costs
=300-185
=115
[Year 2020]
Selling price is increased by 3%
= 300+ 3%
= 309
Contribution Per Unit- Selling Price Per Unit- Variable Costs
= 309- 180.5
= 128.5
Direct labour cost will reduced by 2 per unit
= 45-2
=43
Manufacturing overheads will declined by 0.50
= 20-0.50
= 19.50
Administration expenditure will decreased by 2 per unit
= 10-2
= 8
P/V Ratio for 2019= Contribution/Sales
=(5175000÷13500000)*100
=38.33%
P/V Ratio for 2020= Contribution/Sales
Paraphrase This Document
Need a fresh take? Get an instant paraphrase of this document with our AI Paraphraser
=(5782500÷13905000)*100
=41.58%
3. Critically evaluate and assess the strategy formulated by Jessica.
The two respective strategies have been evaluated in the computations made above. It is
hence evaluated that the new strategy formulated incurs higher financial risk. The BEP of the
previous strategy of 2019 comes as 47218 and of the new strategy of 2020 comes to be 53541 in
units. The MOS in sales of the two strategies as of 2019 is -£665275 and of 2020 is -£26388550.
Both the strategies displayed very low and negative margin of safety (Zhang, Zhang and Managi,
2019). But it can be assessed looking at the numbers that the new strategy made the MOS worse
as 2019. Hence the business should think upon to apply effective growth strategies, accelerate
the organisational sales and boost the business growth through intense promotion and other
effective tools. To attain additional growth, the business has already spent an additional amount
of £1,450,000 on its fixed costs which is also a primary reason why the business is facing high
costs and losses.
Question 4
1. Compute the Pay back period, Net present value and Average rate of return for every potential
investment project of the business.
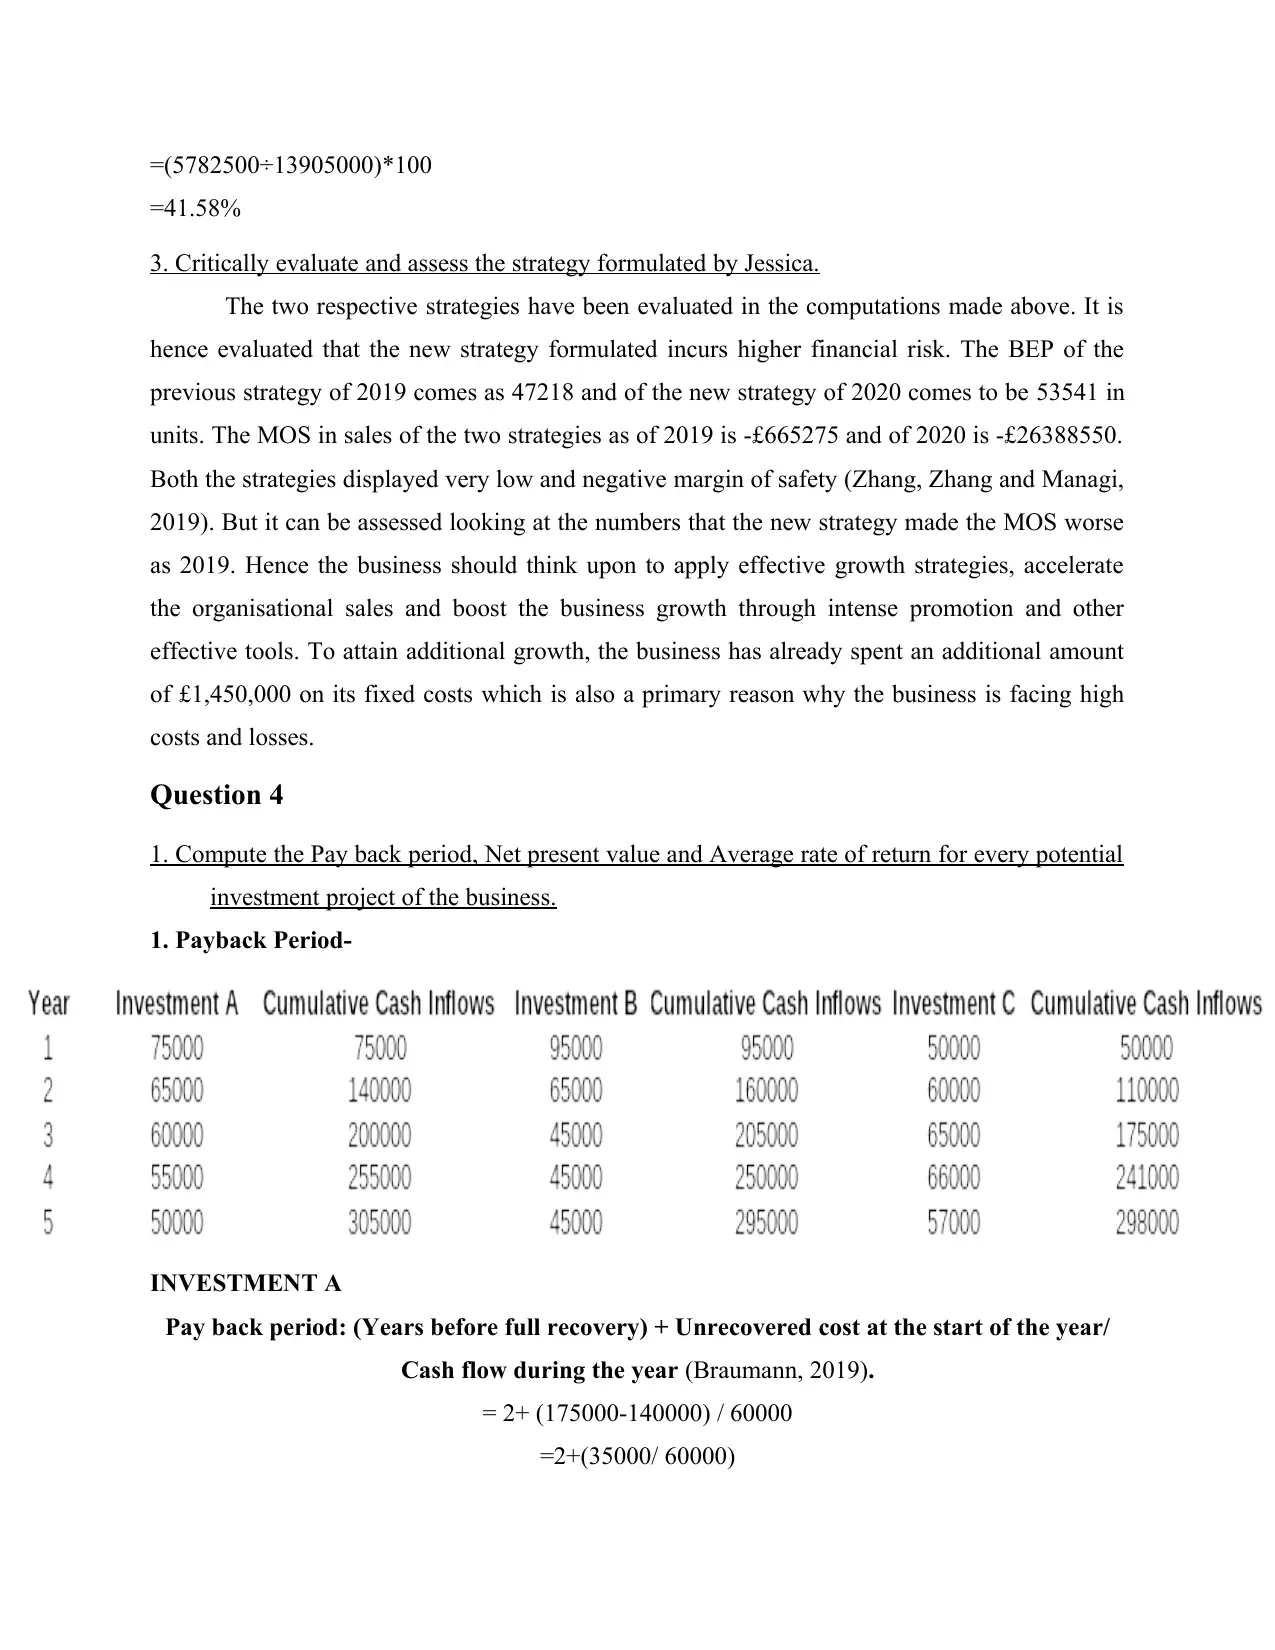
1. Payback Period-
INVESTMENT A
Pay back period: (Years before full recovery) + Unrecovered cost at the start of the year/
Cash flow during the year (Braumann, 2019).
= 2+ (175000-140000) / 60000
=2+(35000/ 60000)
=41.58%
3. Critically evaluate and assess the strategy formulated by Jessica.
The two respective strategies have been evaluated in the computations made above. It is
hence evaluated that the new strategy formulated incurs higher financial risk. The BEP of the
previous strategy of 2019 comes as 47218 and of the new strategy of 2020 comes to be 53541 in
units. The MOS in sales of the two strategies as of 2019 is -£665275 and of 2020 is -£26388550.
Both the strategies displayed very low and negative margin of safety (Zhang, Zhang and Managi,
2019). But it can be assessed looking at the numbers that the new strategy made the MOS worse
as 2019. Hence the business should think upon to apply effective growth strategies, accelerate
the organisational sales and boost the business growth through intense promotion and other
effective tools. To attain additional growth, the business has already spent an additional amount
of £1,450,000 on its fixed costs which is also a primary reason why the business is facing high
costs and losses.
Question 4
1. Compute the Pay back period, Net present value and Average rate of return for every potential
investment project of the business.
1. Payback Period-
INVESTMENT A
Pay back period: (Years before full recovery) + Unrecovered cost at the start of the year/
Cash flow during the year (Braumann, 2019).
= 2+ (175000-140000) / 60000
=2+(35000/ 60000)
=2+0.58
=2.58 years
INVESTMENT B
Pay back period: (Years before full recovery) + Unrecovered cost at the start of the year/
Cash flow during the year
=2 + (195000 – 160000) / 45000
=2+(35000 / 450000)
=2+0.77
=2.77 years
INVESTMENT C
Pay back period: (Years before full recovery) + Unrecovered cost at the start of the year/
Cash flow during the year
= 3 +(190000-1750000 / 66000
= 3+(15000 / 66000)
=3+0.22
=3.22 years
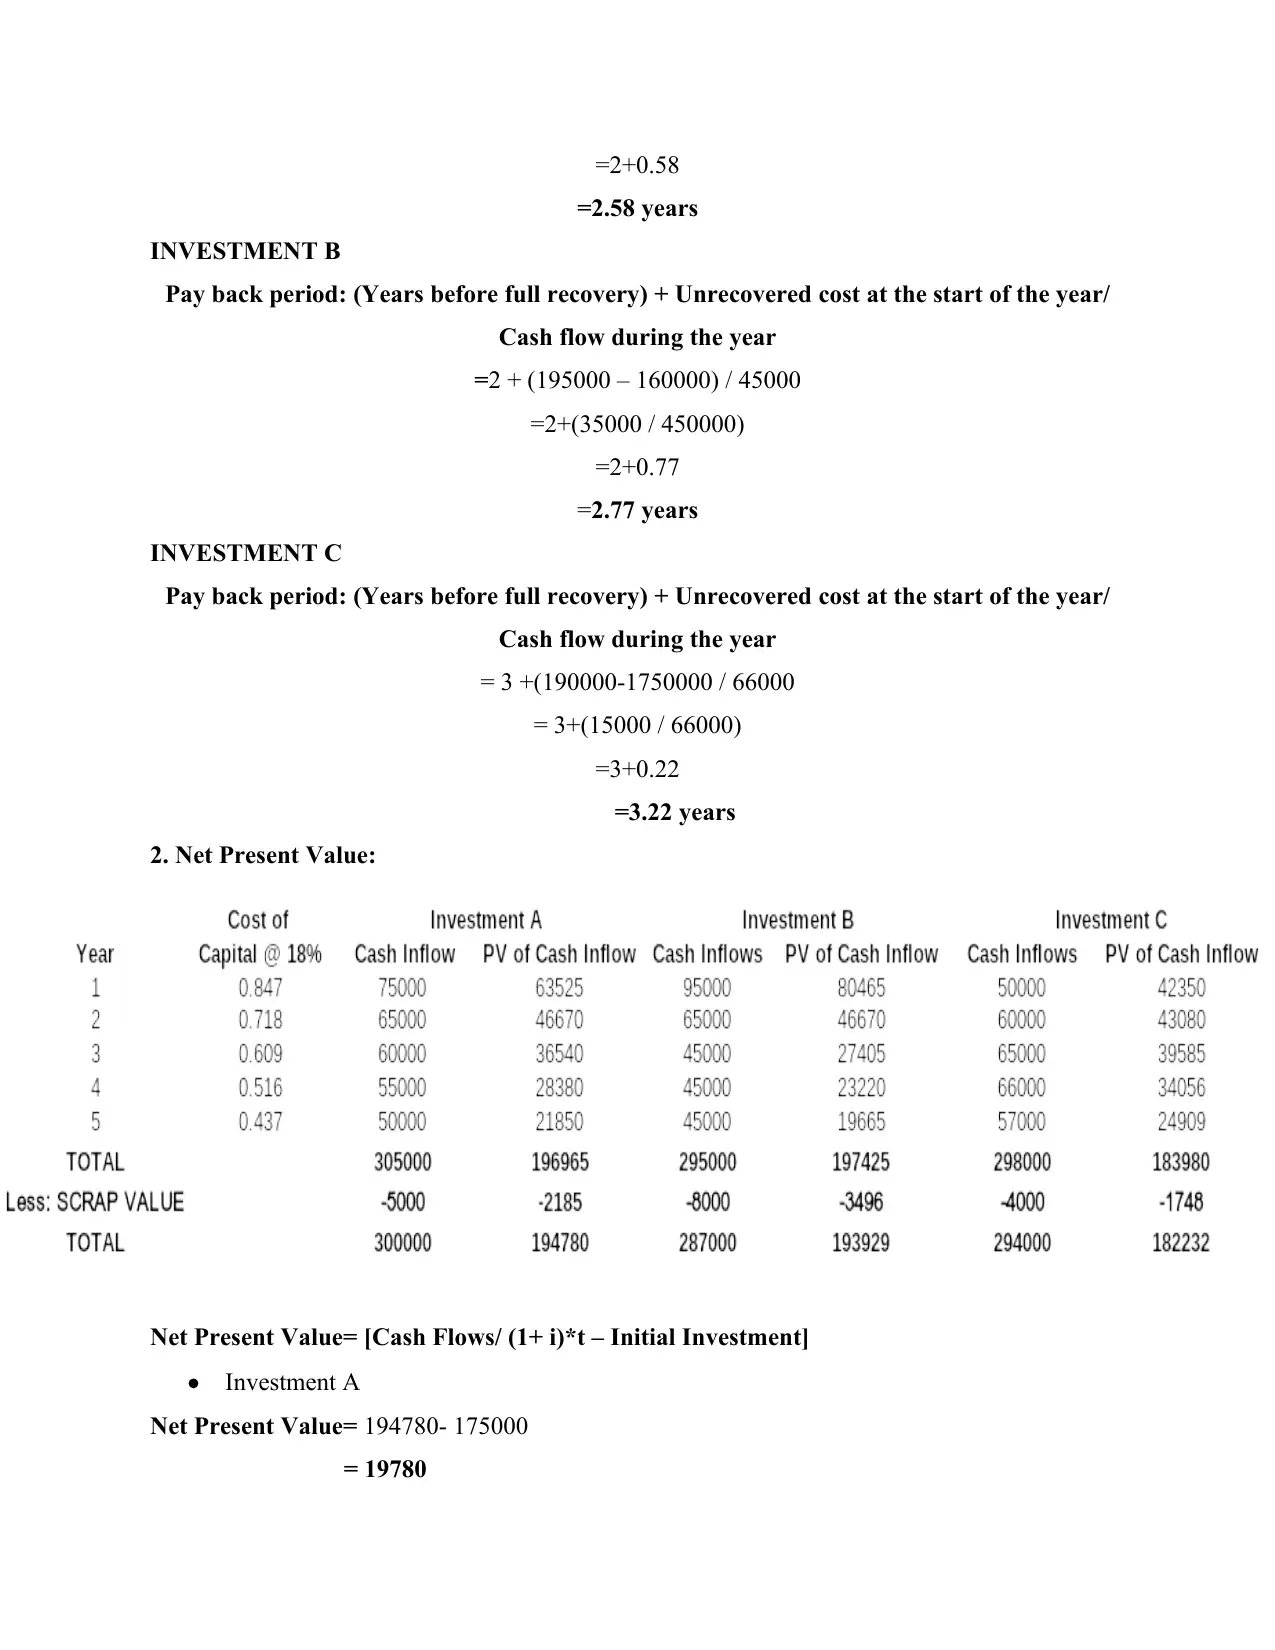
2. Net Present Value:
Net Present Value= [Cash Flows/ (1+ i)*t – Initial Investment]
Investment A
Net Present Value= 194780- 175000
= 19780
=2.58 years
INVESTMENT B
Pay back period: (Years before full recovery) + Unrecovered cost at the start of the year/
Cash flow during the year
=2 + (195000 – 160000) / 45000
=2+(35000 / 450000)
=2+0.77
=2.77 years
INVESTMENT C
Pay back period: (Years before full recovery) + Unrecovered cost at the start of the year/
Cash flow during the year
= 3 +(190000-1750000 / 66000
= 3+(15000 / 66000)
=3+0.22
=3.22 years
2. Net Present Value:
Net Present Value= [Cash Flows/ (1+ i)*t – Initial Investment]
Investment A
Net Present Value= 194780- 175000
= 19780
⊘ This is a preview!⊘
Do you want full access?
Subscribe today to unlock all pages.
Trusted by 1+ million students worldwide
1 out of 17
Related Documents


Your All-in-One AI-Powered Toolkit for Academic Success.
+13062052269
info@desklib.com
Available 24*7 on WhatsApp / Email
![[object Object]](/_next/static/media/star-bottom.7253800d.svg)
Unlock your academic potential
Copyright © 2020–2026 A2Z Services. All Rights Reserved. Developed and managed by ZUCOL.