Financial Management & Control Report: Ratio Analysis and Break-Even
VerifiedAdded on 2021/01/03
|17
|4831
|24
Report
AI Summary
This comprehensive financial management report analyzes the financial performance of Fridge-freezer Plc and Washbug Ltd. It begins with a board report evaluating profitability, liquidity, gearing, asset utilization, and investor potential ratios for Fridge-freezer Plc. The report then calculates and interprets the working capital cycle for the same company. Further, it explores the limitations of ratio analysis in both cross-sectional and time-series comparisons. The report then transitions to Task B, calculating the break-even point and margin of safety for Washbug Ltd for 2017 and 2018, followed by an evaluation of the break-even point model's assumptions. Finally, the report evaluates single sources of internal and external finance and assesses the benefits and limitations of various investment appraisal techniques. The report provides a detailed analysis of financial statements and key financial metrics, offering insights into the companies' financial health and performance.

Financial Management
& Control
& Control
Paraphrase This Document
Need a fresh take? Get an instant paraphrase of this document with our AI Paraphraser
Table of Contents
INTRODUCTION...........................................................................................................................3
PART A...........................................................................................................................................3
1. Board Report of Fridge-freezer Plc:...................................................................................3
2. Working Capital Cycle in Days for Fridge-freezer Plc:.....................................................6
3. Limitations of Using Ratio Analysis for both Cross-Sectional and Time-Series
Comparisons:..........................................................................................................................7
TASK B...........................................................................................................................................9
1. Calculation of Break-even point and Margin of safety for the year 2017 and 2018 of
Washbug Ltd..........................................................................................................................9
2. Evaluation of key assumptions of break-even point model, assessing and analysing the
model within the context of today's global business environment.......................................10
PART C .........................................................................................................................................11
1. Evaluation of single source of both internal and external finance: .................................11
2. Evaluation of benefits and limitations of different investment appraisal techniques:......13
CONCLUSION..............................................................................................................................14
REFERENCES..............................................................................................................................15
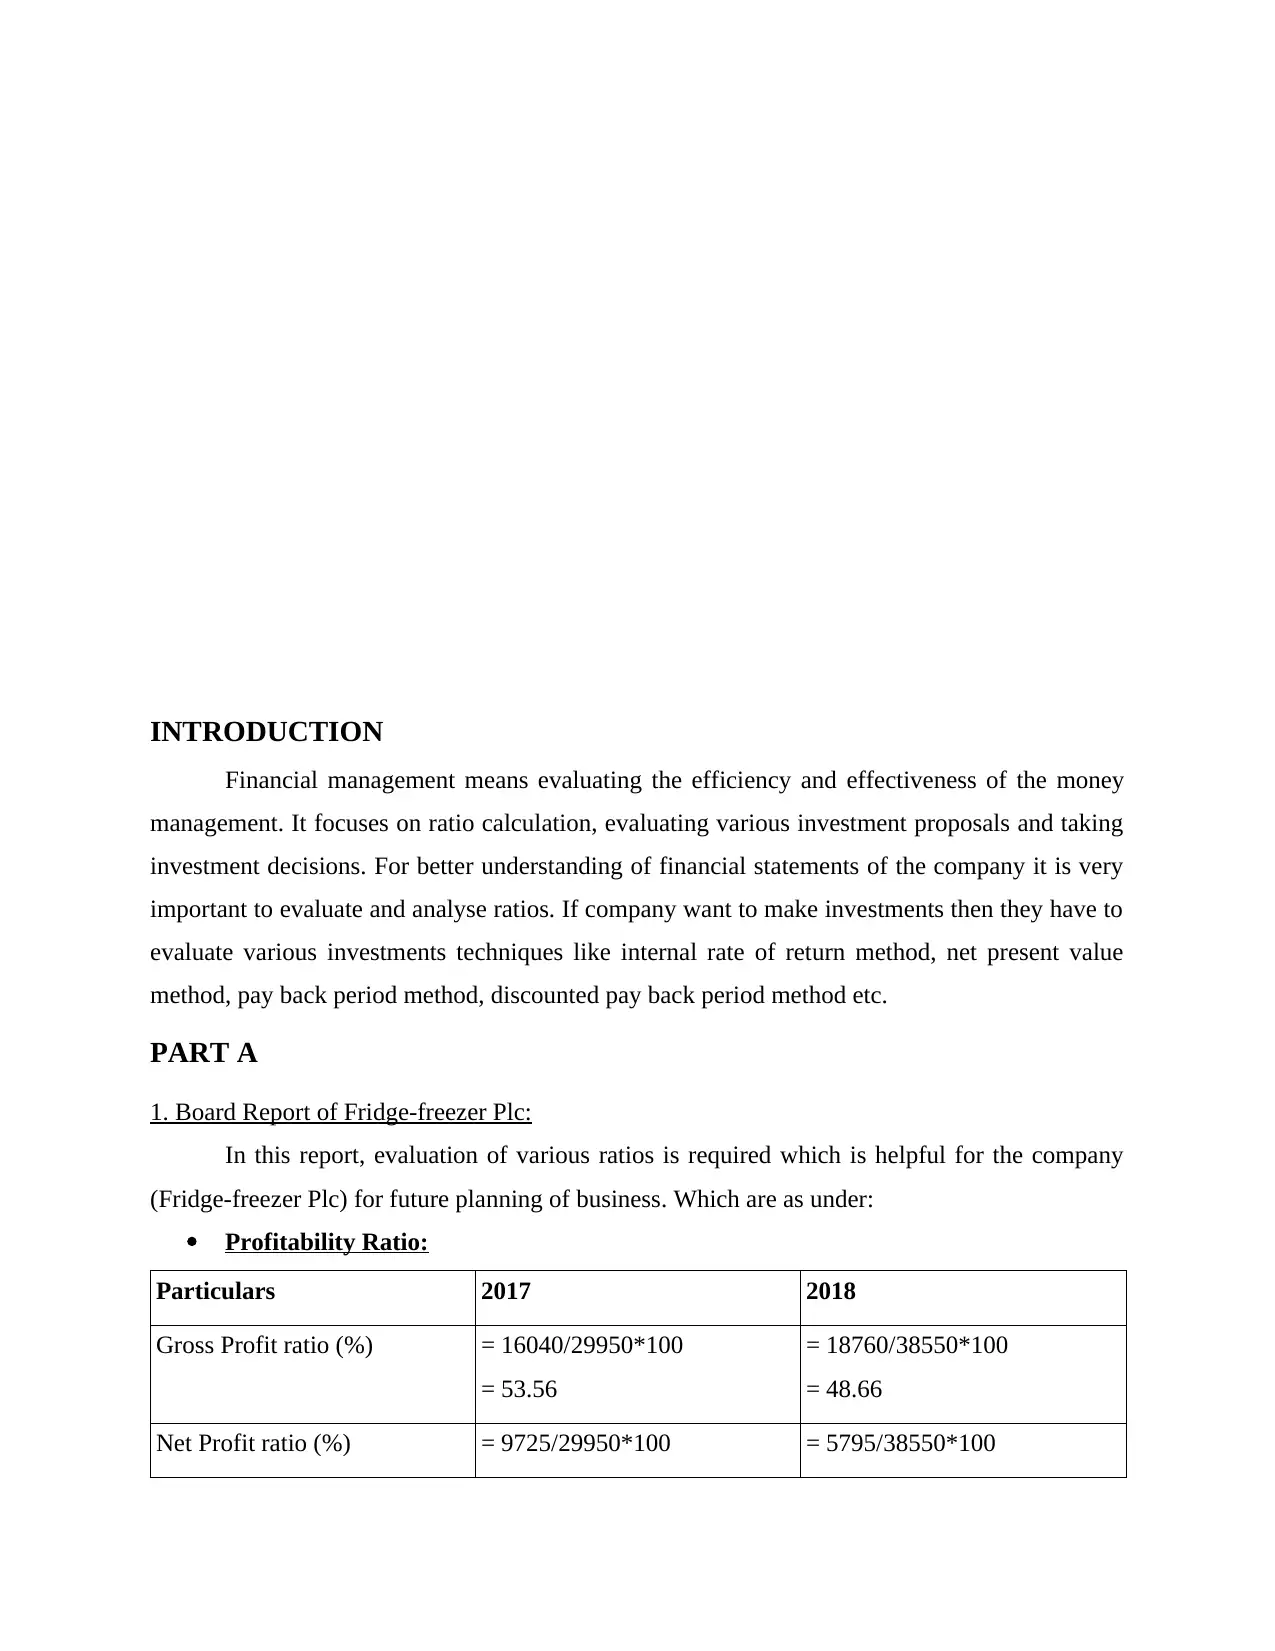
INTRODUCTION
Financial management means evaluating the efficiency and effectiveness of the money
management. It focuses on ratio calculation, evaluating various investment proposals and taking
investment decisions. For better understanding of financial statements of the company it is very
important to evaluate and analyse ratios. If company want to make investments then they have to
evaluate various investments techniques like internal rate of return method, net present value
method, pay back period method, discounted pay back period method etc.
PART A
1. Board Report of Fridge-freezer Plc:
In this report, evaluation of various ratios is required which is helpful for the company
(Fridge-freezer Plc) for future planning of business. Which are as under:
Profitability Ratio:
Particulars 2017 2018
Gross Profit ratio (%) = 16040/29950*100
= 53.56
= 18760/38550*100
= 48.66
Net Profit ratio (%) = 9725/29950*100 = 5795/38550*100
⊘ This is a preview!⊘
Do you want full access?
Subscribe today to unlock all pages.
Trusted by 1+ million students worldwide
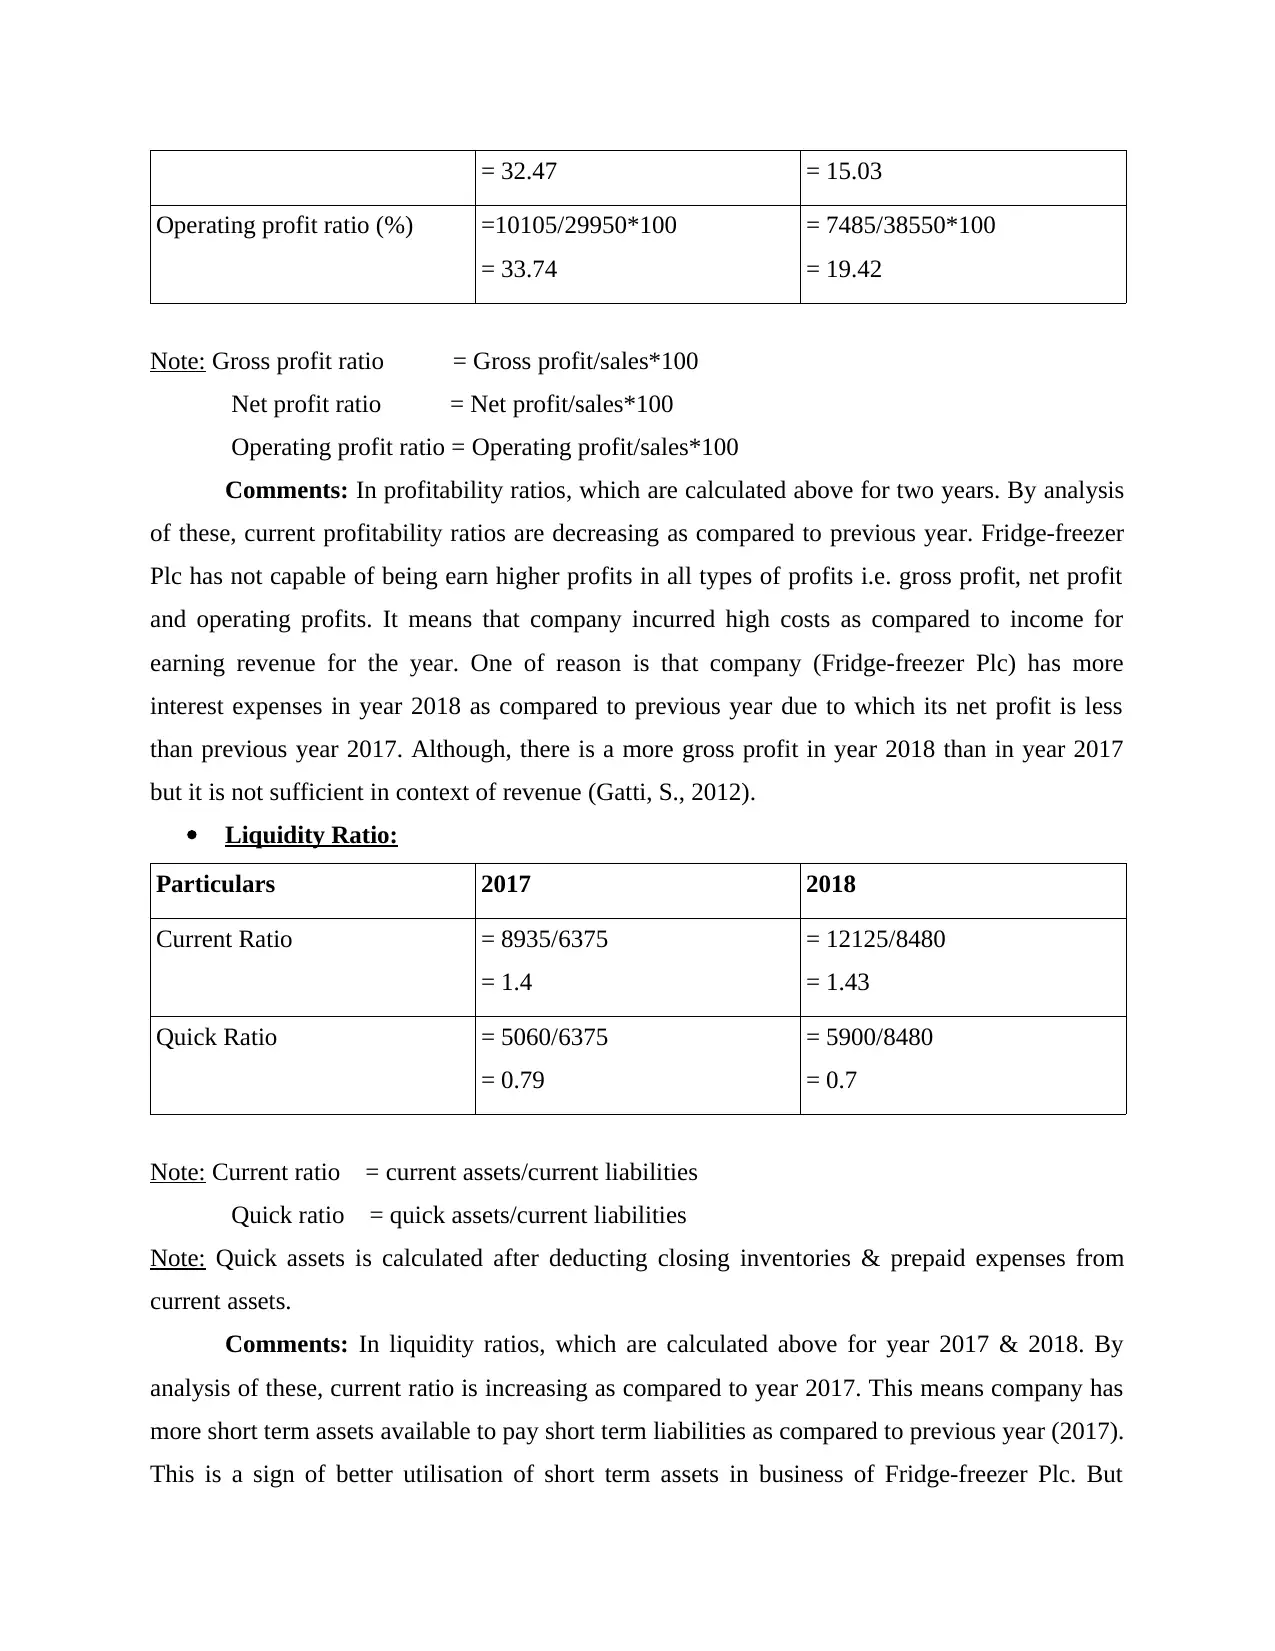
= 32.47 = 15.03
Operating profit ratio (%) =10105/29950*100
= 33.74
= 7485/38550*100
= 19.42
Note: Gross profit ratio = Gross profit/sales*100
Net profit ratio = Net profit/sales*100
Operating profit ratio = Operating profit/sales*100
Comments: In profitability ratios, which are calculated above for two years. By analysis
of these, current profitability ratios are decreasing as compared to previous year. Fridge-freezer
Plc has not capable of being earn higher profits in all types of profits i.e. gross profit, net profit
and operating profits. It means that company incurred high costs as compared to income for
earning revenue for the year. One of reason is that company (Fridge-freezer Plc) has more
interest expenses in year 2018 as compared to previous year due to which its net profit is less
than previous year 2017. Although, there is a more gross profit in year 2018 than in year 2017
but it is not sufficient in context of revenue (Gatti, S., 2012).
Liquidity Ratio:
Particulars 2017 2018
Current Ratio = 8935/6375
= 1.4
= 12125/8480
= 1.43
Quick Ratio = 5060/6375
= 0.79
= 5900/8480
= 0.7
Note: Current ratio = current assets/current liabilities
Quick ratio = quick assets/current liabilities
Note: Quick assets is calculated after deducting closing inventories & prepaid expenses from
current assets.
Comments: In liquidity ratios, which are calculated above for year 2017 & 2018. By
analysis of these, current ratio is increasing as compared to year 2017. This means company has
more short term assets available to pay short term liabilities as compared to previous year (2017).
This is a sign of better utilisation of short term assets in business of Fridge-freezer Plc. But
Paraphrase This Document
Need a fresh take? Get an instant paraphrase of this document with our AI Paraphraser
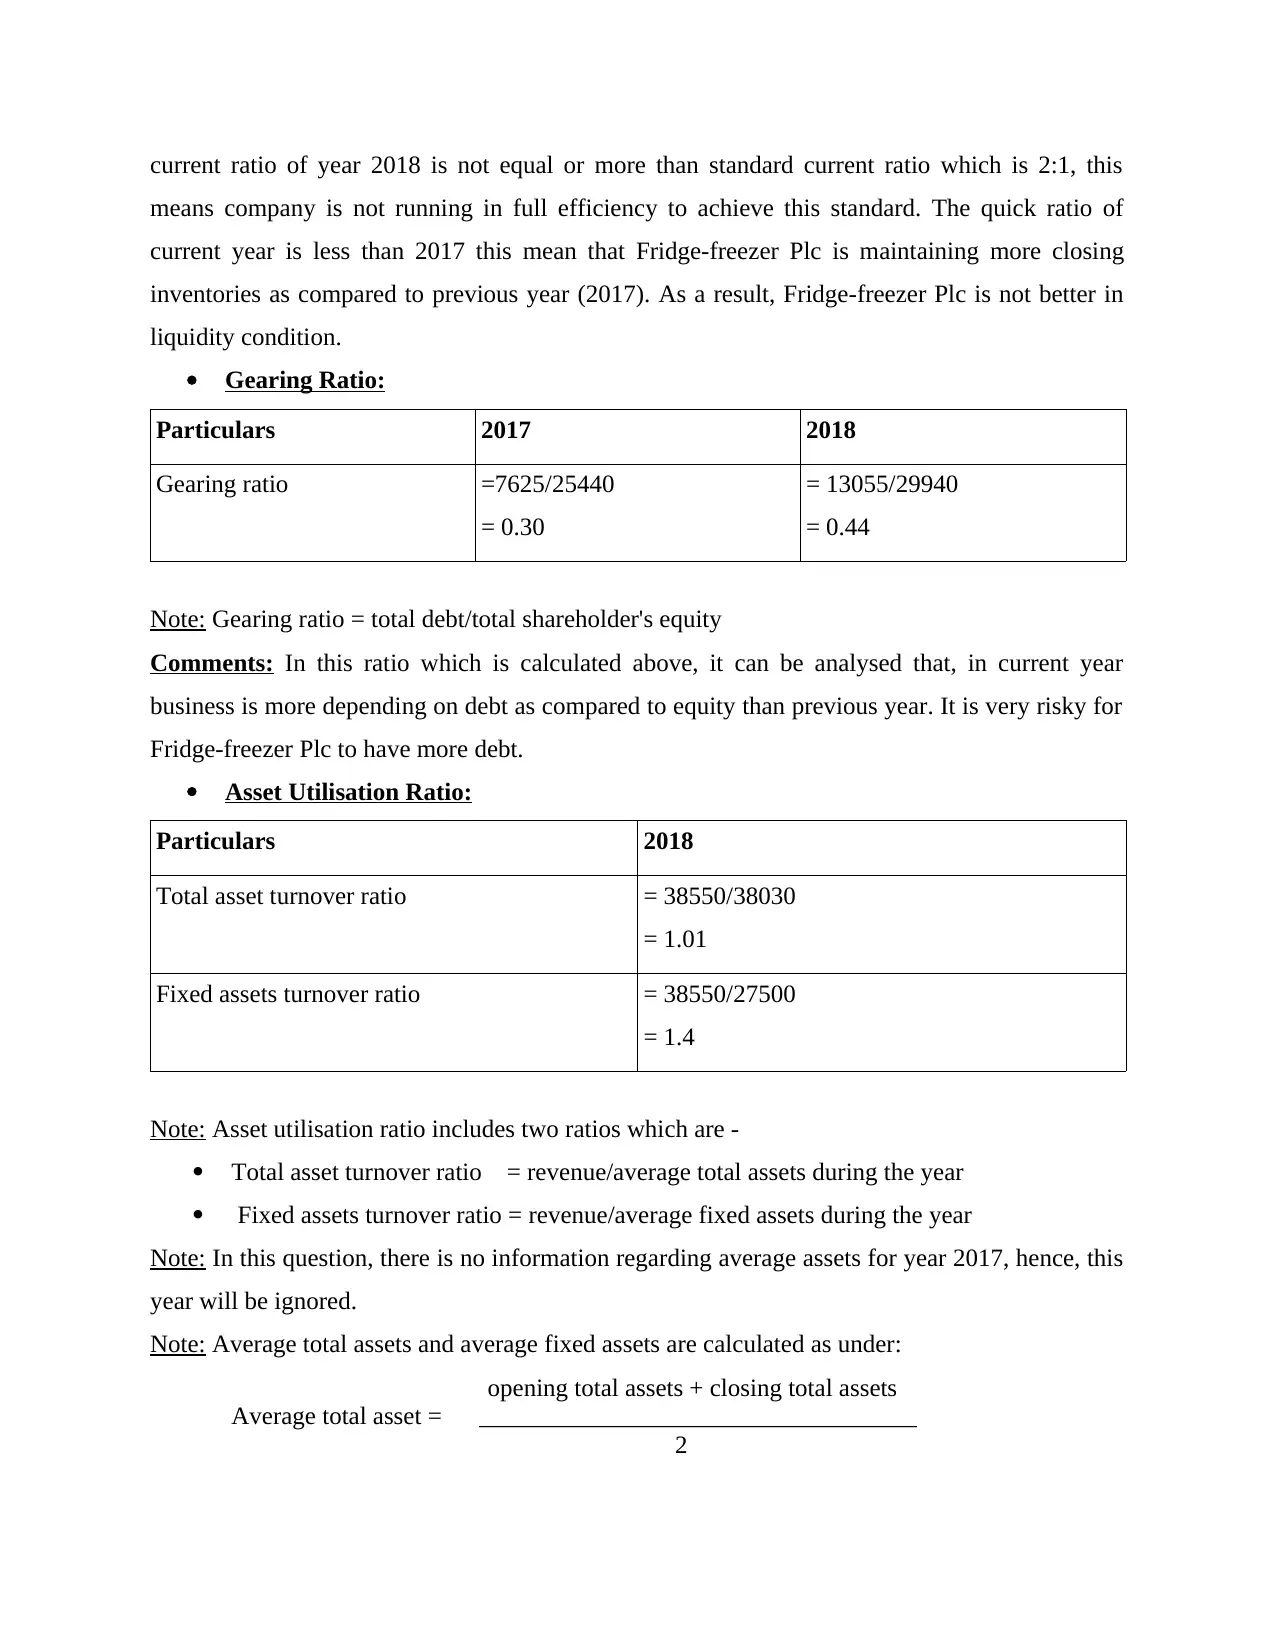
current ratio of year 2018 is not equal or more than standard current ratio which is 2:1, this
means company is not running in full efficiency to achieve this standard. The quick ratio of
current year is less than 2017 this mean that Fridge-freezer Plc is maintaining more closing
inventories as compared to previous year (2017). As a result, Fridge-freezer Plc is not better in
liquidity condition.
Gearing Ratio:
Particulars 2017 2018
Gearing ratio =7625/25440
= 0.30
= 13055/29940
= 0.44
Note: Gearing ratio = total debt/total shareholder's equity
Comments: In this ratio which is calculated above, it can be analysed that, in current year
business is more depending on debt as compared to equity than previous year. It is very risky for
Fridge-freezer Plc to have more debt.
Asset Utilisation Ratio:
Particulars 2018
Total asset turnover ratio = 38550/38030
= 1.01
Fixed assets turnover ratio = 38550/27500
= 1.4
Note: Asset utilisation ratio includes two ratios which are -
Total asset turnover ratio = revenue/average total assets during the year
Fixed assets turnover ratio = revenue/average fixed assets during the year
Note: In this question, there is no information regarding average assets for year 2017, hence, this
year will be ignored.
Note: Average total assets and average fixed assets are calculated as under:
opening total assets + closing total assets
Average total asset = ___________________________________
2
opening fixed assets + closing fixed assets
Average total asset = ___________________________________
2
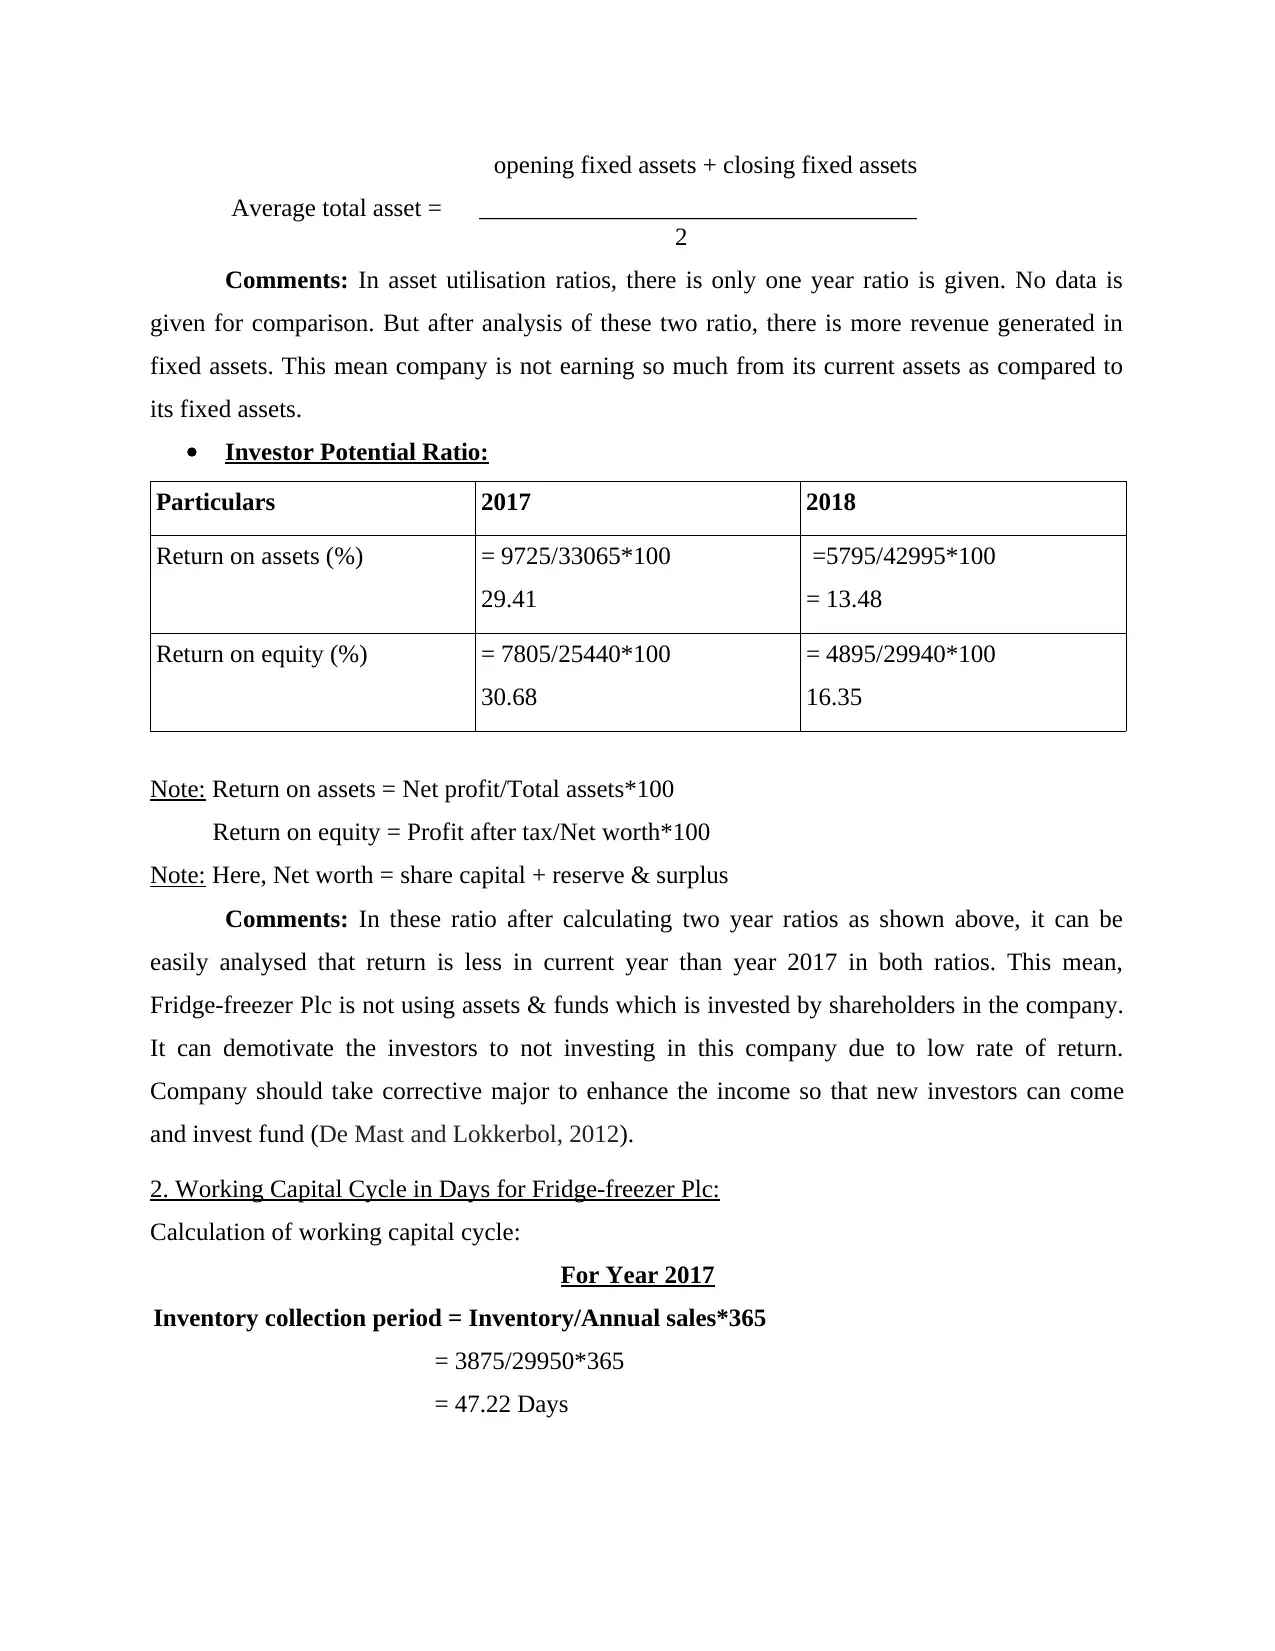
Comments: In asset utilisation ratios, there is only one year ratio is given. No data is
given for comparison. But after analysis of these two ratio, there is more revenue generated in
fixed assets. This mean company is not earning so much from its current assets as compared to
its fixed assets.
Investor Potential Ratio:
Particulars 2017 2018
Return on assets (%) = 9725/33065*100
29.41
=5795/42995*100
= 13.48
Return on equity (%) = 7805/25440*100
30.68
= 4895/29940*100
16.35
Note: Return on assets = Net profit/Total assets*100
Return on equity = Profit after tax/Net worth*100
Note: Here, Net worth = share capital + reserve & surplus
Comments: In these ratio after calculating two year ratios as shown above, it can be
easily analysed that return is less in current year than year 2017 in both ratios. This mean,
Fridge-freezer Plc is not using assets & funds which is invested by shareholders in the company.
It can demotivate the investors to not investing in this company due to low rate of return.
Company should take corrective major to enhance the income so that new investors can come
and invest fund (De Mast and Lokkerbol, 2012).
2. Working Capital Cycle in Days for Fridge-freezer Plc:
Calculation of working capital cycle:
For Year 2017
Inventory collection period = Inventory/Annual sales*365
= 3875/29950*365
= 47.22 Days
Average total asset = ___________________________________
2
Comments: In asset utilisation ratios, there is only one year ratio is given. No data is
given for comparison. But after analysis of these two ratio, there is more revenue generated in
fixed assets. This mean company is not earning so much from its current assets as compared to
its fixed assets.
Investor Potential Ratio:
Particulars 2017 2018
Return on assets (%) = 9725/33065*100
29.41
=5795/42995*100
= 13.48
Return on equity (%) = 7805/25440*100
30.68
= 4895/29940*100
16.35
Note: Return on assets = Net profit/Total assets*100
Return on equity = Profit after tax/Net worth*100
Note: Here, Net worth = share capital + reserve & surplus
Comments: In these ratio after calculating two year ratios as shown above, it can be
easily analysed that return is less in current year than year 2017 in both ratios. This mean,
Fridge-freezer Plc is not using assets & funds which is invested by shareholders in the company.
It can demotivate the investors to not investing in this company due to low rate of return.
Company should take corrective major to enhance the income so that new investors can come
and invest fund (De Mast and Lokkerbol, 2012).
2. Working Capital Cycle in Days for Fridge-freezer Plc:
Calculation of working capital cycle:
For Year 2017
Inventory collection period = Inventory/Annual sales*365
= 3875/29950*365
= 47.22 Days
⊘ This is a preview!⊘
Do you want full access?
Subscribe today to unlock all pages.
Trusted by 1+ million students worldwide
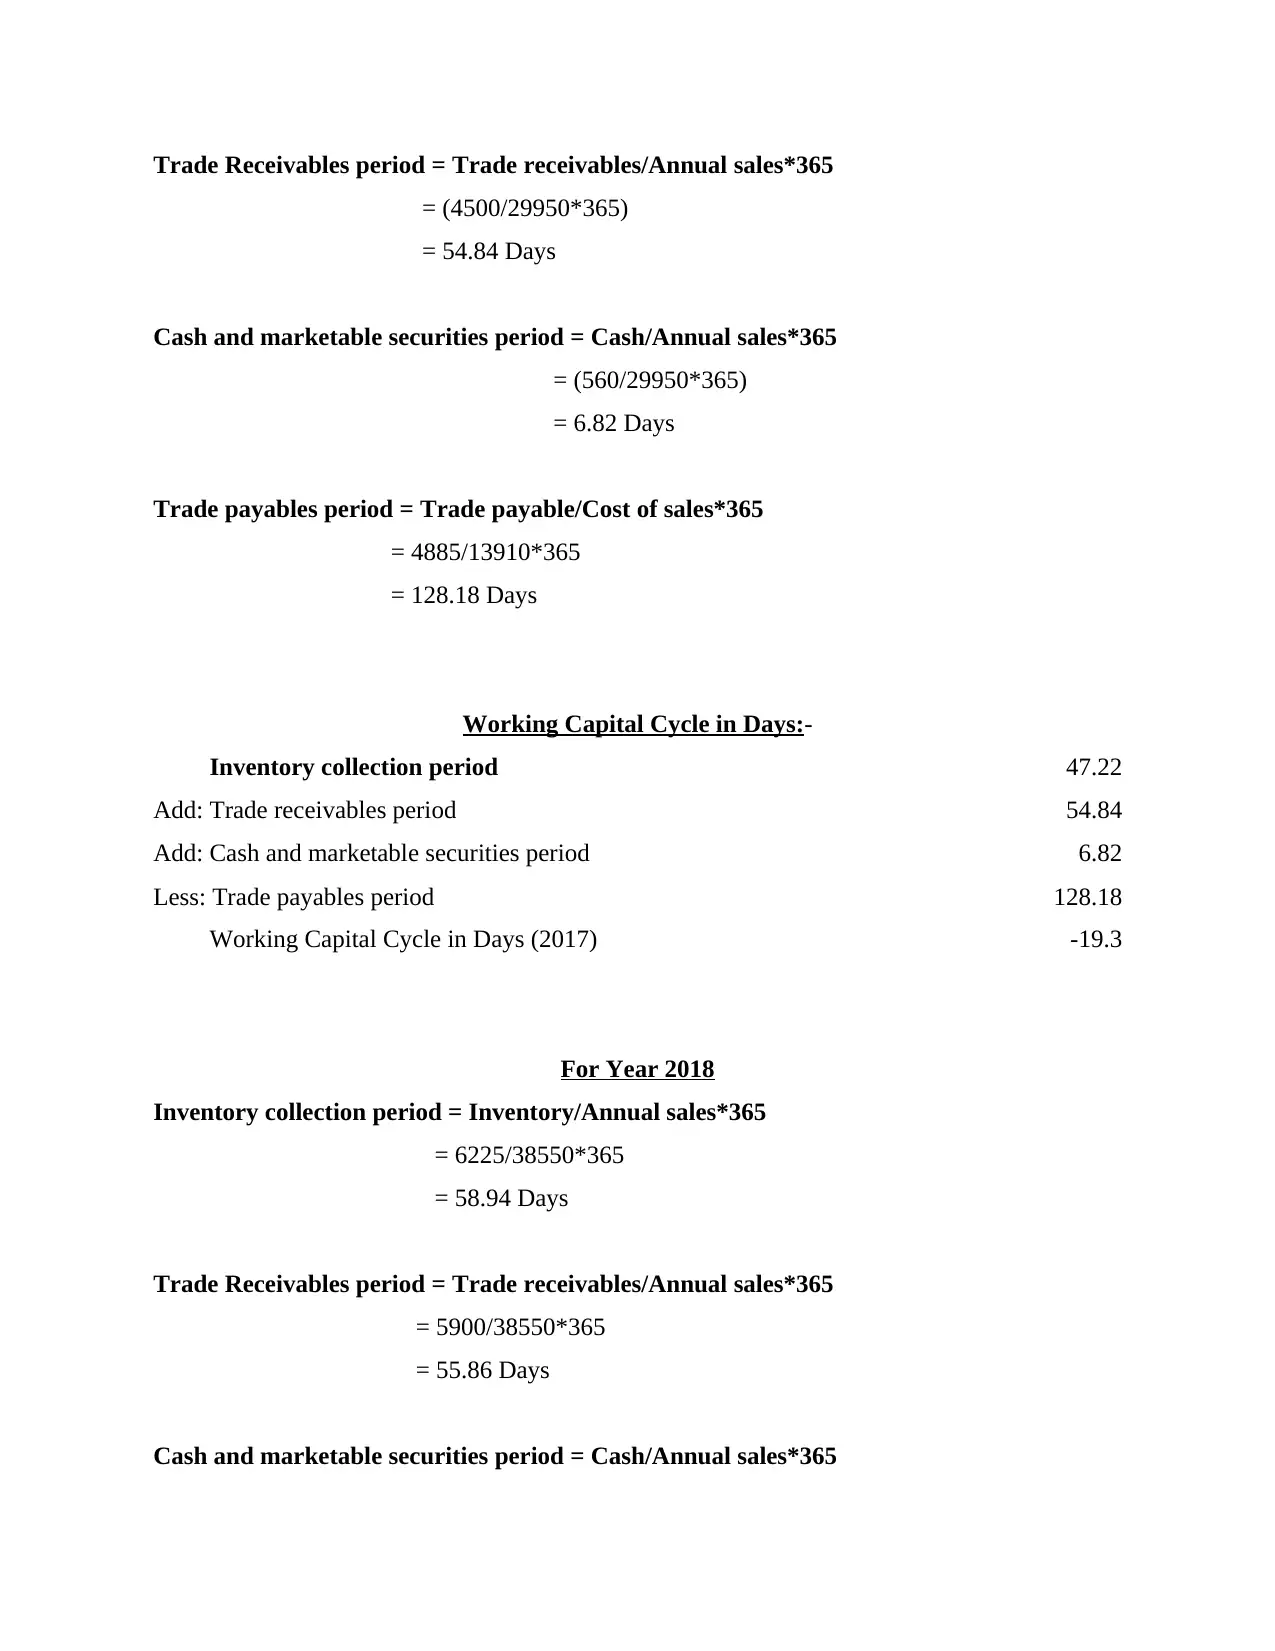
Trade Receivables period = Trade receivables/Annual sales*365
= (4500/29950*365)
= 54.84 Days
Cash and marketable securities period = Cash/Annual sales*365
= (560/29950*365)
= 6.82 Days
Trade payables period = Trade payable/Cost of sales*365
= 4885/13910*365
= 128.18 Days
Working Capital Cycle in Days:-
Inventory collection period 47.22
Add: Trade receivables period 54.84
Add: Cash and marketable securities period 6.82
Less: Trade payables period 128.18
Working Capital Cycle in Days (2017) -19.3
For Year 2018
Inventory collection period = Inventory/Annual sales*365
= 6225/38550*365
= 58.94 Days
Trade Receivables period = Trade receivables/Annual sales*365
= 5900/38550*365
= 55.86 Days
Cash and marketable securities period = Cash/Annual sales*365
Paraphrase This Document
Need a fresh take? Get an instant paraphrase of this document with our AI Paraphraser
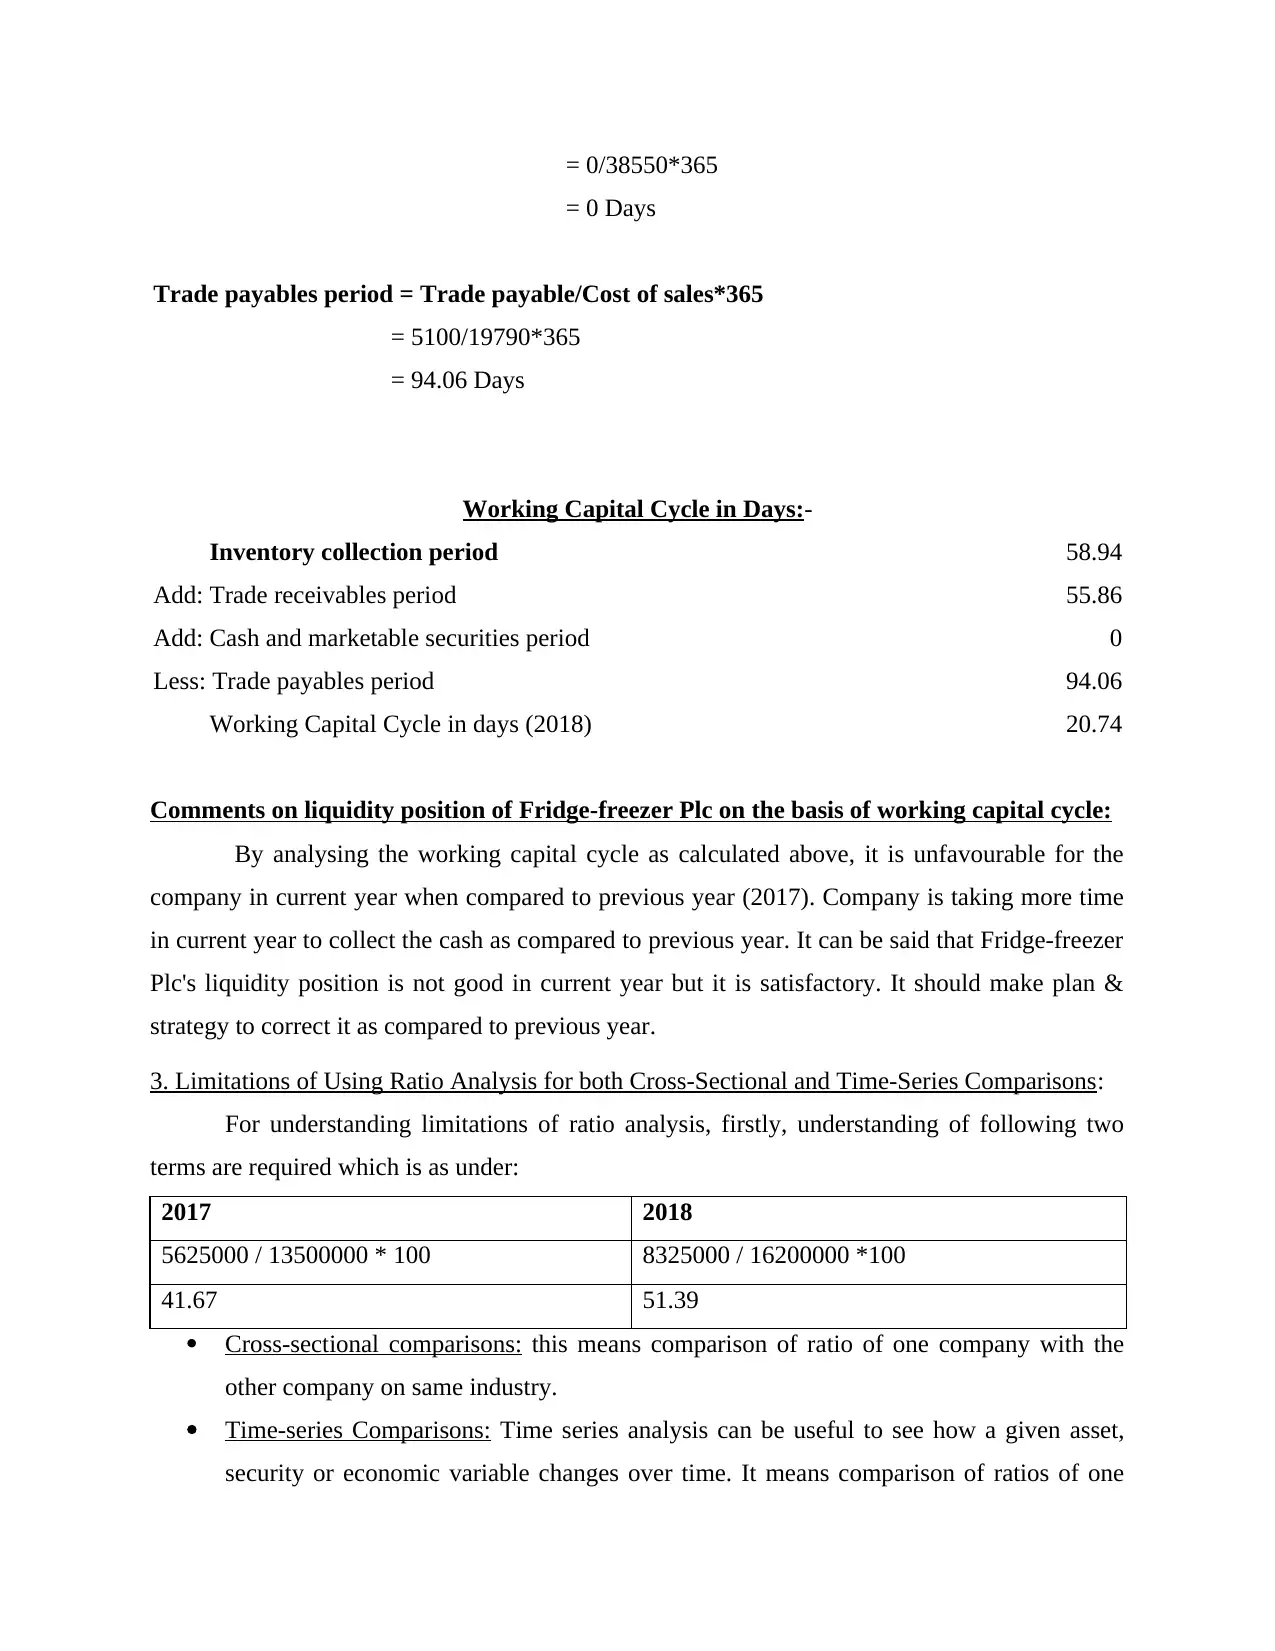
= 0/38550*365
= 0 Days
Trade payables period = Trade payable/Cost of sales*365
= 5100/19790*365
= 94.06 Days
Working Capital Cycle in Days:-
Inventory collection period 58.94
Add: Trade receivables period 55.86
Add: Cash and marketable securities period 0
Less: Trade payables period 94.06
Working Capital Cycle in days (2018) 20.74
Comments on liquidity position of Fridge-freezer Plc on the basis of working capital cycle:
By analysing the working capital cycle as calculated above, it is unfavourable for the
company in current year when compared to previous year (2017). Company is taking more time
in current year to collect the cash as compared to previous year. It can be said that Fridge-freezer
Plc's liquidity position is not good in current year but it is satisfactory. It should make plan &
strategy to correct it as compared to previous year.
3. Limitations of Using Ratio Analysis for both Cross-Sectional and Time-Series Comparisons:
For understanding limitations of ratio analysis, firstly, understanding of following two
terms are required which is as under:
2017 2018
5625000 / 13500000 * 100 8325000 / 16200000 *100
41.67 51.39
Cross-sectional comparisons: this means comparison of ratio of one company with the
other company on same industry.
Time-series Comparisons: Time series analysis can be useful to see how a given asset,
security or economic variable changes over time. It means comparison of ratios of one
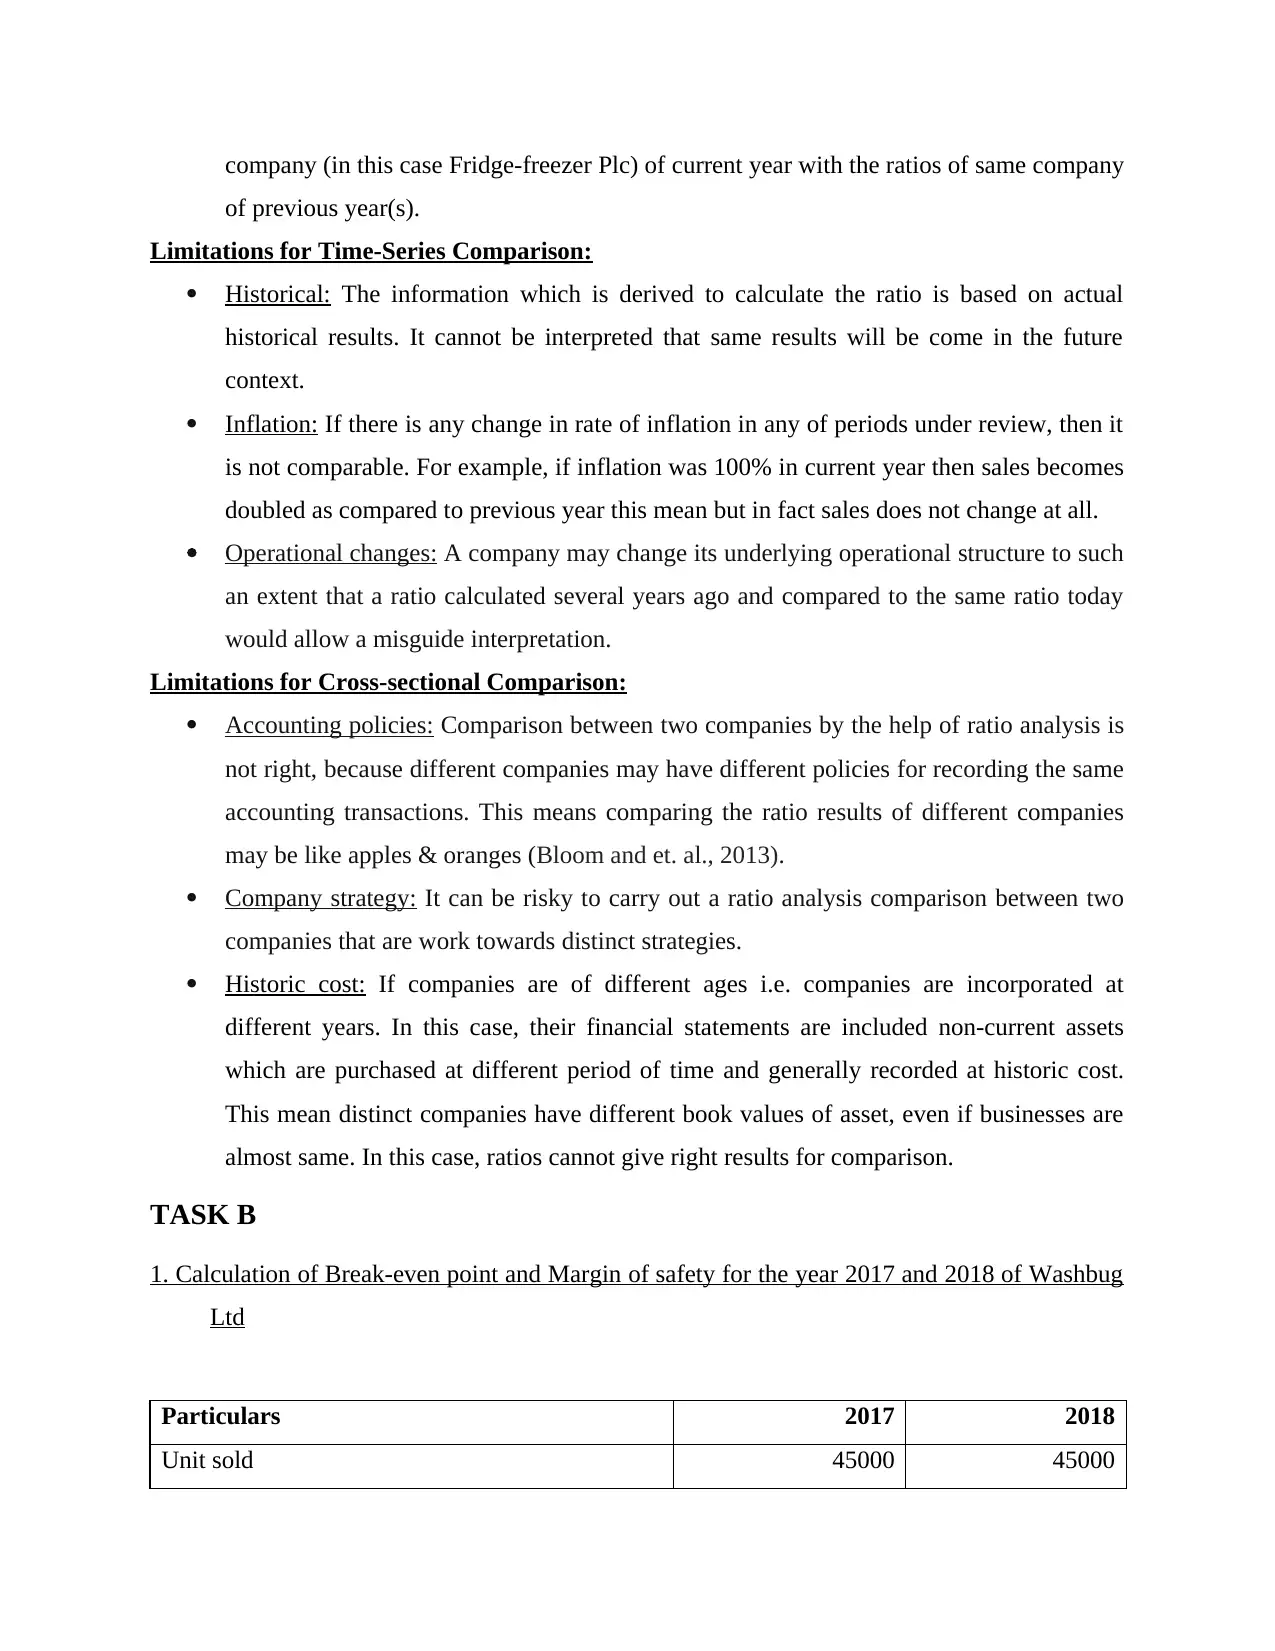
company (in this case Fridge-freezer Plc) of current year with the ratios of same company
of previous year(s).
Limitations for Time-Series Comparison:
Historical: The information which is derived to calculate the ratio is based on actual
historical results. It cannot be interpreted that same results will be come in the future
context.
Inflation: If there is any change in rate of inflation in any of periods under review, then it
is not comparable. For example, if inflation was 100% in current year then sales becomes
doubled as compared to previous year this mean but in fact sales does not change at all.
Operational changes: A company may change its underlying operational structure to such
an extent that a ratio calculated several years ago and compared to the same ratio today
would allow a misguide interpretation.
Limitations for Cross-sectional Comparison:
Accounting policies: Comparison between two companies by the help of ratio analysis is
not right, because different companies may have different policies for recording the same
accounting transactions. This means comparing the ratio results of different companies
may be like apples & oranges (Bloom and et. al., 2013).
Company strategy: It can be risky to carry out a ratio analysis comparison between two
companies that are work towards distinct strategies.
Historic cost: If companies are of different ages i.e. companies are incorporated at
different years. In this case, their financial statements are included non-current assets
which are purchased at different period of time and generally recorded at historic cost.
This mean distinct companies have different book values of asset, even if businesses are
almost same. In this case, ratios cannot give right results for comparison.
TASK B
1. Calculation of Break-even point and Margin of safety for the year 2017 and 2018 of Washbug
Ltd
Particulars 2017 2018
Unit sold 45000 45000
⊘ This is a preview!⊘
Do you want full access?
Subscribe today to unlock all pages.
Trusted by 1+ million students worldwide
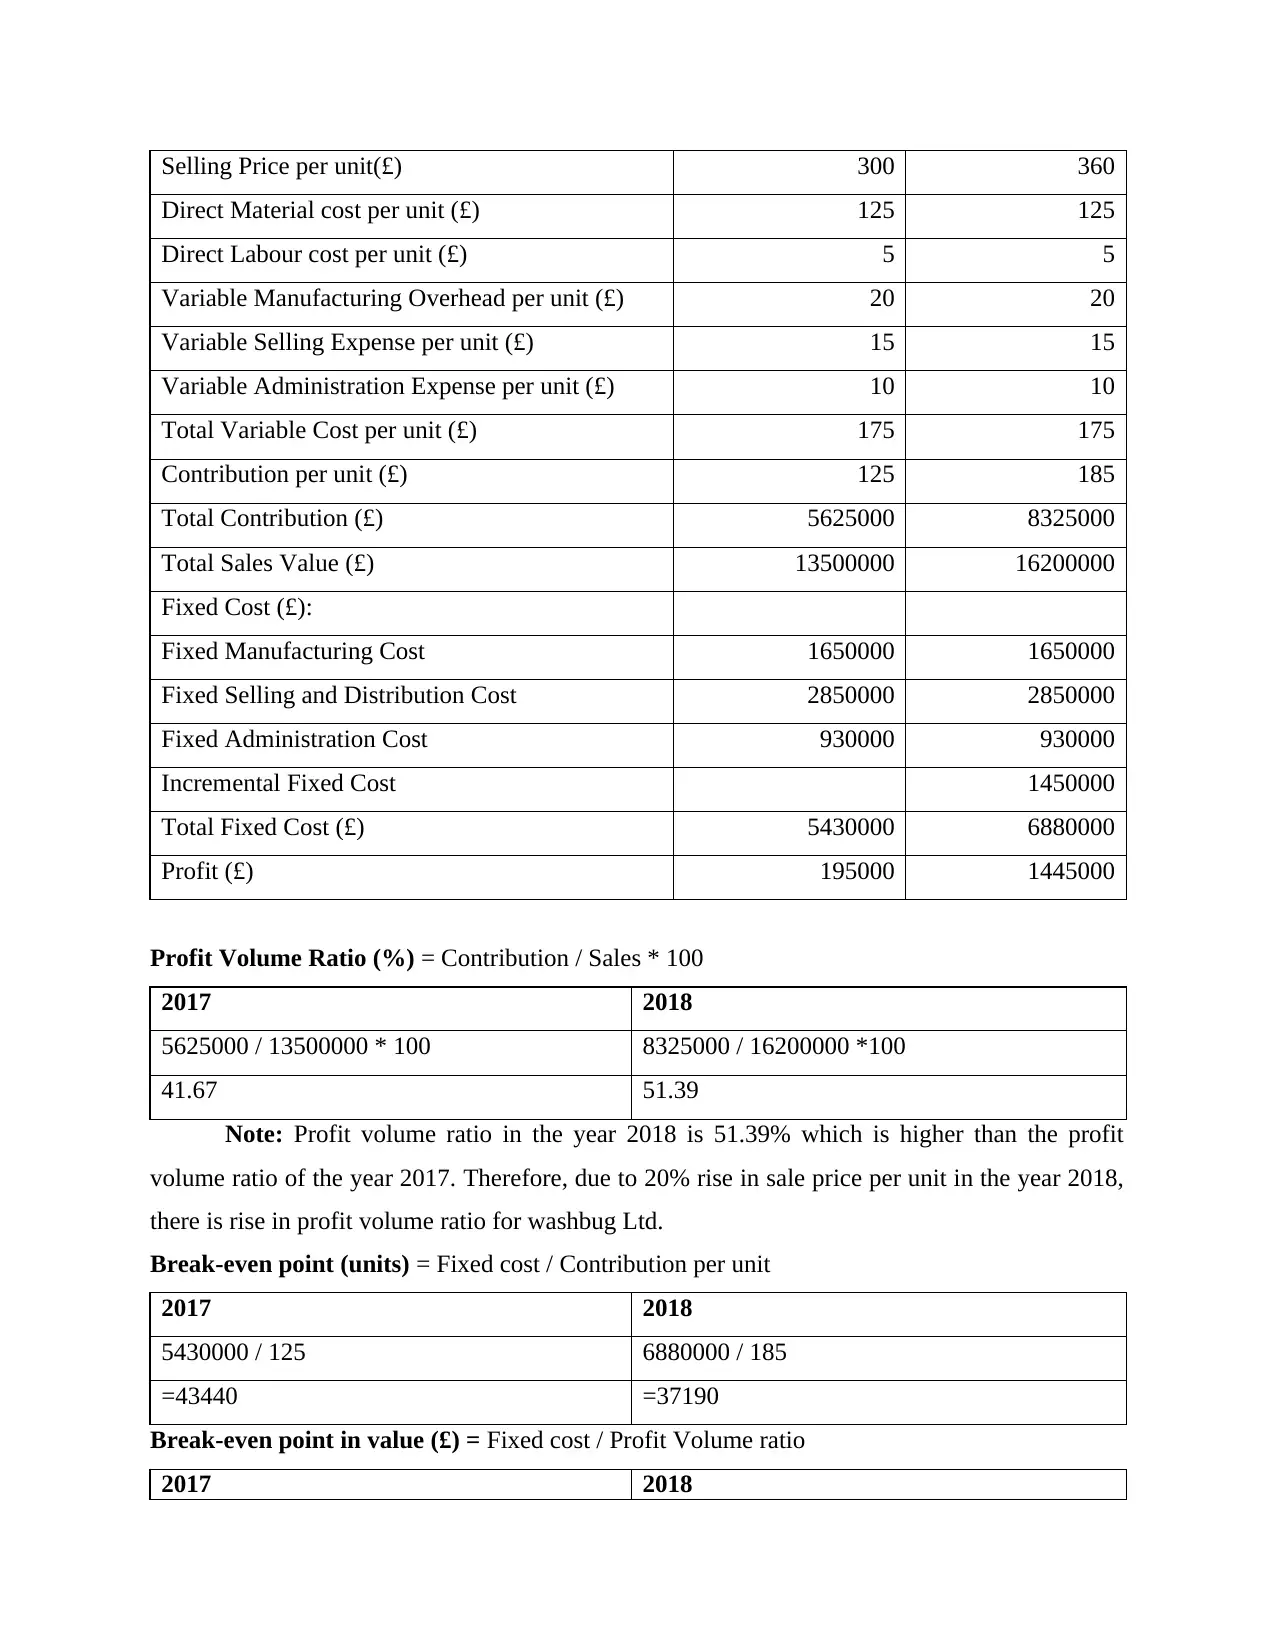
Selling Price per unit(£) 300 360
Direct Material cost per unit (£) 125 125
Direct Labour cost per unit (£) 5 5
Variable Manufacturing Overhead per unit (£) 20 20
Variable Selling Expense per unit (£) 15 15
Variable Administration Expense per unit (£) 10 10
Total Variable Cost per unit (£) 175 175
Contribution per unit (£) 125 185
Total Contribution (£) 5625000 8325000
Total Sales Value (£) 13500000 16200000
Fixed Cost (£):
Fixed Manufacturing Cost 1650000 1650000
Fixed Selling and Distribution Cost 2850000 2850000
Fixed Administration Cost 930000 930000
Incremental Fixed Cost 1450000
Total Fixed Cost (£) 5430000 6880000
Profit (£) 195000 1445000
Profit Volume Ratio (%) = Contribution / Sales * 100
2017 2018
5625000 / 13500000 * 100 8325000 / 16200000 *100
41.67 51.39
Note: Profit volume ratio in the year 2018 is 51.39% which is higher than the profit
volume ratio of the year 2017. Therefore, due to 20% rise in sale price per unit in the year 2018,
there is rise in profit volume ratio for washbug Ltd.
Break-even point (units) = Fixed cost / Contribution per unit
2017 2018
5430000 / 125 6880000 / 185
=43440 =37190
Break-even point in value (£) = Fixed cost / Profit Volume ratio
2017 2018
Paraphrase This Document
Need a fresh take? Get an instant paraphrase of this document with our AI Paraphraser
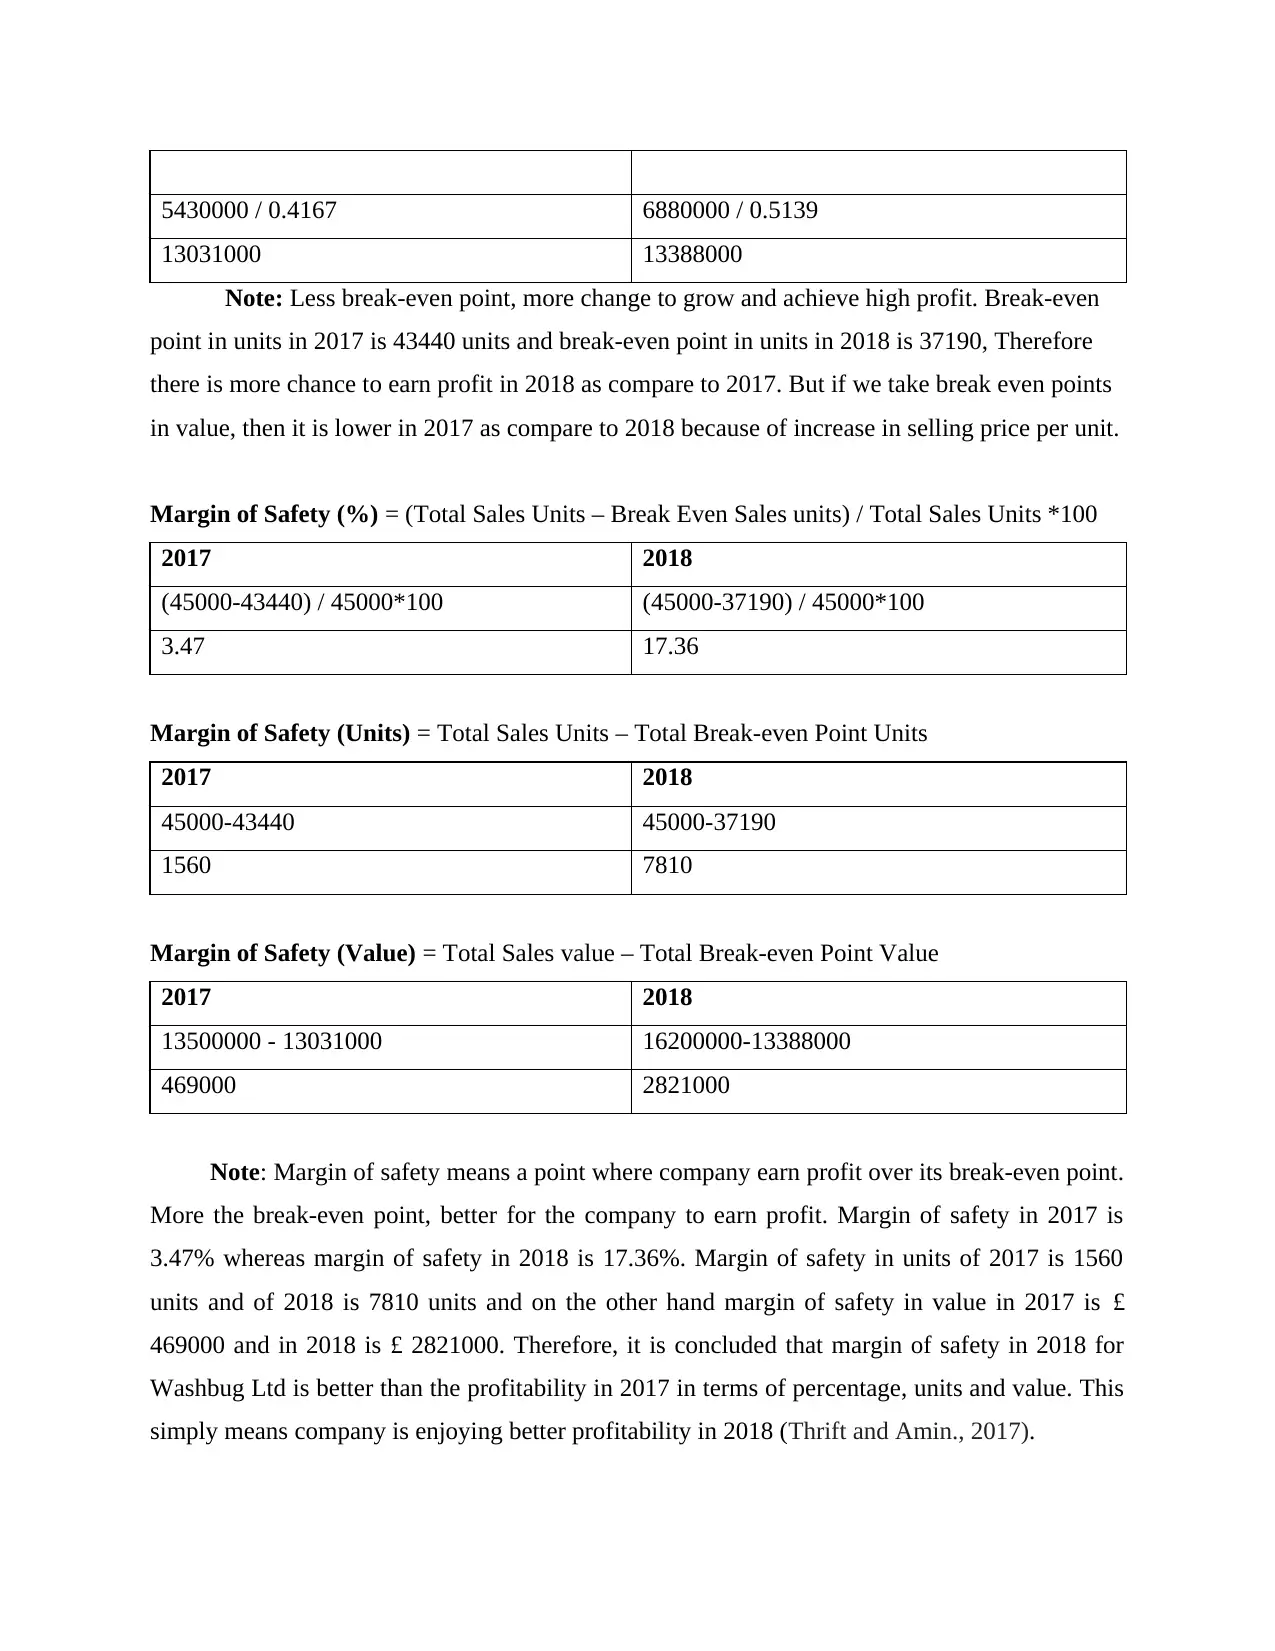
5430000 / 0.4167 6880000 / 0.5139
13031000 13388000
Note: Less break-even point, more change to grow and achieve high profit. Break-even
point in units in 2017 is 43440 units and break-even point in units in 2018 is 37190, Therefore
there is more chance to earn profit in 2018 as compare to 2017. But if we take break even points
in value, then it is lower in 2017 as compare to 2018 because of increase in selling price per unit.
Margin of Safety (%) = (Total Sales Units – Break Even Sales units) / Total Sales Units *100
2017 2018
(45000-43440) / 45000*100 (45000-37190) / 45000*100
3.47 17.36
Margin of Safety (Units) = Total Sales Units – Total Break-even Point Units
2017 2018
45000-43440 45000-37190
1560 7810
Margin of Safety (Value) = Total Sales value – Total Break-even Point Value
2017 2018
13500000 - 13031000 16200000-13388000
469000 2821000
Note: Margin of safety means a point where company earn profit over its break-even point.
More the break-even point, better for the company to earn profit. Margin of safety in 2017 is
3.47% whereas margin of safety in 2018 is 17.36%. Margin of safety in units of 2017 is 1560
units and of 2018 is 7810 units and on the other hand margin of safety in value in 2017 is £
469000 and in 2018 is £ 2821000. Therefore, it is concluded that margin of safety in 2018 for
Washbug Ltd is better than the profitability in 2017 in terms of percentage, units and value. This
simply means company is enjoying better profitability in 2018 (Thrift and Amin., 2017).
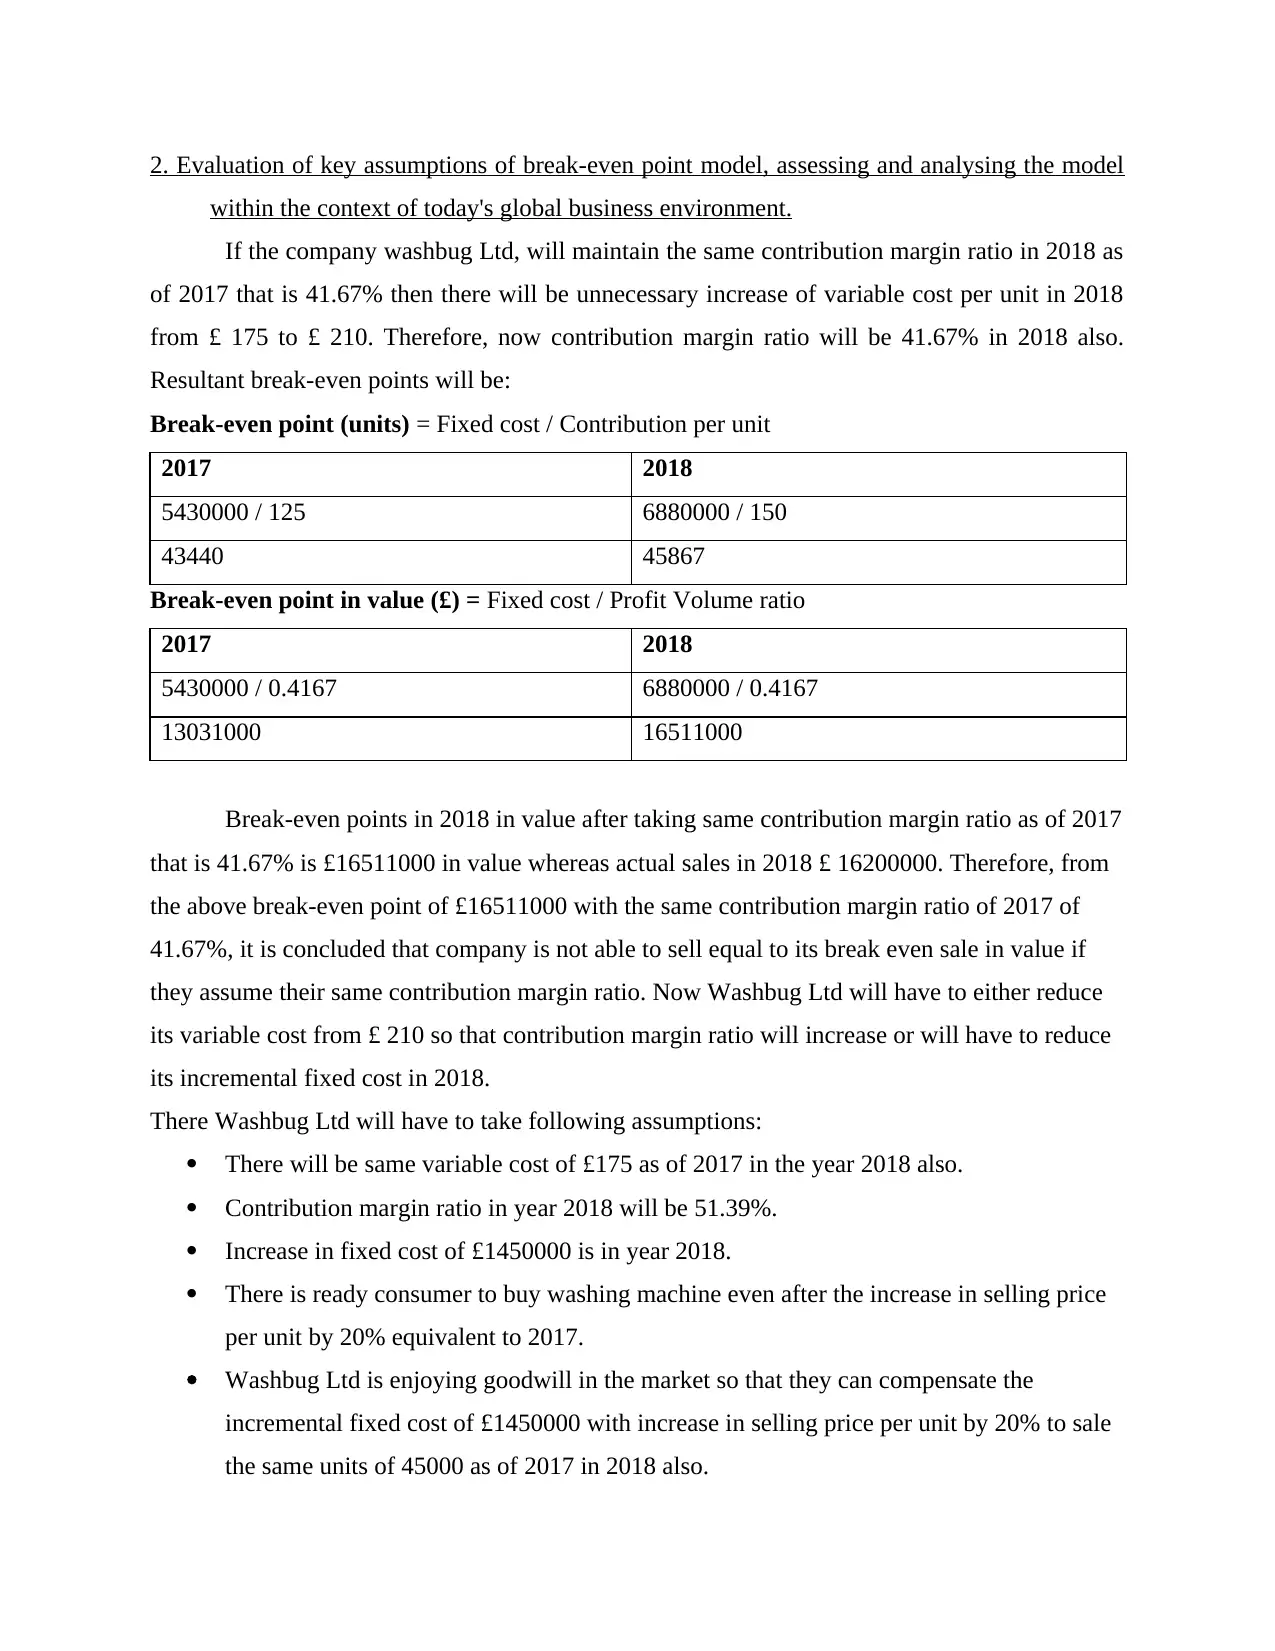
2. Evaluation of key assumptions of break-even point model, assessing and analysing the model
within the context of today's global business environment.
If the company washbug Ltd, will maintain the same contribution margin ratio in 2018 as
of 2017 that is 41.67% then there will be unnecessary increase of variable cost per unit in 2018
from £ 175 to £ 210. Therefore, now contribution margin ratio will be 41.67% in 2018 also.
Resultant break-even points will be:
Break-even point (units) = Fixed cost / Contribution per unit
2017 2018
5430000 / 125 6880000 / 150
43440 45867
Break-even point in value (£) = Fixed cost / Profit Volume ratio
2017 2018
5430000 / 0.4167 6880000 / 0.4167
13031000 16511000
Break-even points in 2018 in value after taking same contribution margin ratio as of 2017
that is 41.67% is £16511000 in value whereas actual sales in 2018 £ 16200000. Therefore, from
the above break-even point of £16511000 with the same contribution margin ratio of 2017 of
41.67%, it is concluded that company is not able to sell equal to its break even sale in value if
they assume their same contribution margin ratio. Now Washbug Ltd will have to either reduce
its variable cost from £ 210 so that contribution margin ratio will increase or will have to reduce
its incremental fixed cost in 2018.
There Washbug Ltd will have to take following assumptions:
There will be same variable cost of £175 as of 2017 in the year 2018 also.
Contribution margin ratio in year 2018 will be 51.39%.
Increase in fixed cost of £1450000 is in year 2018.
There is ready consumer to buy washing machine even after the increase in selling price
per unit by 20% equivalent to 2017.
Washbug Ltd is enjoying goodwill in the market so that they can compensate the
incremental fixed cost of £1450000 with increase in selling price per unit by 20% to sale
the same units of 45000 as of 2017 in 2018 also.
⊘ This is a preview!⊘
Do you want full access?
Subscribe today to unlock all pages.
Trusted by 1+ million students worldwide
1 out of 17
Related Documents


Your All-in-One AI-Powered Toolkit for Academic Success.
+13062052269
info@desklib.com
Available 24*7 on WhatsApp / Email
![[object Object]](/_next/static/media/star-bottom.7253800d.svg)
Unlock your academic potential
Copyright © 2020–2026 A2Z Services. All Rights Reserved. Developed and managed by ZUCOL.