Comprehensive Financial Performance Analysis of JB Hi-Fi Company
VerifiedAdded on 2019/12/28
|8
|1475
|235
Report
AI Summary
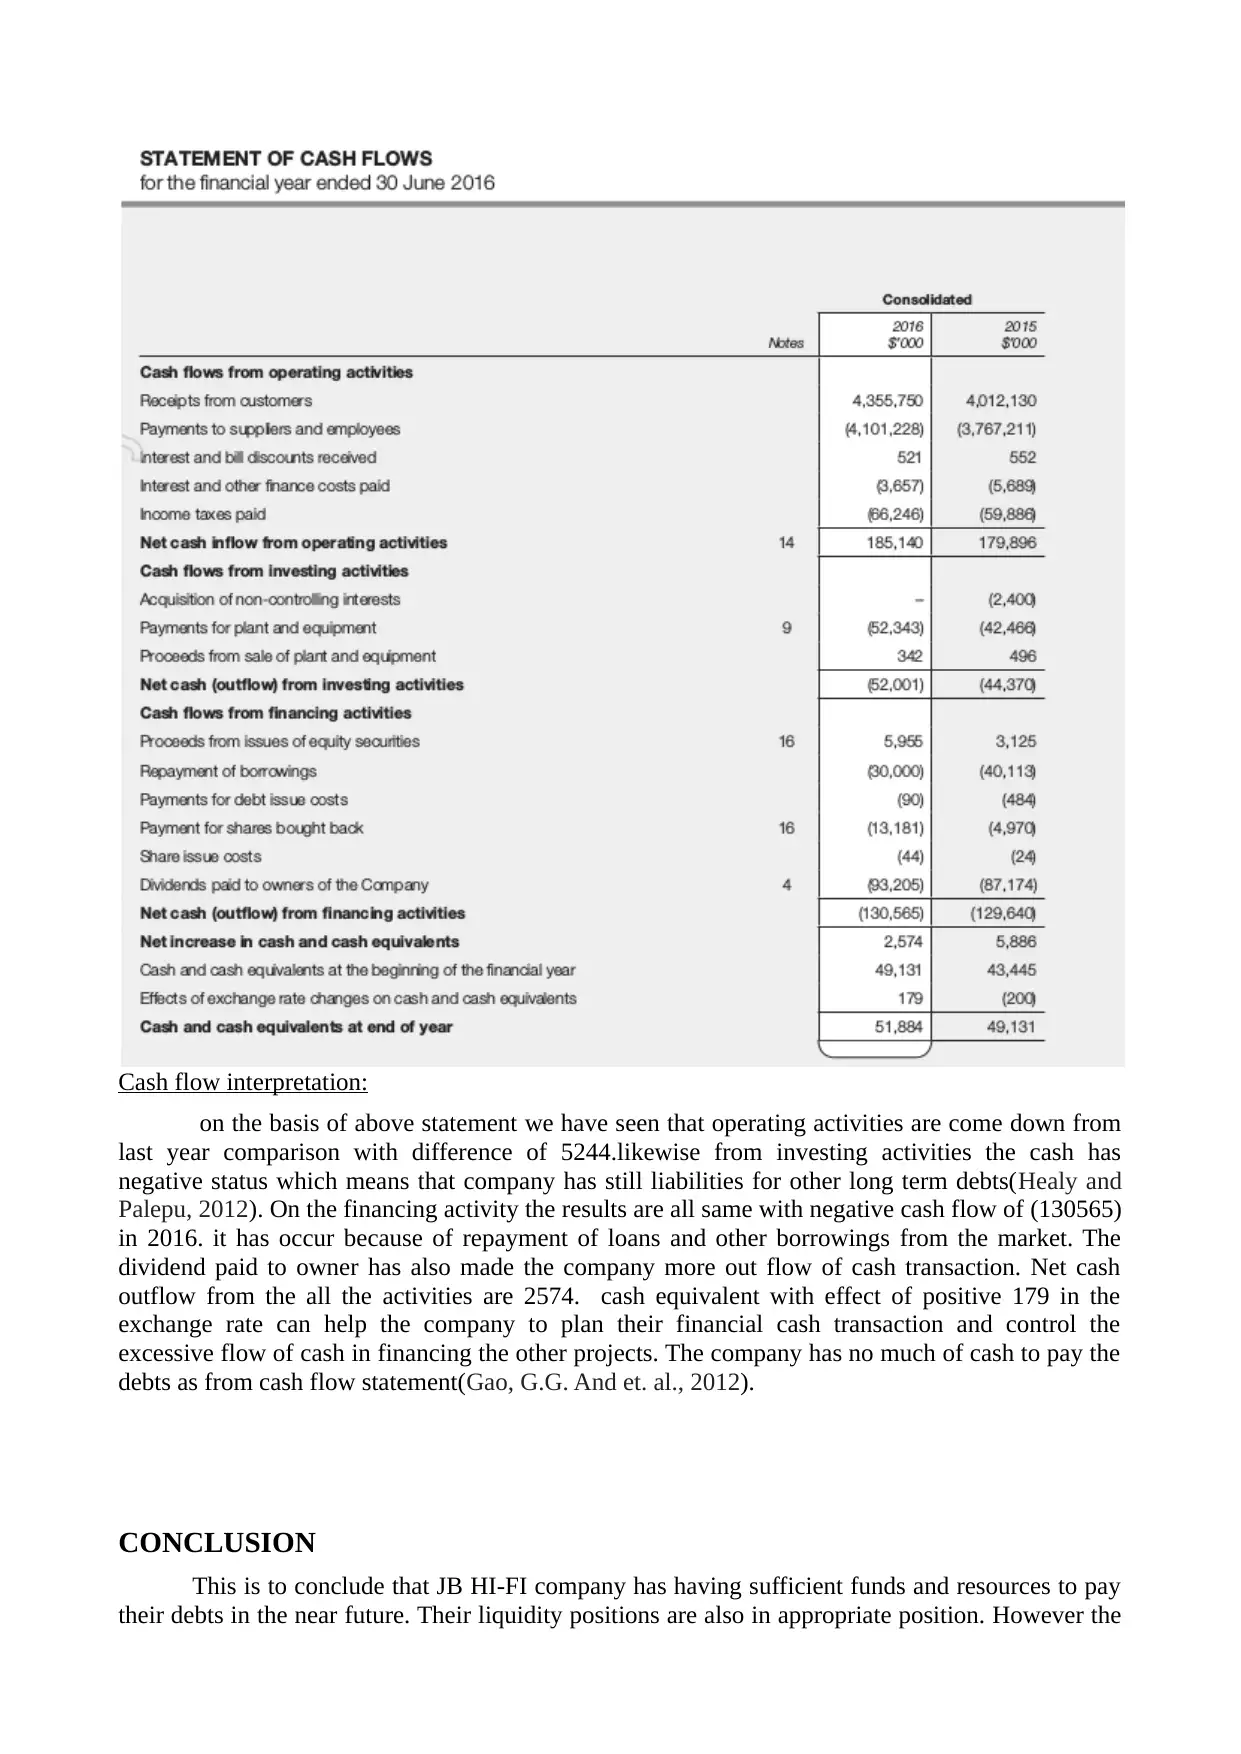
This report presents a financial analysis of JB Hi-Fi, examining its performance through various financial ratios and cash flow statements. The analysis includes profitability ratios (gross profit margin, net profit ratio, return on income, return on shareholders’ fund, and return on total assets), efficiency ratios (inventory turnover, debtors turnover, total asset turnover, current asset turnover, and creditors turnover), liquidity ratios (current ratio, liquid ratio, and working capital ratio), and gearing ratios. The report calculates these ratios for 2015 and 2016, providing insights into the company's efficiency, liquidity, and financial risk. The cash flow interpretation reveals operating, investing, and financing activities, highlighting trends and potential areas of concern. The conclusion suggests that JB Hi-Fi has sufficient funds to meet its debts, with recommendations to improve profitability and market share. The report is supported by references to relevant financial literature.

Company Analysed Report
Paraphrase This Document
Need a fresh take? Get an instant paraphrase of this document with our AI Paraphraser

Table of Contents
Summary..........................................................................................................................................3
Introduction......................................................................................................................................3
Company and industry background.................................................................................................3
Analysis of financial report data......................................................................................................3
Cash flow interpretation:.................................................................................................................6
CONCLUSION....................................................................................................................................6
REFERENCES.....................................................................................................................................8

Summary
The project objective is to now the performance of the company from the financial
statements and whether they are able to meet their future debts. The task is based on ratio analysis
and financial capability of the company performance. The assignment is all began with company
background to assist investors to know about business utility(Delport, W. and et. al., 2010.). By
taking various accounting ratios the company structural report is design which contain
profitability,operating,liquidity position and gearing ratio of the company. It contain various
segment related to financial and non financial. The project consist of annual report by taking help
we have made various calculation and efficiency of operation like liquidity and profitability of the
company in coming future .
By taking help from various financial statement from the report various analysis and
explanation has been done. On the basis of calculation and of various ratios and cash flow statement
we have made certain recommendation and suggestion to the company . It help them to increases
performance in future.
Introduction
There is need to have the proper analysis for every company so that the investors could take the
proper investment decisions. In the given scenario, JB HI-FI company is recognised for the
diversity of business and attain competitive advantages which is mainly attained from the various
range of skills and experience. The analysis of financial reports due to the the various stakeholders
so that they could take the investment decisions.
Company and industry background
JB HI-FI is acknowledges the importance of social accountability to company's consumers,
shareholders, stakeholders. Because, it is most renowned name in Australia and New Zealand's
retailer chain. This project report contain the financial information of JB Hi-Fi which is a huge
retailer of consumer products in Australia and New Zealand(Riley, R.D., Lambert and Abo-Zaid,
2010). They are good enough in video games Blu-rays DVDs and CDs or other home appliances.
Analysis of financial report data
The analysis is an important task for taking decisions in the firm. As this is the procedure for
assessing company's financial statements for getting effective decisions for the firm. Under the
given scenario, there are various ratios have been calculated for the analysing the financial data.
Profitability ratio:
Each firm is striving for the profits and profitability ratio is one of the tool which is mainly
implemented to identify the firm's bottom line and its return to its investors. Here, profitability ratio
consists gross profits margin, net profit ratio.
Gross profit ratio: gross profits/ sales
2016 2015
864508/3954467*100= 21.88% 798253/3652136*100=21,86%
Net profit ratio: net profit/sales*100
152181/3954467*100= 3.85% 136511/3652136*100=3.74%
⊘ This is a preview!⊘
Do you want full access?
Subscribe today to unlock all pages.

Trusted by 1+ million students worldwide

Profitability ratio based on capital:
Return on income: profit before interest 195532/343481*100=57% and taxes,
capitals/ capital employed
217839/40470*100= 54% 56521+17636+269332
Return on shareholders’ fund:
Net profits available to equity shareholders fund/equity
shareholders fund 136511/343489/100=39.74%
152181/404702*100=37.67%
Return on total assets:
Net profit after tax/total assets 136511/895013*100=15.25%
152181/992381*100=15.35%
capital employed is computed as 49264+27140+328298 capital employed :
=404702
56521+17636+269332=343489
Efficiency ratio:
This ratio shows the the company's efficiency. Efficiency ratio is used to assess about how the
company’s uses it assets and liabilities(Zikmund and et. al., 2013). It is used to know and assess the
performance of investment banks. Under the given situation, the efficiency ratio is assessed via
various ratios, such as, inventory turnover ratio, debtors turnover ratio, total assets turnover ratio,
current turnover ratio, etc.
Inventory turnover ratio:
Cost of goods sold/ average inventory
3089059/512654=6.03 times 3652136/478871=7.62 times
Here, opening stock is not
Average inventory: Opening stock + closing stock/2 given hence, closing stock is
478,871+546437/2= 512654 presumed as an average stock
Debtors turnover ratio: sales/average debtors 3652136/81480= 44.82 times
3954467/89776.5=44 times here, the opening balance of
The debtors not given hence,
Closing debtors balance is
presumed as the average
debtors.
Average debtors
98073/81480/2=89776
Total asset turnover:
Cost of goods sold/total assets
3089059/992381=3.11 times 2853883/895013=3.19 times
Current asset turnover:
Cost of goods sold/current assets 2853883/616901=4.62 times
3089057/702518= 4.40 times
Paraphrase This Document
Need a fresh take? Get an instant paraphrase of this document with our AI Paraphraser

Creditors turnover:
Cost of good sold/average sales
3089059/895013=870 times
Liquidity ratio:
This defines the ability of the firm to repay its financial obligation when they becomes due. The
liquidity ratio is used to assess the company's ability to meet out the short term debts(Delport and
et. al., 2010.). Here, under the cited case, the company's current ratio is 1.57 which represents
company's is ma
Current ratio:
Current assets/ current liabilities 616901/380336=1.62
702518/446833= 1.57:1
Liquid Ratio:
Liquid assets/ current liablities
156081/446833= 0.349:1 138030/380336=0.36361
Working capital ratio:
Cost of goods sold/ net maintainable working cost
3089057/255685= 12 times 2853883/236565= 12 times
Gearing ratio:
Non current liabilities / share capital+ reserves+
Retained earnings-non current liabilities
140846/404702-140846*100= 53.38% 171198/(343479-171198*100=
99.37%
Gearing ratio shows the financial risk of the company. It is a financial ratio which compares
owner’s equity to borrowed funds. Investors use gearing ratio for knowing how well a firm survive
an economic downturn. In 2016, the gearing ratio of the JB HI-FI company is 53.38%. which means
borrowed capital represents over the equity funds. While in 2015, the gearing ratio is 99.37%.

Cash flow interpretation:
on the basis of above statement we have seen that operating activities are come down from
last year comparison with difference of 5244.likewise from investing activities the cash has
negative status which means that company has still liabilities for other long term debts(Healy and
Palepu, 2012). On the financing activity the results are all same with negative cash flow of (130565)
in 2016. it has occur because of repayment of loans and other borrowings from the market. The
dividend paid to owner has also made the company more out flow of cash transaction. Net cash
outflow from the all the activities are 2574. cash equivalent with effect of positive 179 in the
exchange rate can help the company to plan their financial cash transaction and control the
excessive flow of cash in financing the other projects. The company has no much of cash to pay the
debts as from cash flow statement(Gao, G.G. And et. al., 2012).
CONCLUSION
This is to conclude that JB HI-FI company has having sufficient funds and resources to pay
their debts in the near future. Their liquidity positions are also in appropriate position. However the
⊘ This is a preview!⊘
Do you want full access?
Subscribe today to unlock all pages.

Trusted by 1+ million students worldwide

assignment is being offer wide range of information about performance, stability and growth
potential of JB HI-FI. On the current year basis with the capability of company major
recommendation is given to increase profitability and market share. There are various positive
issues are find out from this assignment like company have enough cash flow to invest in other
activity of the company for expansion.
Paraphrase This Document
Need a fresh take? Get an instant paraphrase of this document with our AI Paraphraser

REFERENCES
Books and Journals
Healy, P.M. and Palepu, K.G., 2012.Business analysis valuation: Using financial statements.
Cengage Learning.
Zikmund, W.G., Babin, B.J., Carr, J.C. and Griffin, M., 2013. Business research methods. Cengage
Learning.
Riley, R.D., Lambert, P.C. and Abo-Zaid, G., 2010. Meta-analysis of individual participant data:
rationale, conduct, and reporting. Bmj. 340. p.c221.
Delport, W., Poon, A.F., Frost, S.D. and Pond, S.L.K., 2010. Datamonkey 2010: a suite of
phylogenetic analysis tools for evolutionary biology. Bioinformatics, 26(19). pp.2455-
2457.
Gao, G.G., McCullough, J.S., Agarwal, R. and Jha, A.K., 2012. A changing landscape of physician
quality reporting: analysis of patients’ online ratings of their physicians over a 5-year
period. Journal of medical Internet research.14(1).
Adamson, P. and et. Al., 2011. Improved search for muon-neutrino to electron-neutrino oscillations
in MINOS. Physical Review Letters. 107(18). p.181802.
1 out of 8
Related Documents

Your All-in-One AI-Powered Toolkit for Academic Success.
+13062052269
info@desklib.com
Available 24*7 on WhatsApp / Email
Unlock your academic potential
© 2024 | Zucol Services PVT LTD | All rights reserved.