Kaplan FIN103 Assignment 3: JBH Company Valuation and Recommendation
VerifiedAdded on 2021/04/21
|22
|5891
|82
Report
AI Summary
This assignment, focusing on Financial Analysis and Valuation (FIN103), requires an evaluation of JB Hi-Fi's (JBH) financial performance. The analysis encompasses the quality of JBH's earnings, considering trends over five years, significant items in FY17, and the nature of its earnings base. It also involves calculating and assessing the effective tax rate and financial gearing profitability ratio. Furthermore, the assignment requires the calculation and analysis of market performance ratios to make an investment recommendation. The report must adhere to a 2,000-word limit, referencing external sources and following Harvard referencing style. The analysis utilizes JBH's 2017 Annual Report and considers specific financial data and assumptions provided in the assignment brief, including share capital movements and sector benchmarks. The overall goal is to assess JBH's financial health and provide insights for potential investment decisions.
Financial Analysis and Valuation
(FIN103)
Assignment 3: Company valuation and
investment recommendations
Total marks: 50
Personal ID: [Enter your Personal ID]
I have read the Assignment Guide in the ‘General assessment information’ and have applied the
word count principles to my work.
My word count for this assignment is: [Enter your word count] words
Your assignment should be loaded into KapLearn by 11.30 pm on the due date.
All times are based on AEDT/AEST time zones.
Refer to ‘Time remaining’ on the ‘Assignment’ page in KapLearn to ensure you submit
your assignment by the specified due date and time.
Checklist
I have completed my assignment using Word.
I have completed my assignment using Calibri, Arial, Times New Roman or Verdana fonts.
I have added my Personal ID on this page.
I have added my word count on this page.
I have added my Personal ID in front of the filename in the footer on the second page.
I have saved the file to be uploaded as PersonalID_FIN103_AS3_v2.
Each question of my assignment is within the word limit guidelines for that question as per the
‘General assessment information’ (Assessment Assignment General Assessment information).
My assignment file size is no larger than 2 MB.
If tables were required, they are visible as text, not as links or images.
I have not removed the marking grid from the footer.
I have submitted my assignment as per the instructions in KapLearn.
Paraphrase This Document
Need a fresh take? Get an instant paraphrase of this document with our AI Paraphraser
Marker feedback
Comment on overall performance:
For marker use only.
For office use only
# 1 2 3 4 5 Total
Max 12 12 7 9 10
**
Expressi
on is
faulty
**
Awarded x x x x x
**
Expressi
on is
faulty
**
Comment on overall performance:
For marker use only.
For office use only
# 1 2 3 4 5 Total
Max 12 12 7 9 10
**
Expressi
on is
faulty
**
Awarded x x x x x
**
Expressi
on is
faulty
**
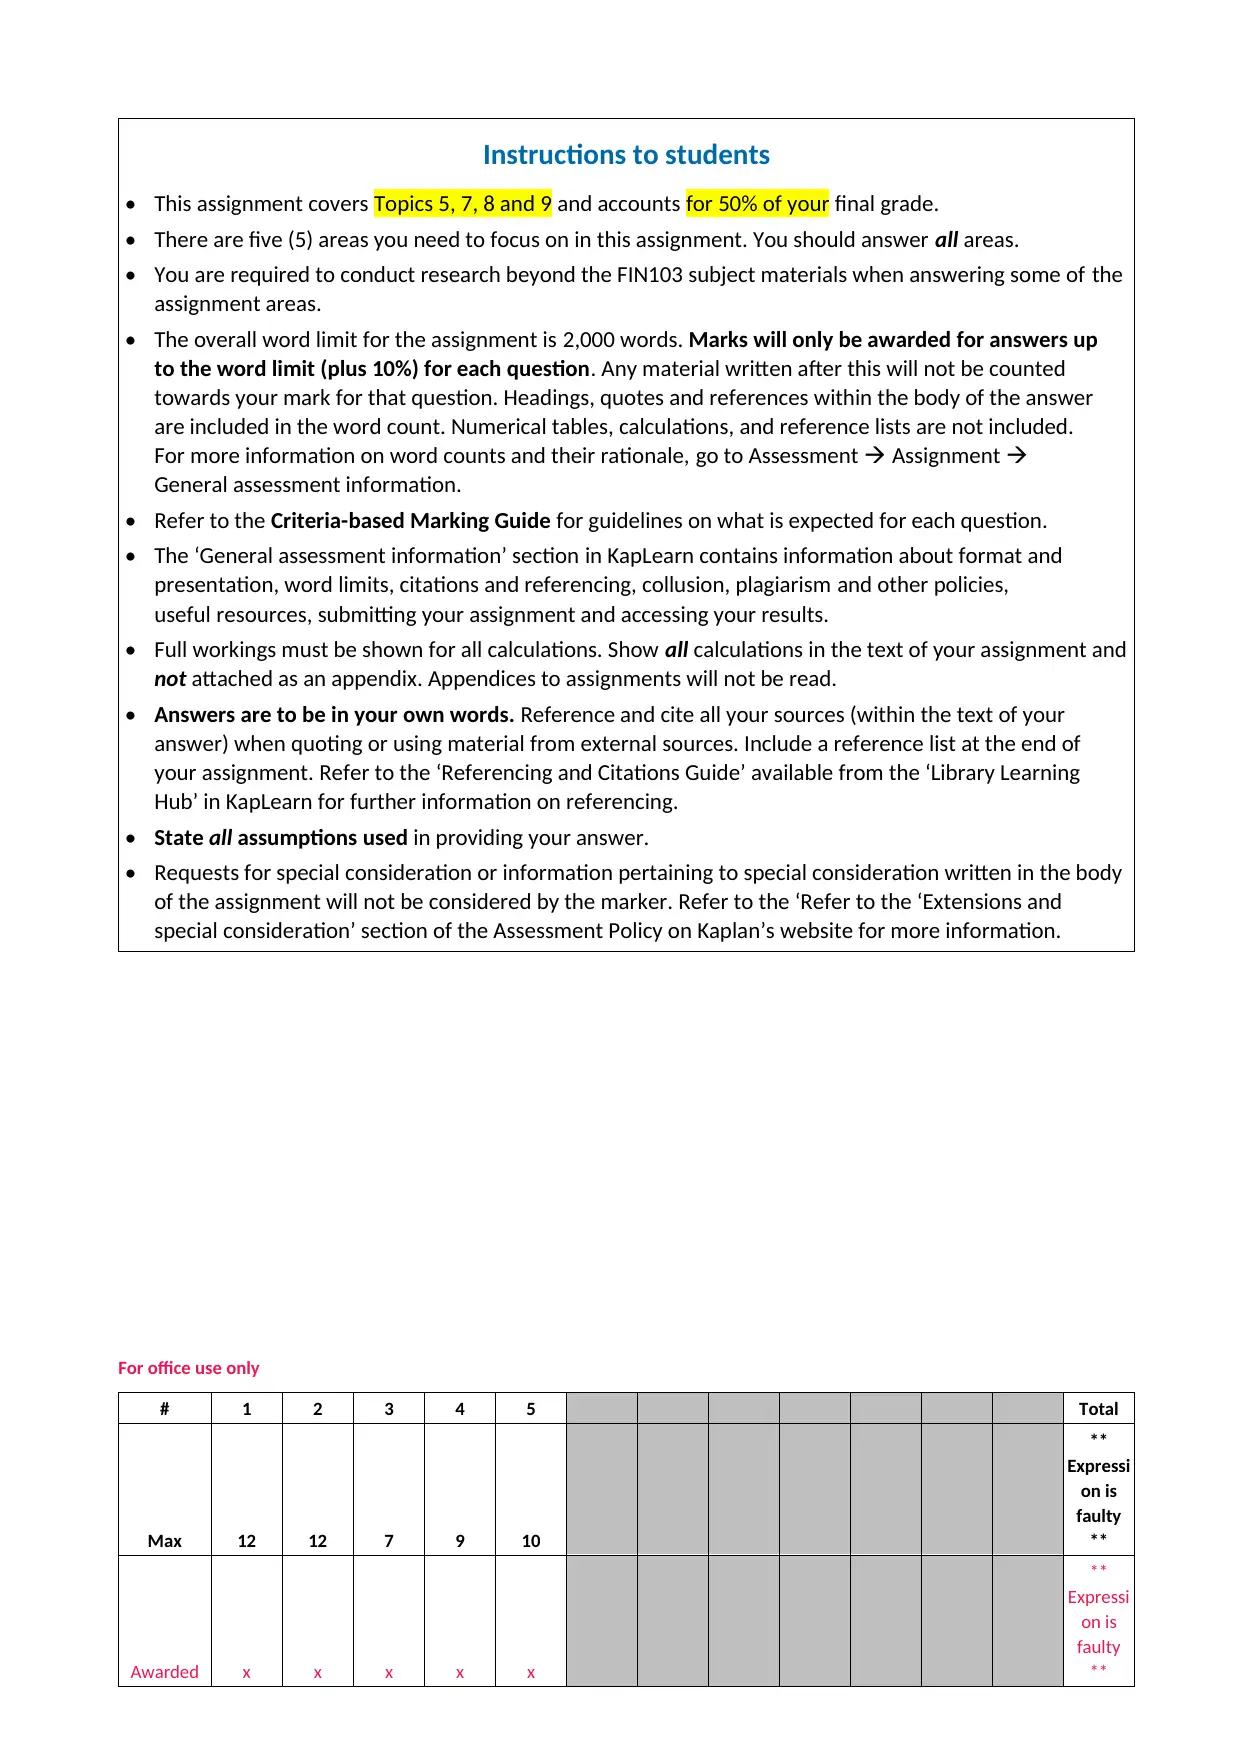
Instructions to students
• This assignment covers Topics 5, 7, 8 and 9 and accounts for 50% of your final grade.
• There are five (5) areas you need to focus on in this assignment. You should answer all areas.
• You are required to conduct research beyond the FIN103 subject materials when answering some of the
assignment areas.
• The overall word limit for the assignment is 2,000 words. Marks will only be awarded for answers up
to the word limit (plus 10%) for each question. Any material written after this will not be counted
towards your mark for that question. Headings, quotes and references within the body of the answer
are included in the word count. Numerical tables, calculations, and reference lists are not included.
For more information on word counts and their rationale, go to Assessment Assignment
General assessment information.
• Refer to the Criteria-based Marking Guide for guidelines on what is expected for each question.
• The ‘General assessment information’ section in KapLearn contains information about format and
presentation, word limits, citations and referencing, collusion, plagiarism and other policies,
useful resources, submitting your assignment and accessing your results.
• Full workings must be shown for all calculations. Show all calculations in the text of your assignment and
not attached as an appendix. Appendices to assignments will not be read.
• Answers are to be in your own words. Reference and cite all your sources (within the text of your
answer) when quoting or using material from external sources. Include a reference list at the end of
your assignment. Refer to the ‘Referencing and Citations Guide’ available from the ‘Library Learning
Hub’ in KapLearn for further information on referencing.
• State all assumptions used in providing your answer.
• Requests for special consideration or information pertaining to special consideration written in the body
of the assignment will not be considered by the marker. Refer to the ‘Refer to the ‘Extensions and
special consideration’ section of the Assessment Policy on Kaplan’s website for more information.
For office use only
# 1 2 3 4 5 Total
Max 12 12 7 9 10
**
Expressi
on is
faulty
**
Awarded x x x x x
**
Expressi
on is
faulty
**
⊘ This is a preview!⊘
Do you want full access?
Subscribe today to unlock all pages.
Trusted by 1+ million students worldwide
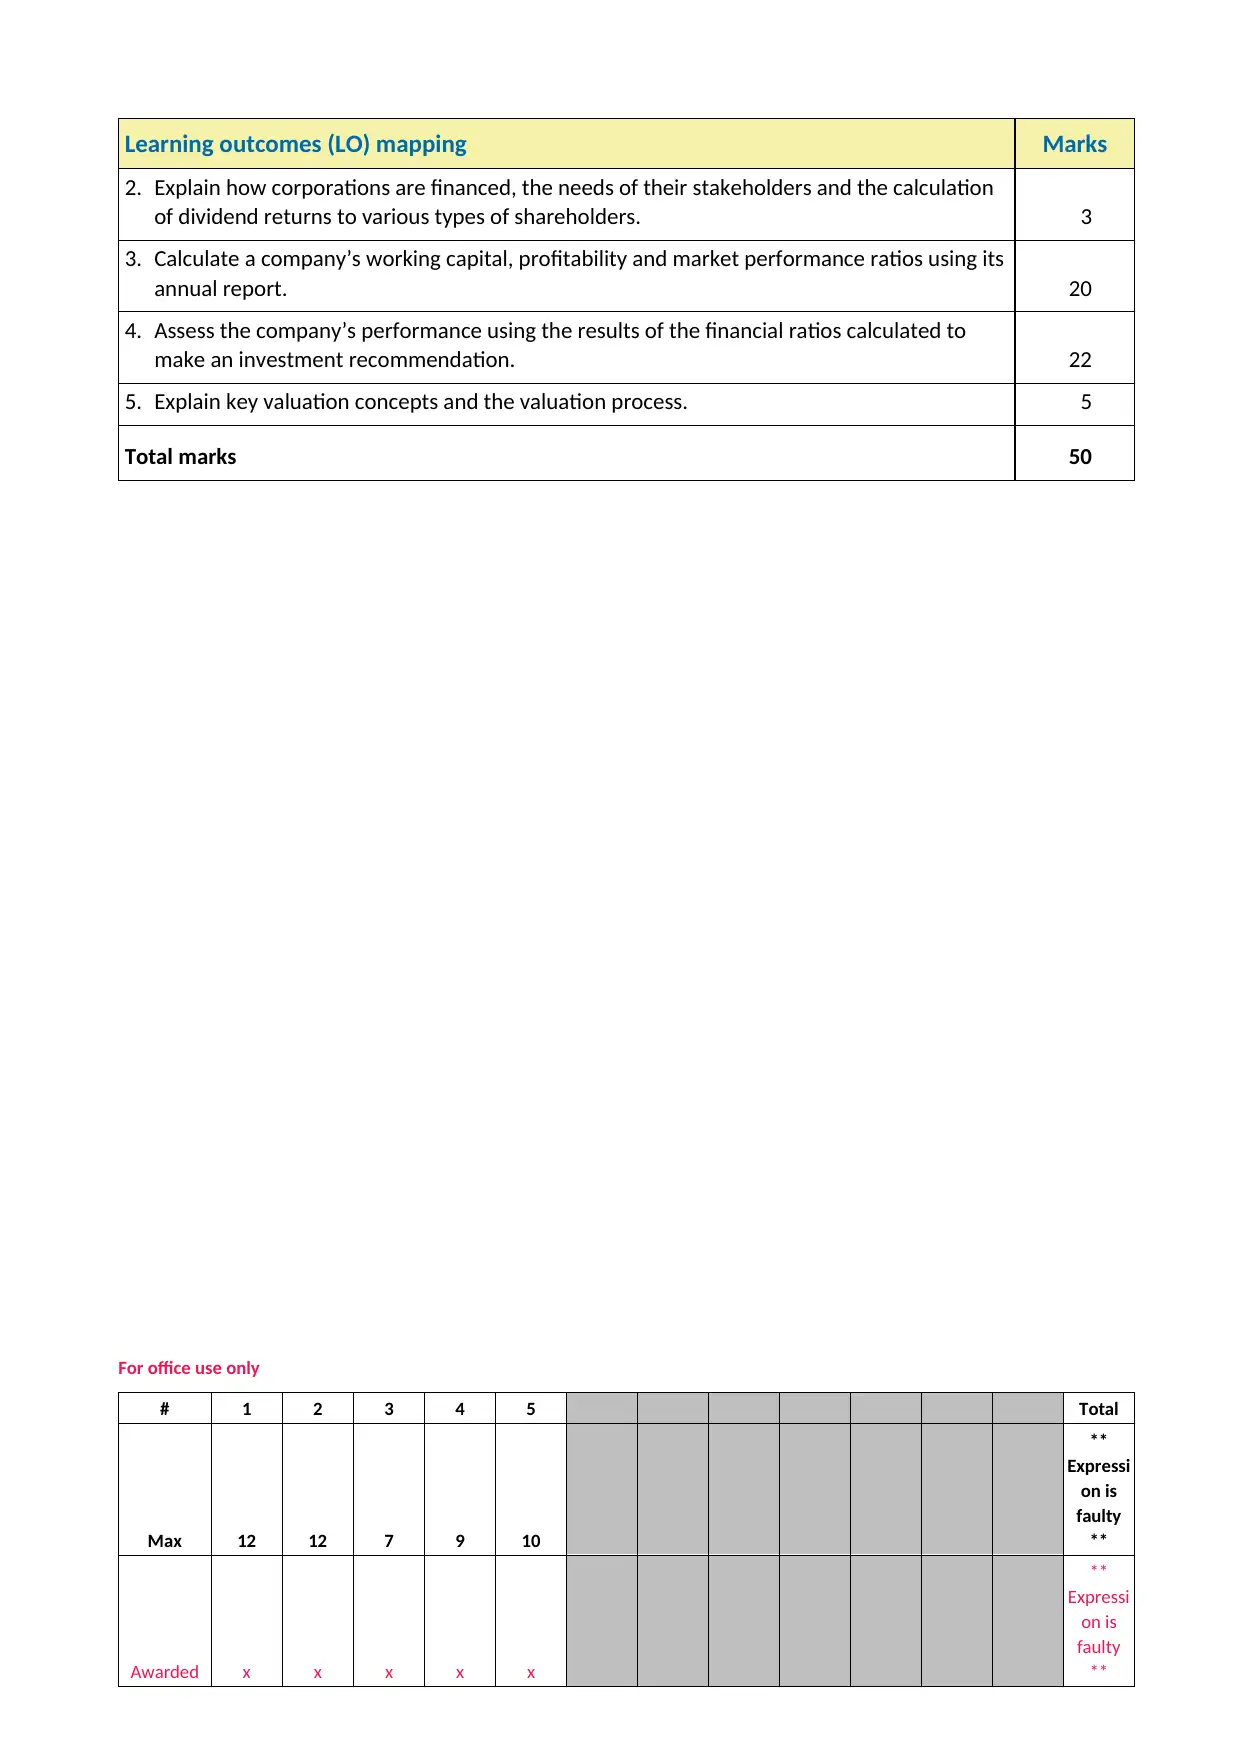
Learning outcomes (LO) mapping Marks
2. Explain how corporations are financed, the needs of their stakeholders and the calculation
of dividend returns to various types of shareholders. 3
3. Calculate a company’s working capital, profitability and market performance ratios using its
annual report. 20
4. Assess the company’s performance using the results of the financial ratios calculated to
make an investment recommendation. 22
5. Explain key valuation concepts and the valuation process. 5
Total marks 50
For office use only
# 1 2 3 4 5 Total
Max 12 12 7 9 10
**
Expressi
on is
faulty
**
Awarded x x x x x
**
Expressi
on is
faulty
**
Paraphrase This Document
Need a fresh take? Get an instant paraphrase of this document with our AI Paraphraser
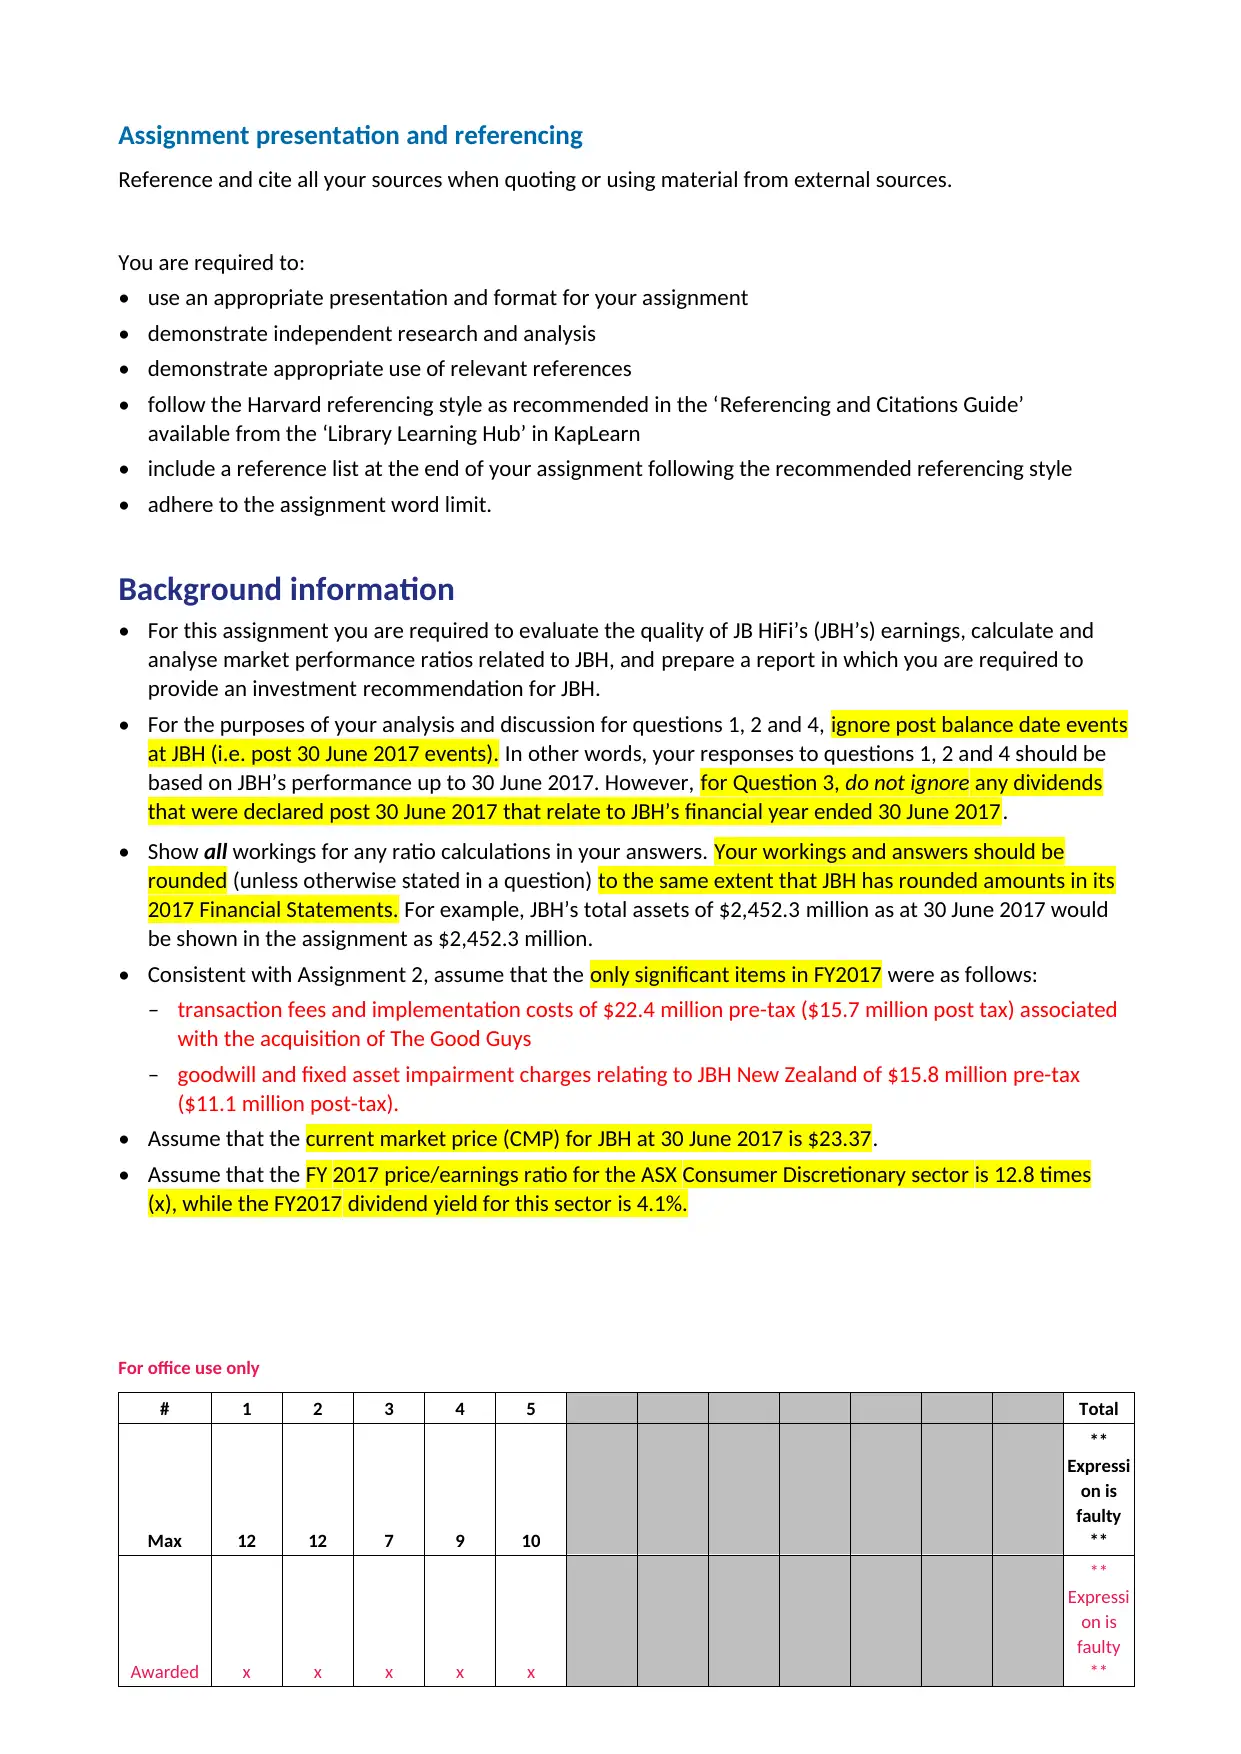
Assignment presentation and referencing
Reference and cite all your sources when quoting or using material from external sources.
You are required to:
• use an appropriate presentation and format for your assignment
• demonstrate independent research and analysis
• demonstrate appropriate use of relevant references
• follow the Harvard referencing style as recommended in the ‘Referencing and Citations Guide’
available from the ‘Library Learning Hub’ in KapLearn
• include a reference list at the end of your assignment following the recommended referencing style
• adhere to the assignment word limit.
Background information
• For this assignment you are required to evaluate the quality of JB HiFi’s (JBH’s) earnings, calculate and
analyse market performance ratios related to JBH, and prepare a report in which you are required to
provide an investment recommendation for JBH.
• For the purposes of your analysis and discussion for questions 1, 2 and 4, ignore post balance date events
at JBH (i.e. post 30 June 2017 events). In other words, your responses to questions 1, 2 and 4 should be
based on JBH’s performance up to 30 June 2017. However, for Question 3, do not ignore any dividends
that were declared post 30 June 2017 that relate to JBH’s financial year ended 30 June 2017.
• Show all workings for any ratio calculations in your answers. Your workings and answers should be
rounded (unless otherwise stated in a question) to the same extent that JBH has rounded amounts in its
2017 Financial Statements. For example, JBH’s total assets of $2,452.3 million as at 30 June 2017 would
be shown in the assignment as $2,452.3 million.
• Consistent with Assignment 2, assume that the only significant items in FY2017 were as follows:
– transaction fees and implementation costs of $22.4 million pre-tax ($15.7 million post tax) associated
with the acquisition of The Good Guys
– goodwill and fixed asset impairment charges relating to JBH New Zealand of $15.8 million pre-tax
($11.1 million post-tax).
• Assume that the current market price (CMP) for JBH at 30 June 2017 is $23.37.
• Assume that the FY 2017 price/earnings ratio for the ASX Consumer Discretionary sector is 12.8 times
(x), while the FY2017 dividend yield for this sector is 4.1%.
For office use only
# 1 2 3 4 5 Total
Max 12 12 7 9 10
**
Expressi
on is
faulty
**
Awarded x x x x x
**
Expressi
on is
faulty
**
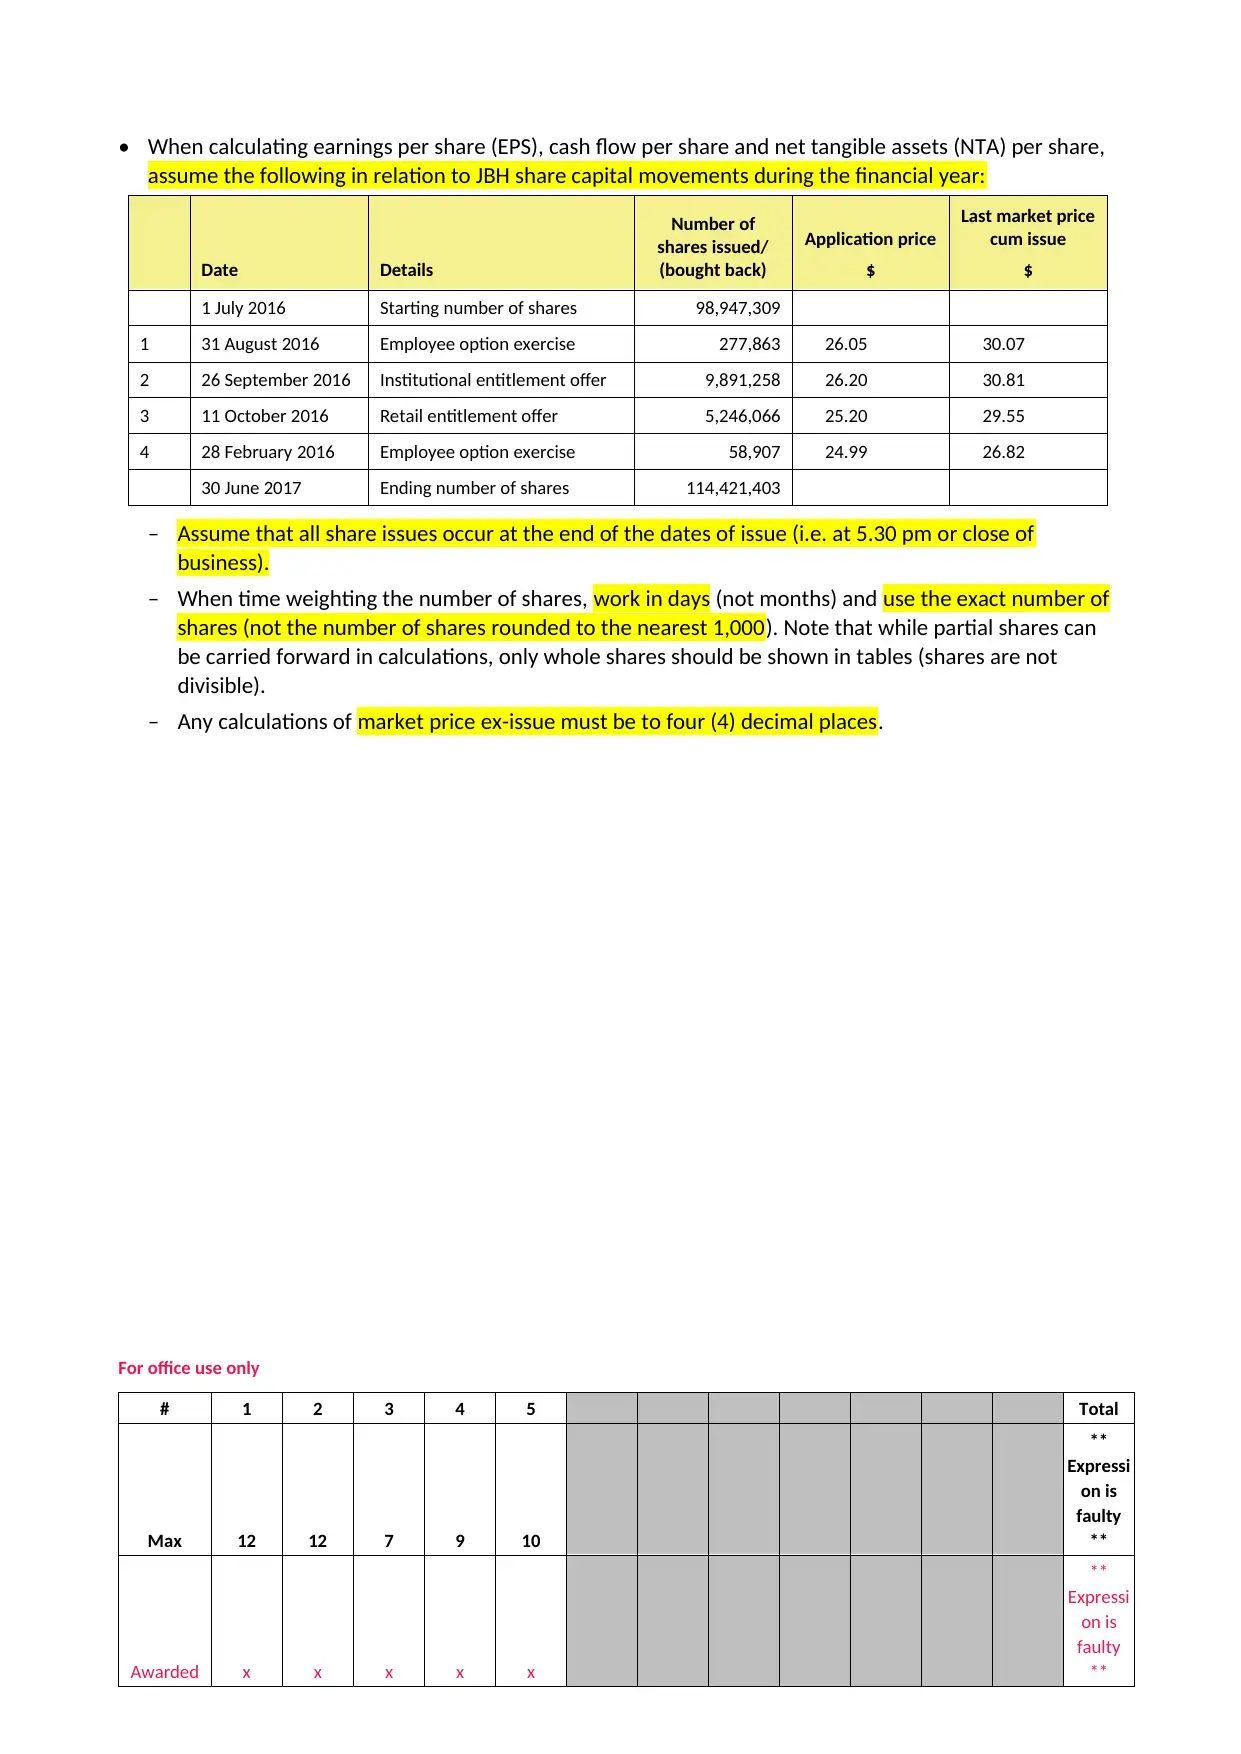
• When calculating earnings per share (EPS), cash flow per share and net tangible assets (NTA) per share,
assume the following in relation to JBH share capital movements during the financial year:
Date Details
Number of
shares issued/
(bought back)
Application price
$
Last market price
cum issue
$
1 July 2016 Starting number of shares 98,947,309
1 31 August 2016 Employee option exercise 277,863 26.05 30.07
2 26 September 2016 Institutional entitlement offer 9,891,258 26.20 30.81
3 11 October 2016 Retail entitlement offer 5,246,066 25.20 29.55
4 28 February 2016 Employee option exercise 58,907 24.99 26.82
30 June 2017 Ending number of shares 114,421,403
– Assume that all share issues occur at the end of the dates of issue (i.e. at 5.30 pm or close of
business).
– When time weighting the number of shares, work in days (not months) and use the exact number of
shares (not the number of shares rounded to the nearest 1,000). Note that while partial shares can
be carried forward in calculations, only whole shares should be shown in tables (shares are not
divisible).
– Any calculations of market price ex-issue must be to four (4) decimal places.
For office use only
# 1 2 3 4 5 Total
Max 12 12 7 9 10
**
Expressi
on is
faulty
**
Awarded x x x x x
**
Expressi
on is
faulty
**
⊘ This is a preview!⊘
Do you want full access?
Subscribe today to unlock all pages.
Trusted by 1+ million students worldwide
Question 1 Quality of earnings (12 marks | Word limit: 500 words)
LO3: Calculate a company’s working capital, profitability and market performance ratios using its
annual report.
LO4: Assess the company’s performance using the results of the financial ratios calculated to make an
investment recommendation.
(a) Evaluate JBH’s quality of earnings with reference to the trend in earnings results (at the earnings
before interest and taxes (EBIT) level as disclosed in JBH’s 2017 Annual Report) over the past five
years; the occurrence of significant items in FY17; and the nature of its earnings base. Then provide
an overall conclusion about JBH’s earnings quality. (7 marks)
(b) Calculate JBH’s 2017 effective tax rate to the nearest whole percentage and provide a brief
assessment of JBH’s effective tax rate. (3 marks)
(c) Calculate JBH’s 2017 financial gearing profitability ratio ($m) to one (1) decimal place and provide an
evaluation of this ratio. (2 marks)
Criteria-based marking guide for Question 1
Excellent (Mark range: 10–12 marks) Satisfactory (Mark range: 6–9 marks) Unsatisfactory (Mark range: 0–5 marks)
• provides an evaluation of JBH’s EBIT
trend over the last five years;
the incidence of significant items in
FY17; the quality of JBH’s earnings,
covering all (or nearly all) key points.
Provides an overall conclusion
• provides an evaluation of some of the
following: JBH’s EBIT trend over the last
five years; the incidence of significant
items in FY17; the quality of JBH’s
earnings and an overall conclusion.
However, the answer does not mention
all key points
• makes little or no attempt to the
consider the following: JBH’s EBIT trend
over the last five years; the incidence of
significant items in FY17; the quality of
JBH’s earnings and an overall conclusion
For office use only
# 1 2 3 4 5 Total
Max 12 12 7 9 10
**
Expressi
on is
faulty
**
Awarded x x x x x
**
Expressi
on is
faulty
**
Paraphrase This Document
Need a fresh take? Get an instant paraphrase of this document with our AI Paraphraser
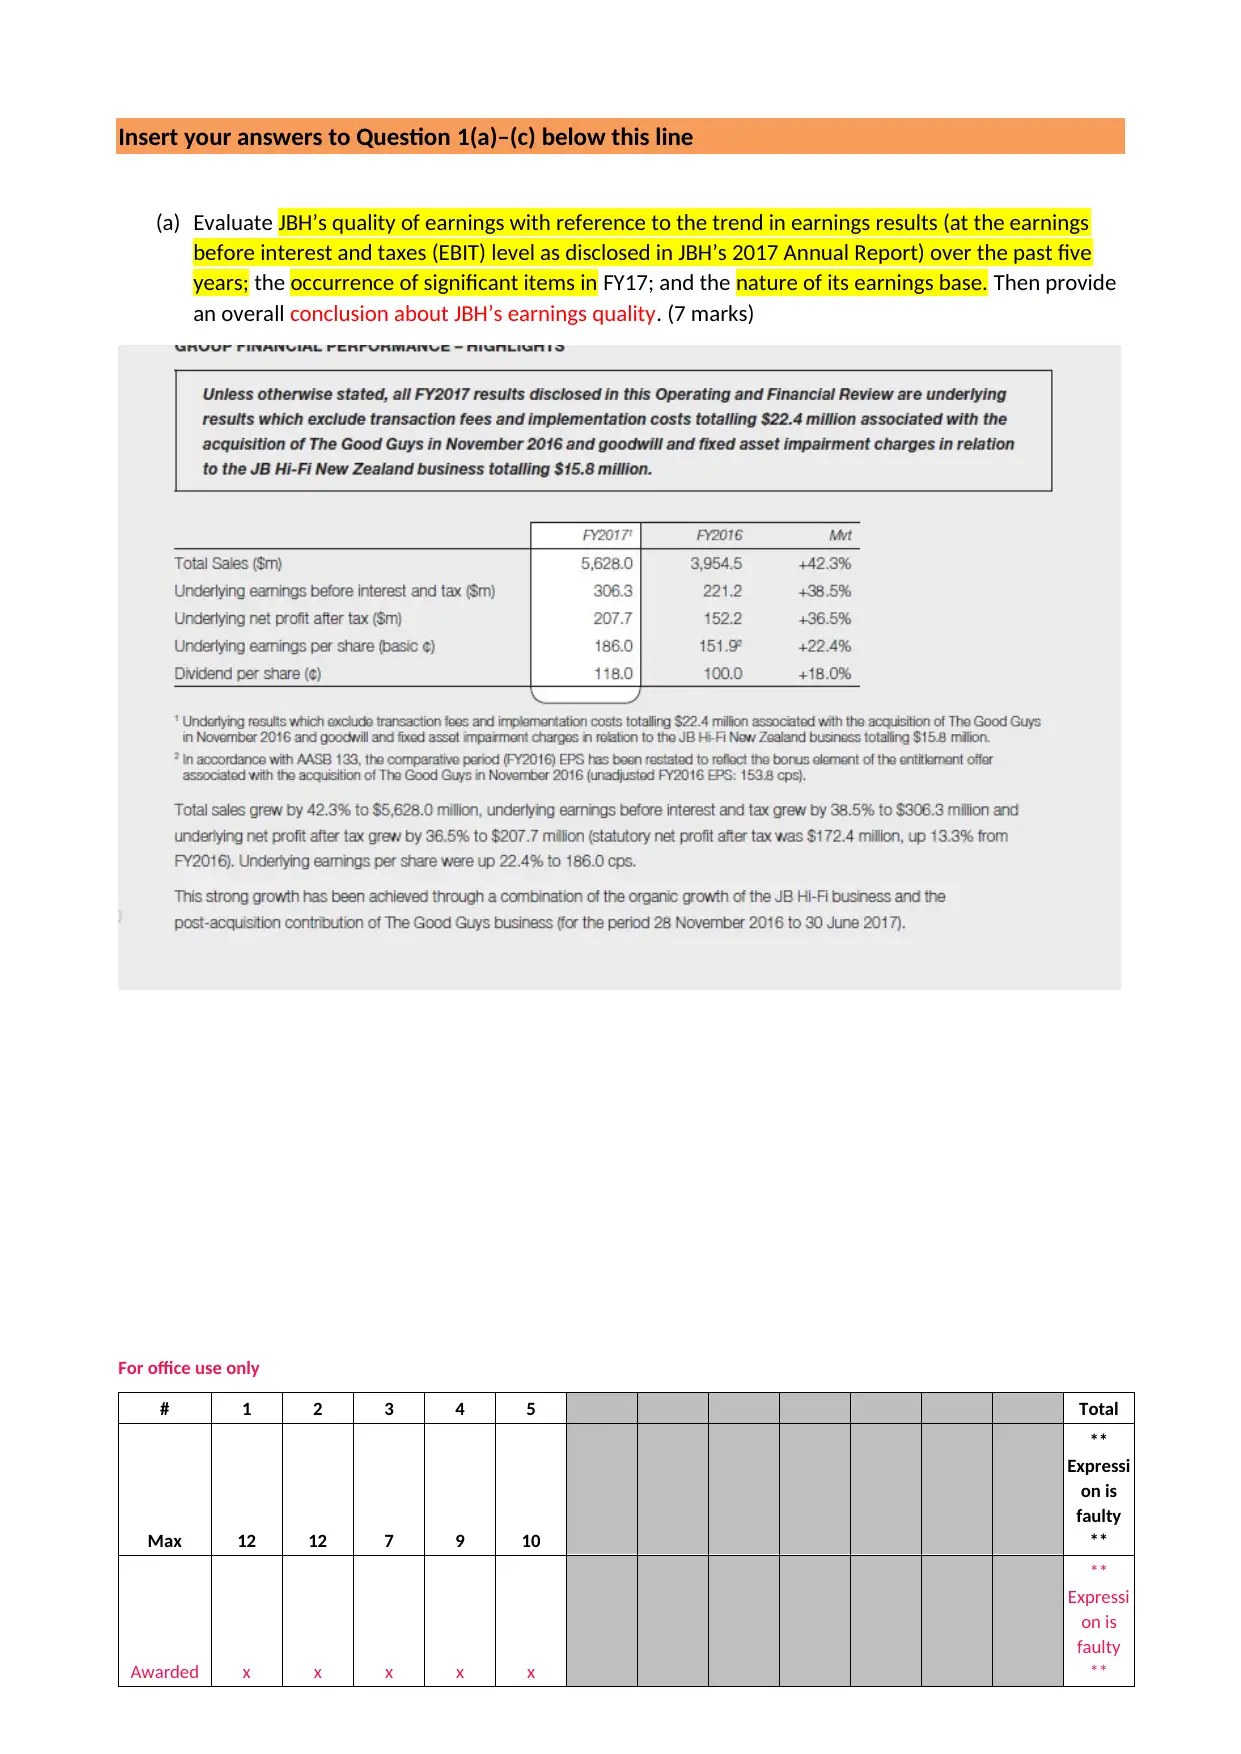
Insert your answers to Question 1(a)–(c) below this line
(a) Evaluate JBH’s quality of earnings with reference to the trend in earnings results (at the earnings
before interest and taxes (EBIT) level as disclosed in JBH’s 2017 Annual Report) over the past five
years; the occurrence of significant items in FY17; and the nature of its earnings base. Then provide
an overall conclusion about JBH’s earnings quality. (7 marks)
For office use only
# 1 2 3 4 5 Total
Max 12 12 7 9 10
**
Expressi
on is
faulty
**
Awarded x x x x x
**
Expressi
on is
faulty
**
Page 27
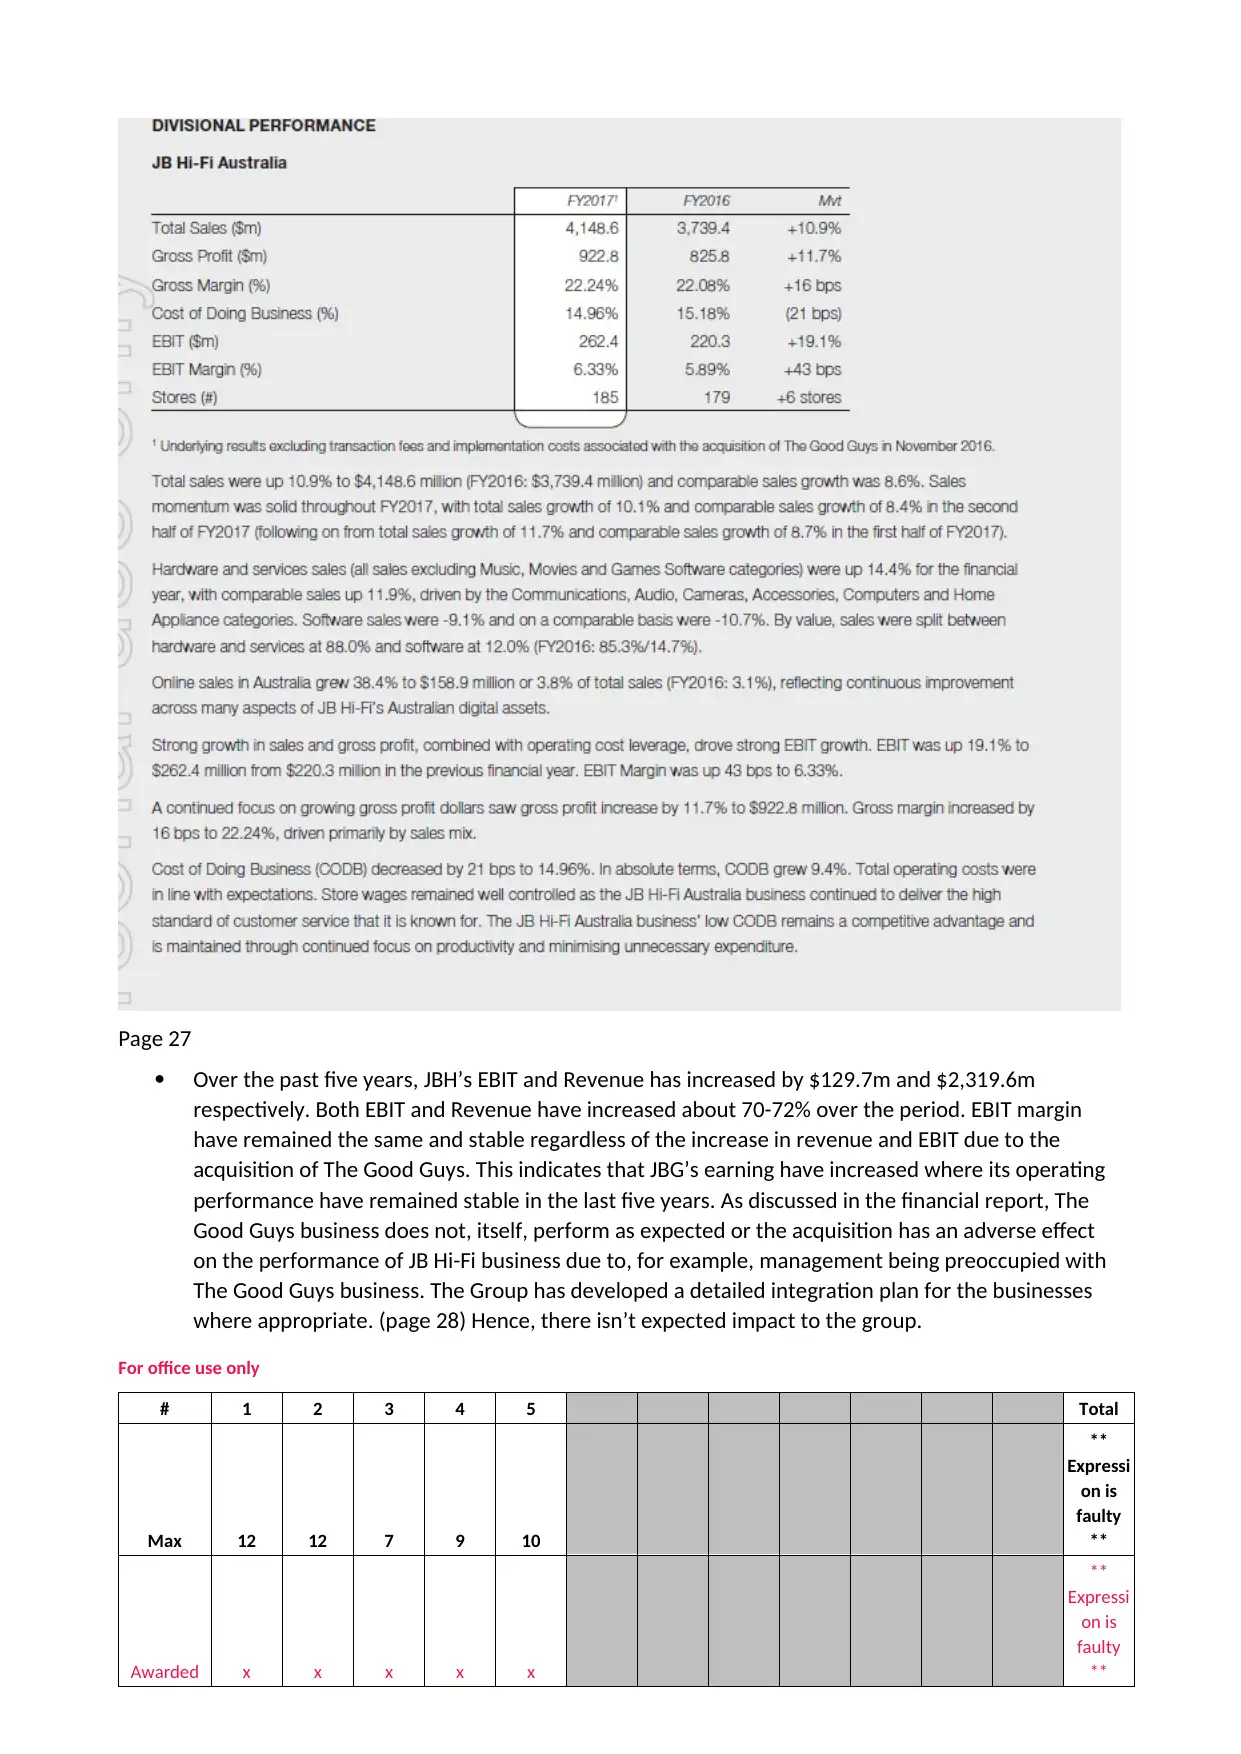
Over the past five years, JBH’s EBIT and Revenue has increased by $129.7m and $2,319.6m
respectively. Both EBIT and Revenue have increased about 70-72% over the period. EBIT margin
have remained the same and stable regardless of the increase in revenue and EBIT due to the
acquisition of The Good Guys. This indicates that JBG’s earning have increased where its operating
performance have remained stable in the last five years. As discussed in the financial report, The
Good Guys business does not, itself, perform as expected or the acquisition has an adverse effect
on the performance of JB Hi-Fi business due to, for example, management being preoccupied with
The Good Guys business. The Group has developed a detailed integration plan for the businesses
where appropriate. (page 28) Hence, there isn’t expected impact to the group.
For office use only
# 1 2 3 4 5 Total
Max 12 12 7 9 10
**
Expressi
on is
faulty
**
Awarded x x x x x
**
Expressi
on is
faulty
**
⊘ This is a preview!⊘
Do you want full access?
Subscribe today to unlock all pages.
Trusted by 1+ million students worldwide
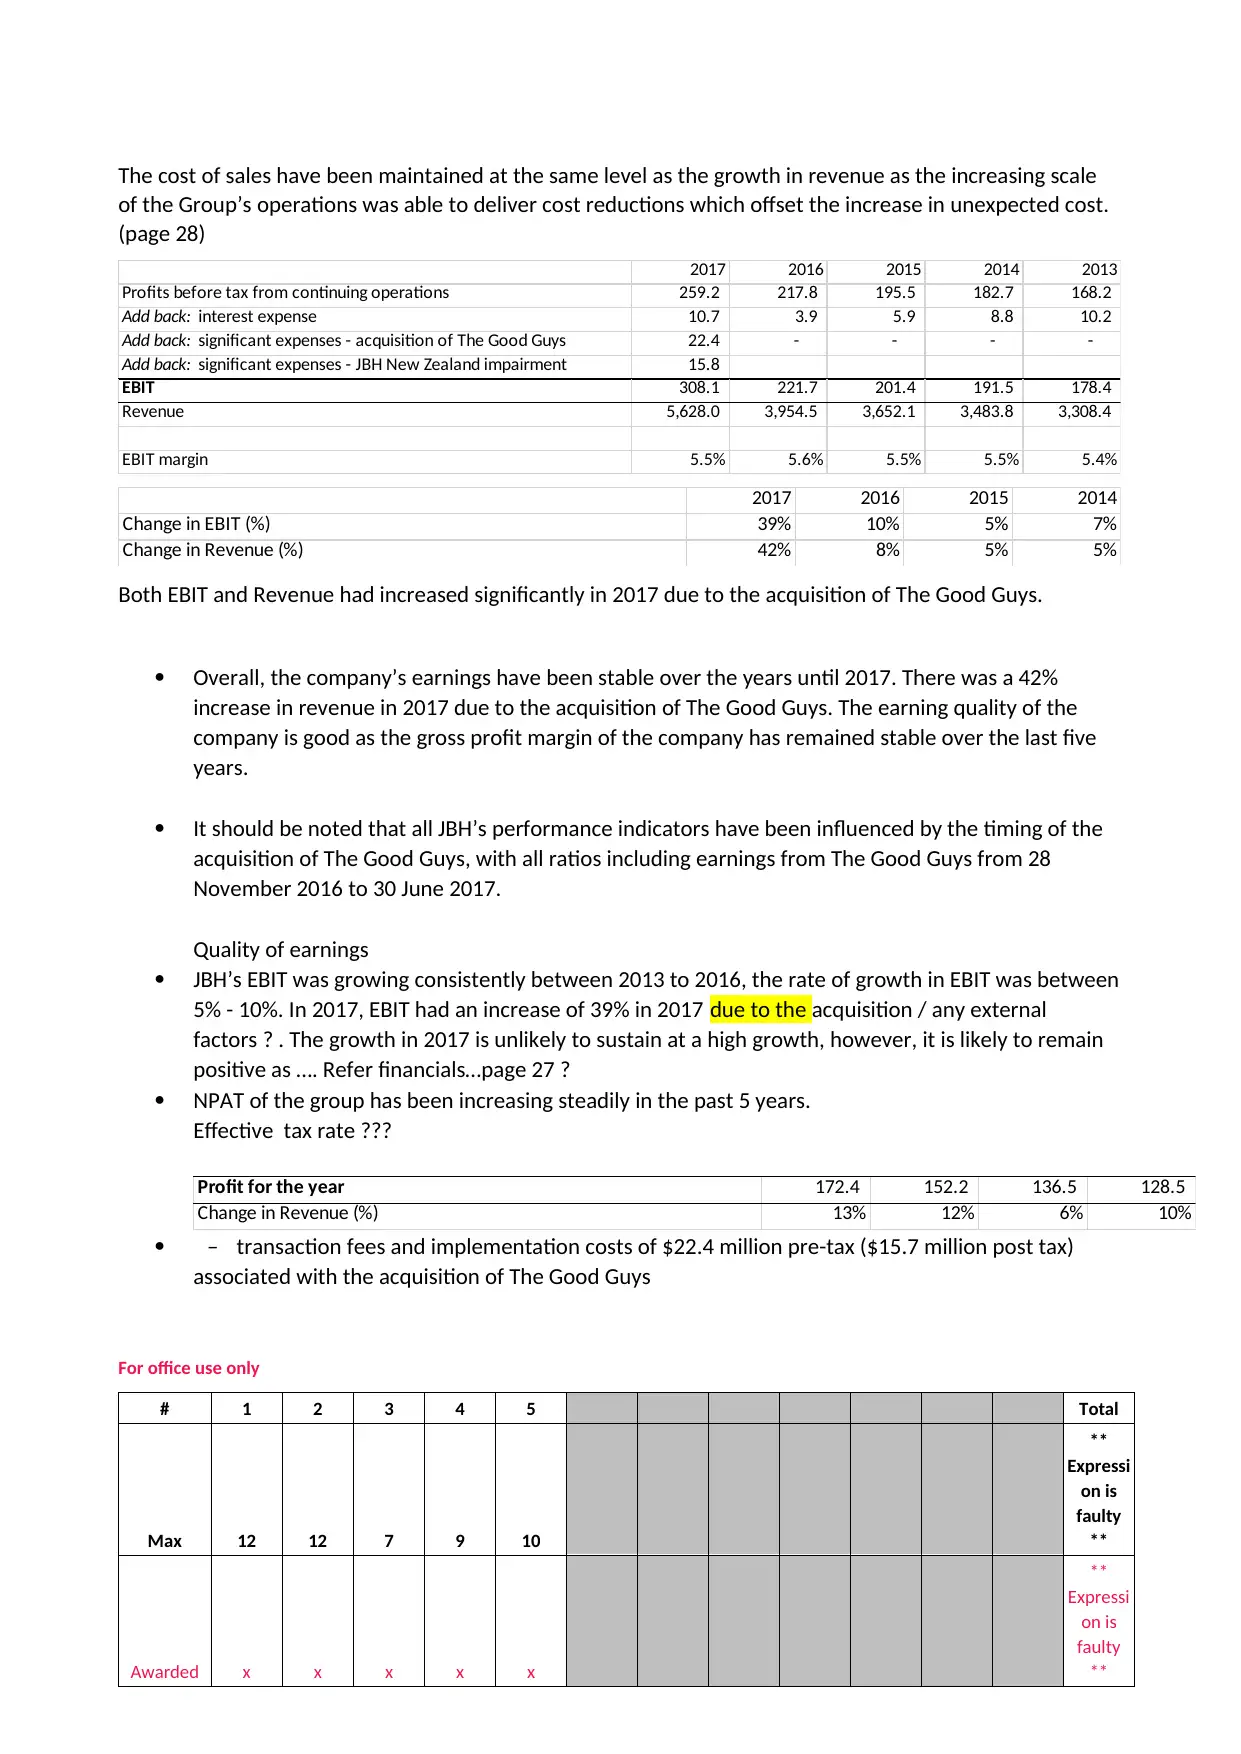
The cost of sales have been maintained at the same level as the growth in revenue as the increasing scale
of the Group’s operations was able to deliver cost reductions which offset the increase in unexpected cost.
(page 28)
2017 2016 2015 2014 2013
Profits before tax from continuing operations 259.2 217.8 195.5 182.7 168.2
Add back: interest expense 10.7 3.9 5.9 8.8 10.2
Add back: significant expenses - acquisition of The Good Guys 22.4 - - - -
Add back: significant expenses - JBH New Zealand impairment 15.8
EBIT 308.1 221.7 201.4 191.5 178.4
Revenue 5,628.0 3,954.5 3,652.1 3,483.8 3,308.4
EBIT margin 5.5% 5.6% 5.5% 5.5% 5.4%
2017 2016 2015 2014
Change in EBIT (%) 39% 10% 5% 7%
Change in Revenue (%) 42% 8% 5% 5%
Both EBIT and Revenue had increased significantly in 2017 due to the acquisition of The Good Guys.
Overall, the company’s earnings have been stable over the years until 2017. There was a 42%
increase in revenue in 2017 due to the acquisition of The Good Guys. The earning quality of the
company is good as the gross profit margin of the company has remained stable over the last five
years.
It should be noted that all JBH’s performance indicators have been influenced by the timing of the
acquisition of The Good Guys, with all ratios including earnings from The Good Guys from 28
November 2016 to 30 June 2017.
Quality of earnings
JBH’s EBIT was growing consistently between 2013 to 2016, the rate of growth in EBIT was between
5% - 10%. In 2017, EBIT had an increase of 39% in 2017 due to the acquisition / any external
factors ? . The growth in 2017 is unlikely to sustain at a high growth, however, it is likely to remain
positive as …. Refer financials…page 27 ?
NPAT of the group has been increasing steadily in the past 5 years.
Effective tax rate ???
Profit for the year 172.4 152.2 136.5 128.5
Change in Revenue (%) 13% 12% 6% 10%
– transaction fees and implementation costs of $22.4 million pre-tax ($15.7 million post tax)
associated with the acquisition of The Good Guys
For office use only
# 1 2 3 4 5 Total
Max 12 12 7 9 10
**
Expressi
on is
faulty
**
Awarded x x x x x
**
Expressi
on is
faulty
**
Paraphrase This Document
Need a fresh take? Get an instant paraphrase of this document with our AI Paraphraser
– goodwill and fixed asset impairment charges relating to JBH New Zealand of $15.8 million pre-
tax ($11.1 million post-tax).
Both significant expenses have affected the profits from continuing operations, however it has
been offset by the increase of revenue from The Good Guys earnings – to be confirmed ?
It is expected that the increase of revenue from The Good Guys should be reflected in profit in the
next financial year without the one-off cost.
Nature of earnings base:
It has been noted that company’s profits were derived from different sector and geographical
region.
other income – consulting ?
the good guys ?
new Zealand, online
Products offered by the group
(b) (b) Calculate JBH’s 2017 effective tax rate to the nearest whole percentage and provide a brief
assessment of JBH’s effective tax rate. (3 marks)
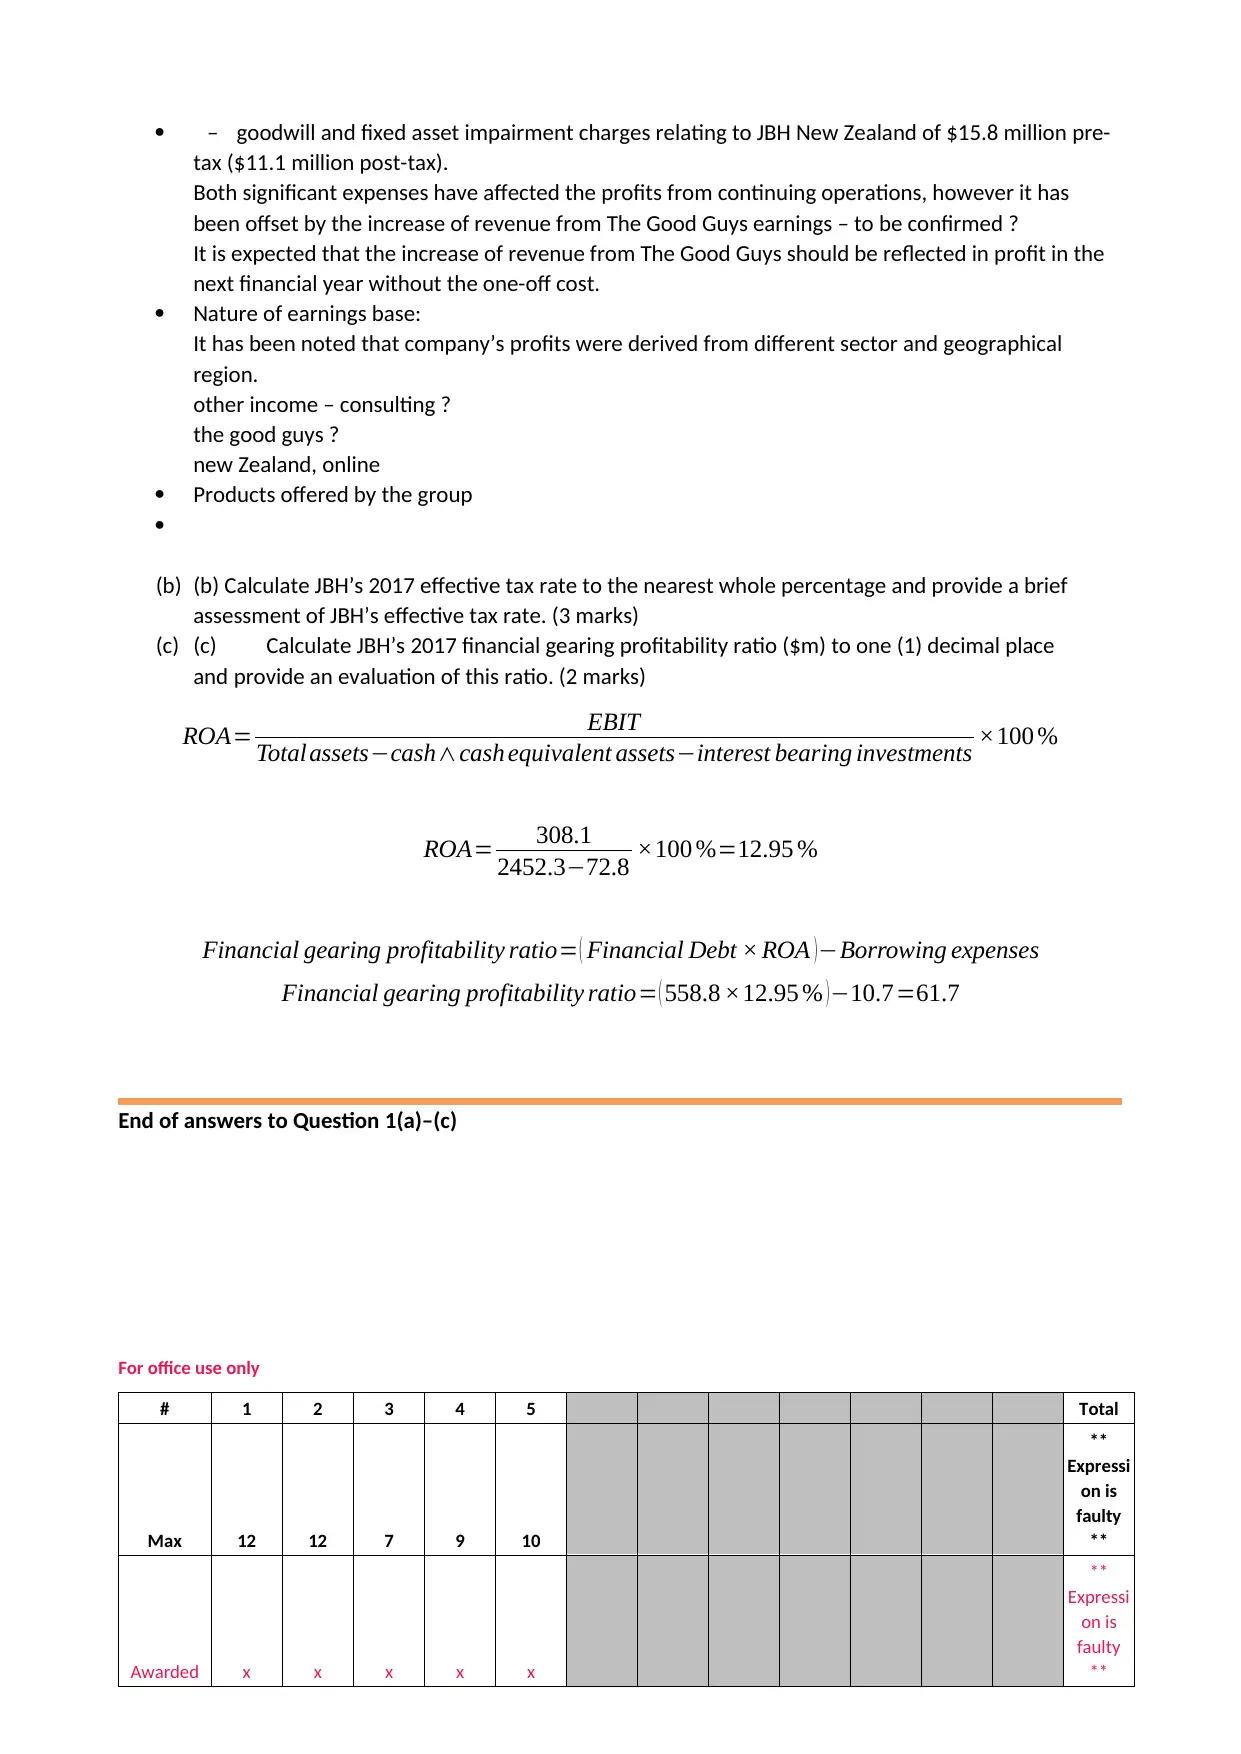
(c) (c) Calculate JBH’s 2017 financial gearing profitability ratio ($m) to one (1) decimal place
and provide an evaluation of this ratio. (2 marks)
ROA= EBIT
Total assets−cash∧cash equivalent assets−interest bearing investments ×100 %
ROA= 308.1
2452.3−72.8 ×100 %=12.95 %
Financial gearing profitability ratio= ( Financial Debt × ROA ) −Borrowing expenses
Financial gearing profitability ratio= ( 558.8 ×12.95 % )−10.7=61.7
End of answers to Question 1(a)–(c)
For office use only
# 1 2 3 4 5 Total
Max 12 12 7 9 10
**
Expressi
on is
faulty
**
Awarded x x x x x
**
Expressi
on is
faulty
**
tax ($11.1 million post-tax).
Both significant expenses have affected the profits from continuing operations, however it has
been offset by the increase of revenue from The Good Guys earnings – to be confirmed ?
It is expected that the increase of revenue from The Good Guys should be reflected in profit in the
next financial year without the one-off cost.
Nature of earnings base:
It has been noted that company’s profits were derived from different sector and geographical
region.
other income – consulting ?
the good guys ?
new Zealand, online
Products offered by the group
(b) (b) Calculate JBH’s 2017 effective tax rate to the nearest whole percentage and provide a brief
assessment of JBH’s effective tax rate. (3 marks)
(c) (c) Calculate JBH’s 2017 financial gearing profitability ratio ($m) to one (1) decimal place
and provide an evaluation of this ratio. (2 marks)
ROA= EBIT
Total assets−cash∧cash equivalent assets−interest bearing investments ×100 %
ROA= 308.1
2452.3−72.8 ×100 %=12.95 %
Financial gearing profitability ratio= ( Financial Debt × ROA ) −Borrowing expenses
Financial gearing profitability ratio= ( 558.8 ×12.95 % )−10.7=61.7
End of answers to Question 1(a)–(c)
For office use only
# 1 2 3 4 5 Total
Max 12 12 7 9 10
**
Expressi
on is
faulty
**
Awarded x x x x x
**
Expressi
on is
faulty
**
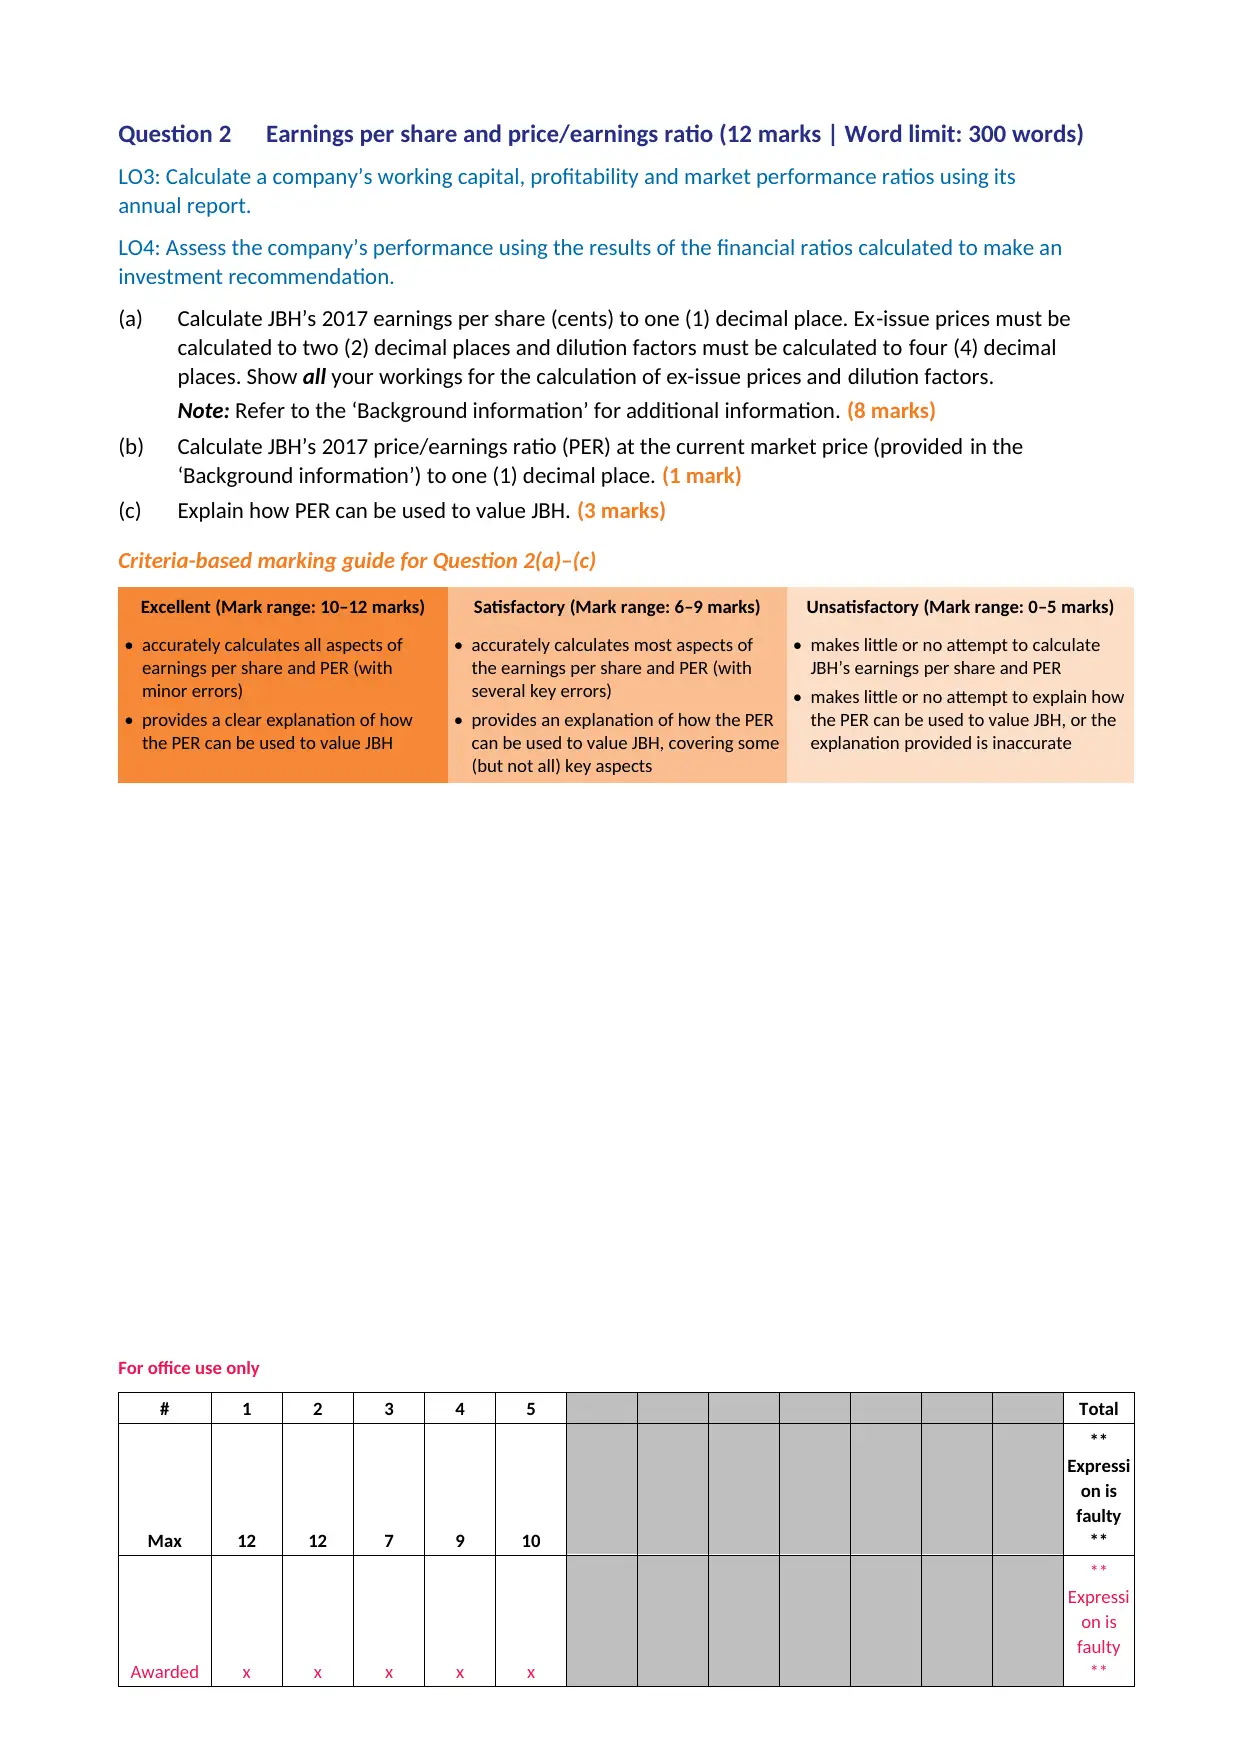
Question 2 Earnings per share and price/earnings ratio (12 marks | Word limit: 300 words)
LO3: Calculate a company’s working capital, profitability and market performance ratios using its
annual report.
LO4: Assess the company’s performance using the results of the financial ratios calculated to make an
investment recommendation.
(a) Calculate JBH’s 2017 earnings per share (cents) to one (1) decimal place. Ex-issue prices must be
calculated to two (2) decimal places and dilution factors must be calculated to four (4) decimal
places. Show all your workings for the calculation of ex-issue prices and dilution factors.
Note: Refer to the ‘Background information’ for additional information. (8 marks)
(b) Calculate JBH’s 2017 price/earnings ratio (PER) at the current market price (provided in the
‘Background information’) to one (1) decimal place. (1 mark)
(c) Explain how PER can be used to value JBH. (3 marks)
Criteria-based marking guide for Question 2(a)–(c)
Excellent (Mark range: 10–12 marks) Satisfactory (Mark range: 6–9 marks) Unsatisfactory (Mark range: 0–5 marks)
• accurately calculates all aspects of
earnings per share and PER (with
minor errors)
• provides a clear explanation of how
the PER can be used to value JBH
• accurately calculates most aspects of
the earnings per share and PER (with
several key errors)
• provides an explanation of how the PER
can be used to value JBH, covering some
(but not all) key aspects
• makes little or no attempt to calculate
JBH’s earnings per share and PER
• makes little or no attempt to explain how
the PER can be used to value JBH, or the
explanation provided is inaccurate
For office use only
# 1 2 3 4 5 Total
Max 12 12 7 9 10
**
Expressi
on is
faulty
**
Awarded x x x x x
**
Expressi
on is
faulty
**
⊘ This is a preview!⊘
Do you want full access?
Subscribe today to unlock all pages.
Trusted by 1+ million students worldwide
1 out of 22
Related Documents


Your All-in-One AI-Powered Toolkit for Academic Success.
+13062052269
info@desklib.com
Available 24*7 on WhatsApp / Email
![[object Object]](/_next/static/media/star-bottom.7253800d.svg)
Unlock your academic potential
Copyright © 2020–2026 A2Z Services. All Rights Reserved. Developed and managed by ZUCOL.